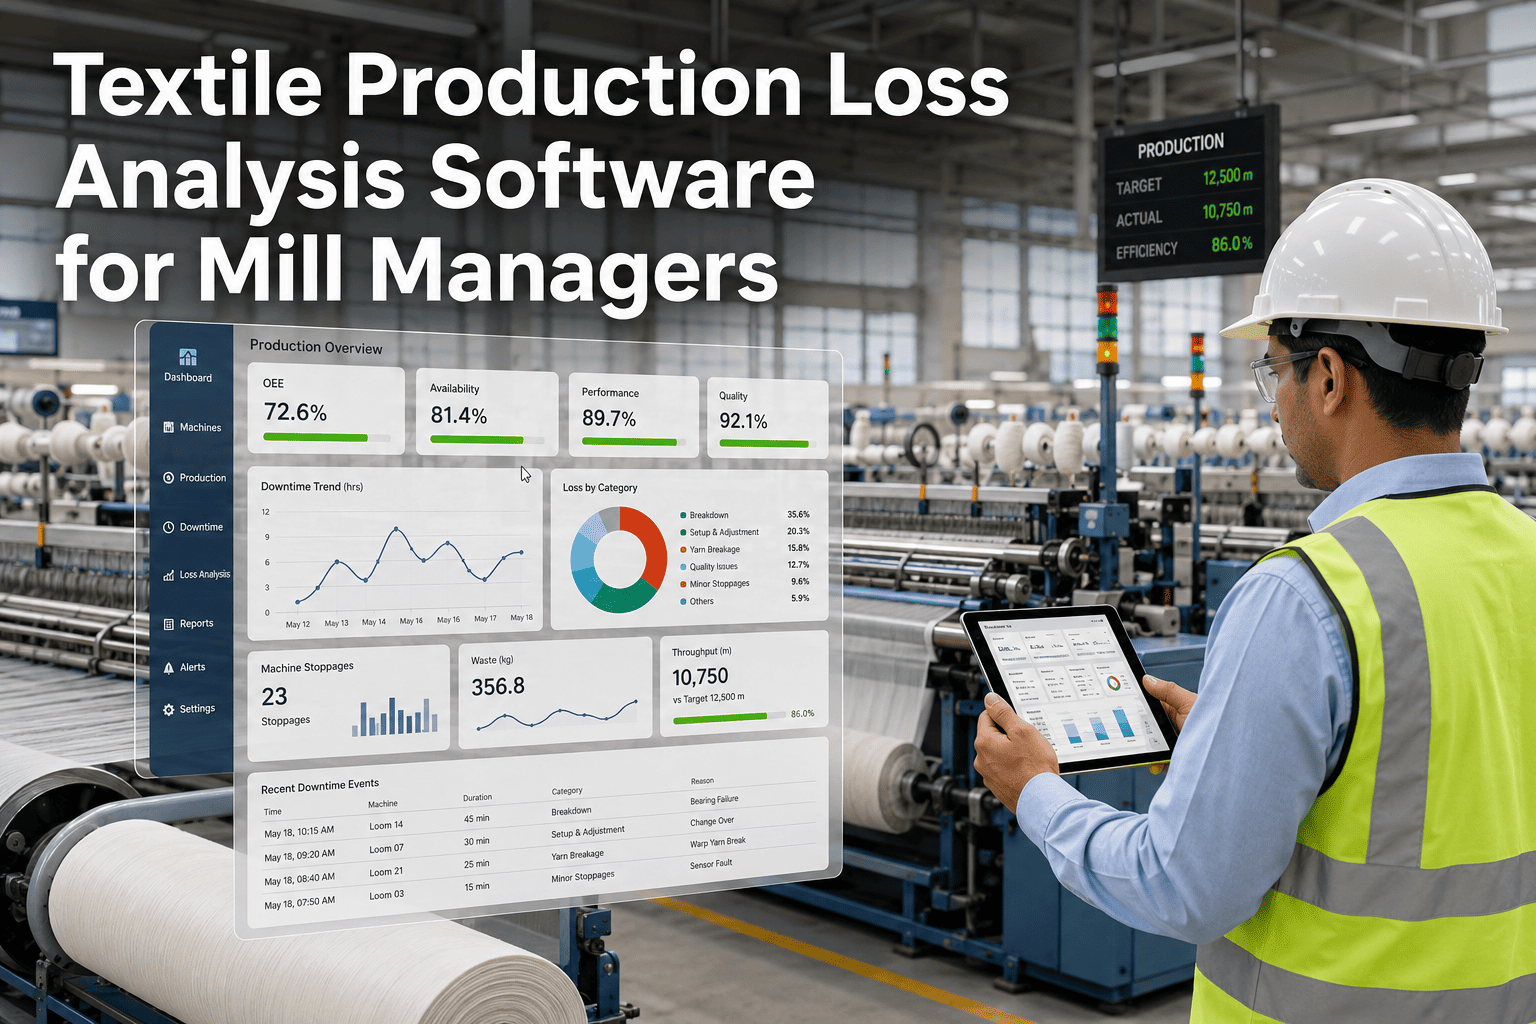
Ask a weaving shed supervisor why OEE sits at 62% and the answer usually starts and stops at "the looms break down a lot." Pull the actual stop-code data and a very different picture emerges: unplanned mechanical failure is rarely the largest loss category in a textile mill. Warp and weft breaks, beam-change knotting time, and lint-driven micro-stops routinely account for more lost production than outright breakdowns — and almost none of it shows up on a supervisor's whiteboard. Book a demo to see the Six Big Losses framework applied to your own loom, spinning frame, or knitting line data.
Textile → Production Downtime → Six Big Losses
Your Looms Aren't Down Because They're Broken. They're Down for Six Different Reasons — and You're Probably Only Tracking Two.
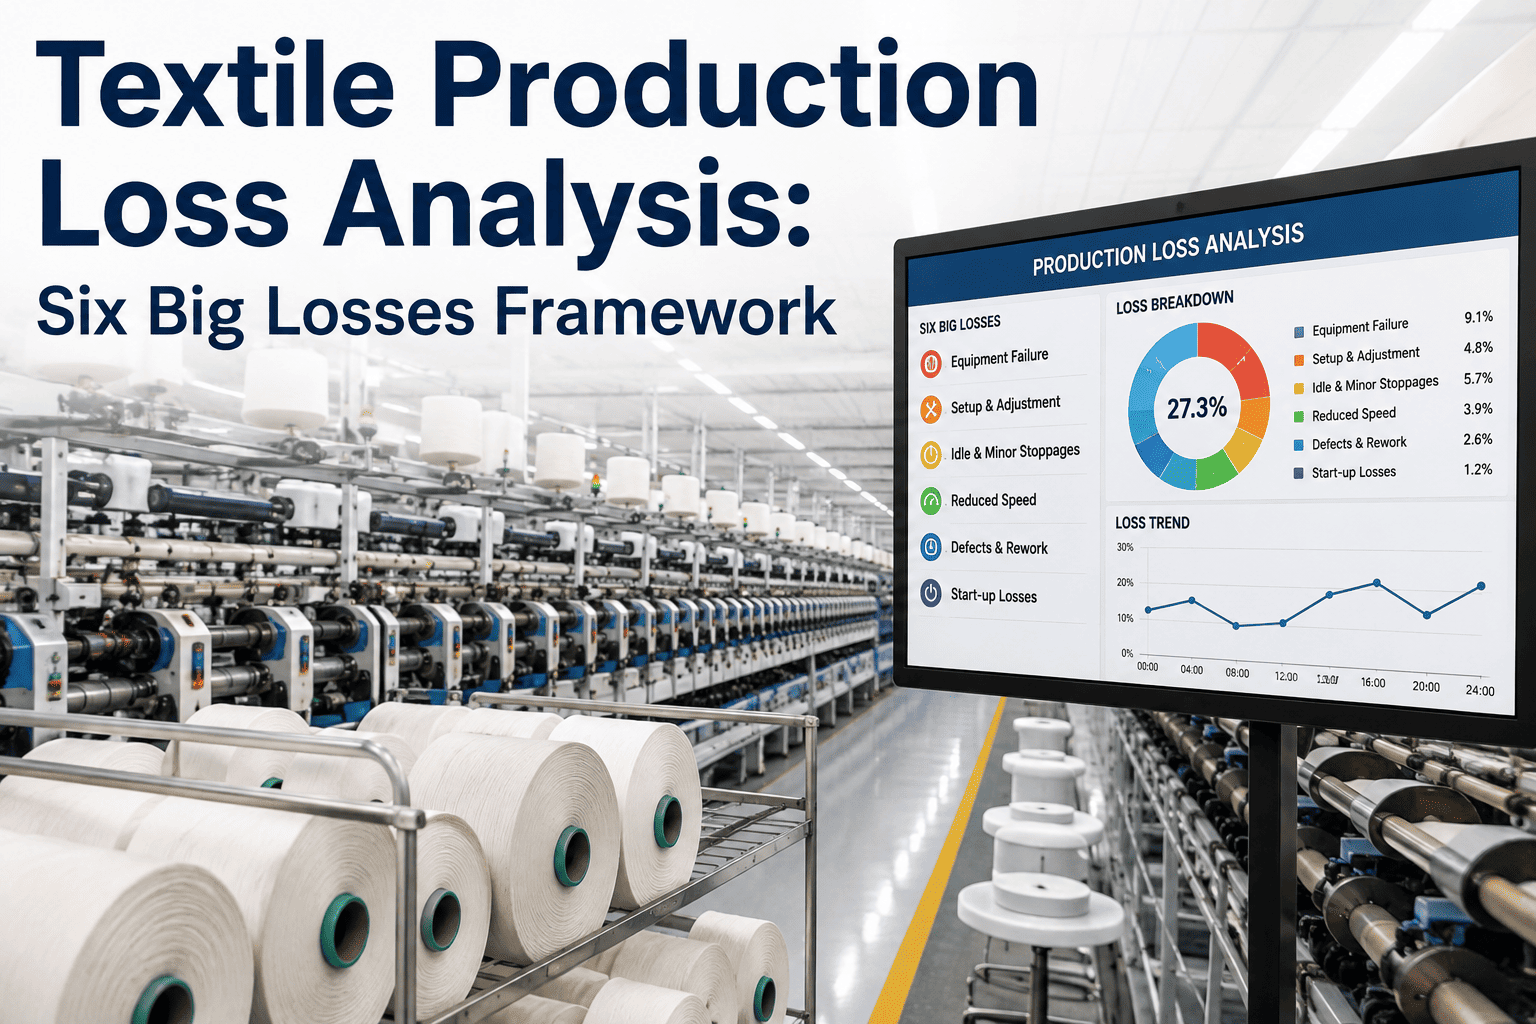
The Six Big Losses framework, developed inside Total Productive Maintenance, sorts every minute of lost textile production into six precise categories. Most mills without automated monitoring reliably capture equipment failure and setup time — and miss the other four almost entirely.
60-65%
Typical OEE for weaving and knitting mills without structured loss tracking
4 of 6
Loss categories most mills cannot reliably capture without automated monitoring
15-20%
Of total production time micro-stops alone can consume on high-speed looms
The Framework
Six Categories, Three OEE Factors, One Complete Picture
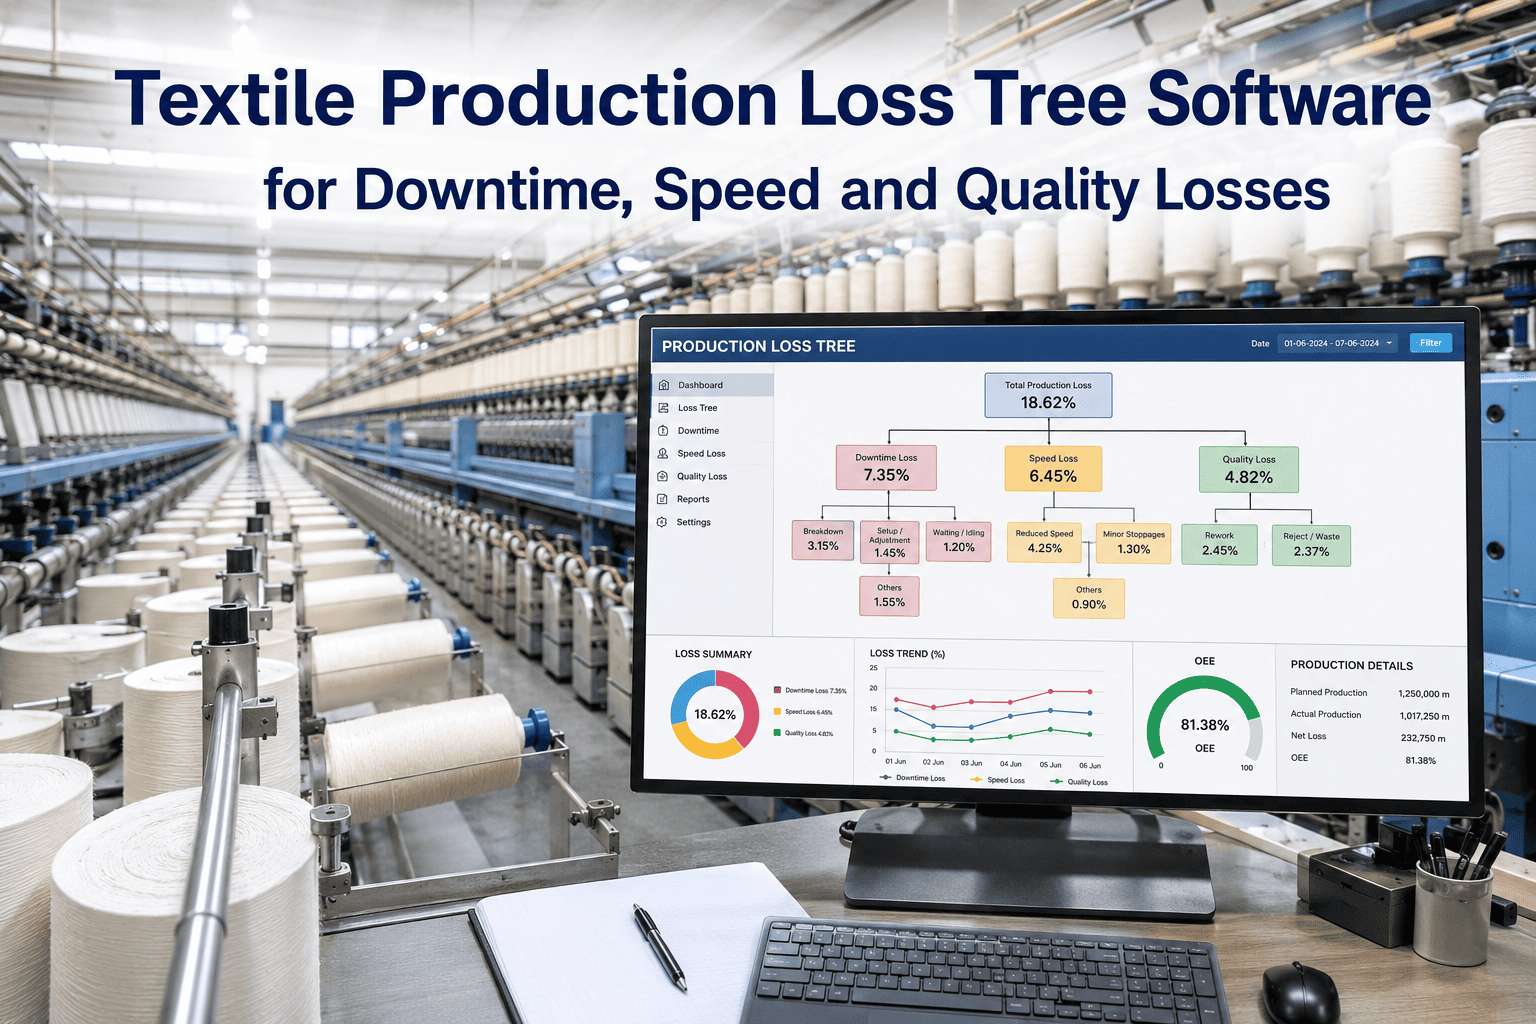
Every minute a textile machine is scheduled to run but is not producing good fabric at full speed falls into exactly one of six categories. Two reduce Availability, two reduce Performance, and two reduce Quality — and OEE is simply the product of all three factors multiplied together. Understanding which bucket a given minute of lost time belongs to is what separates a mill that can prioritize its next capital or process investment from one that is guessing.
Availability
L1 — Equipment Failure
L2 — Setup & Changeover
Performance
L3 — Minor Stops
L4 — Reduced Speed
Quality
L5 — Process Defects
L6 — Startup Rejects
L1 — Availability Loss
Equipment Failure: The Loss Everyone Already Tracks
Equipment failure is the most visible loss because it stops the machine completely and someone has to be called. In textile mills, the highest-consequence failures are rarely the loom itself — they are the shared systems a whole shed depends on simultaneously.
Air Compressor Faults
In mills running air-jet looms, the compressor is a single point of failure. One compressor fault can take down every air-jet loom on the floor at once, making it one of the highest-criticality assets in the entire facility — a maintenance priority that often outranks any individual loom.
Humidification System Failures
Textile production requires precise humidity control to prevent yarn breakage and electrostatic buildup. A humidification failure does not announce itself immediately — it degrades yarn handling across the entire spinning or weaving floor within hours of onset, often surfacing first as a spike in unrelated-looking minor stops rather than an obvious equipment alarm.
Reed Blockages & Cam Wear
On air-jet and rapier looms, reed blockages, worn cams, and weft feeder faults consistently top the fault-frequency list. These are timing-dependent electro-mechanical systems where a small tolerance drift cascades into a full stop — and the same wear that eventually causes a stop often produces a speed loss in the weeks beforehand.
L2 — Availability Loss
Setup & Changeover: The Beam-Change Problem Nobody Times Properly
Setup loss covers any planned stop for a changeover, style adjustment, or beam replacement. In weaving specifically, beam changes involve knotting and gaiting — a manual, skill-dependent process that is one of the most significant and most under-measured sources of changeover loss in the entire mill, often exceeding the time budgeted for it by a wide margin once actual recovery time is accounted for.
1
Beam Replacement
The depleted warp beam is physically removed and the new beam positioned and aligned to tolerance.
2
Knotting & Gaiting
Thousands of individual warp ends are joined from the old beam to the new — manual, precision work that varies enormously by operator skill.
3
Tension Recalibration
Yarn tension settings are re-established for the new beam and style before the loom can safely run at production speed.
4
Trial Picks & Verification
A short run confirms weave quality before the loom is released to full-speed production — the point where hidden setup problems finally surface.
Most mills record the nominal changeover time rather than the actual elapsed time including recovery from a bad knot or a tension miscalibration — which means the reported L2 loss is almost always smaller than the real one. A mill that believes its average beam change takes ninety minutes often discovers, once actual elapsed time is measured automatically, that the true figure including recovery time is closer to two hours.
See Your Own Beam-Change and Stop-Code Data Broken Down
iFactory captures loom-level stop codes and changeover duration automatically from your PLC data — no manual stop-code entry, no underreported changeover times.
L3 — Performance Loss
Minor Stops: The Loss That Never Makes It Onto a Clipboard
Minor stops are the single hardest loss category to capture manually, and in textile mills they are dominated by two mechanisms that individually look trivial and collectively consume enormous throughput.
Warp & Weft Breaks
The most frequent and most visible stop type on a weaving floor, directly tied to yarn quality and tension settings. Each break stops the loom, requires manual re-threading, and restarts the cycle — individually seconds to minutes, cumulatively hours per shift across a full floor. Yarn quality upstream in spinning has a direct, measurable effect on how often this happens downstream in weaving.
Lint Accumulation
Weaving spun yarns at high speed generates significant lint, which accumulates on optical weft-stop sensors and in the reed. A blinded sensor cannot detect a broken yarn — producing both a stop and, worse, a fabric defect that continues until someone notices. Cleaning schedule discipline is one of the highest-leverage, lowest-cost interventions available against this loss category.
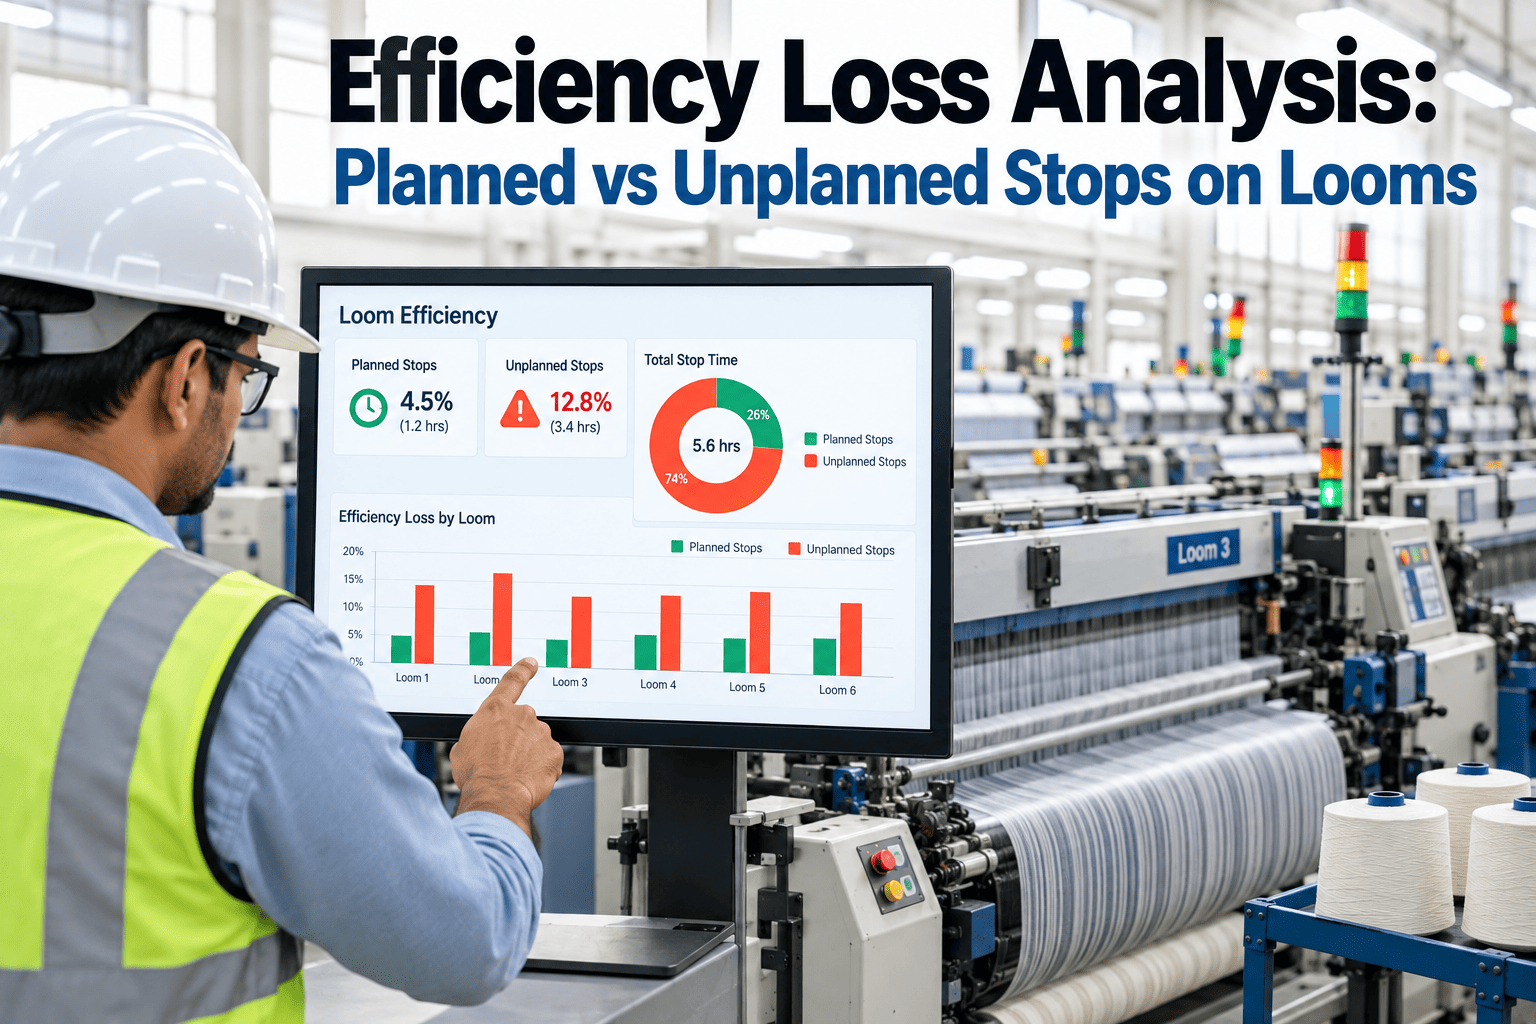
A loom stop under roughly ten minutes rarely gets a documented reason code on paper-based systems, which is exactly why minor stops can represent 15-20% of total production time on high-speed lines while showing up as almost nothing on a manual downtime report. The gap between what a mill believes its minor-stop rate is and what it actually is tends to be one of the largest surprises in any first-time loss analysis.
L4 — Performance Loss
Reduced Speed: Running Slower Than the Loom Was Ever Meant To
Speed loss is the gap between an asset's rated cycle time and what it actually achieves in production. It is the quietest of the six losses because the machine never stops — it just runs consistently below potential, and nobody flags a machine that is technically producing.
Worn Insertion Components
Mechanical wear on weft insertion components does not usually cause an immediate stop — it causes the operator or the control system to run the loom more conservatively to avoid triggering one. The loom keeps producing fabric, just at a quietly reduced rate that rarely gets questioned until someone compares it directly against a sister machine.
Operator Caution on Aged Assets
Technicians who have experienced repeated breaks or jams on a specific loom often deliberately run it below rated speed — a reasonable individual decision that becomes a significant fleet-wide loss when it happens quietly across dozens of machines without anyone tracking the cumulative effect.
Suboptimal Process Parameters
Tension, humidity, and timing settings drift from their optimal configuration over time without triggering any alarm, gradually pulling actual cycle time away from the rated ideal — a slow drift that a monthly or quarterly manual review is almost never frequent enough to catch early.
Quality Losses
L5 and L6: When the Loom Never Stopped But the Fabric Still Failed
Quality losses are the most expensive category per incident, because the machine, the labor, and the raw material were all consumed producing fabric that cannot be sold at full value.
L5 — Process Defects
In-process fabric defects — inconsistent weave density, tension banding, contamination from lint or foreign fiber — that occur during otherwise normal, steady-state running. These are typically caught by inspection machines and linked back to a specific loom or spinning frame for root cause analysis, but only if that link is actually being made systematically rather than assumed. A defect roll traced back to the wrong machine sends a maintenance investigation in exactly the wrong direction.
L6 — Startup Rejects
Fabric produced during the trial-pick and ramp-up phase immediately following a changeover, before tension, timing, and speed have fully stabilized. Every beam change carries a startup reject cost — the only variable is how quickly the mill can detect stabilization and stop discarding good fabric unnecessarily, or catch bad fabric before it accumulates into a full roll that has to be scrapped or downgraded.
Why Four of Six Go Unseen
Manual Tracking Reliably Catches Two Losses. Automated Monitoring Catches Six.
The pattern holds across almost every textile mill without sensor-based monitoring: equipment failure and setup time get logged because they are large, discrete, and someone has to physically respond. The other four losses are systematically underreported for a structural reason, not a discipline problem.
L1 Equipment Failure
Reliably Captured on Paper
L2 Setup & Changeover
Reliably Captured
L3 Minor Stops
Systematically Underreported
L4 Reduced Speed
Systematically Underreported
L5 Process Defects
Systematically Underreported
L6 Startup Rejects
Systematically Underreported
A ten-second warp break does not get a paper reason code. A loom running 6% below rated speed does not trip an alarm. A defect caught three meters into a roll does not always get traced back to the exact minute it started. None of these are attention failures — they are the natural limit of what a clipboard-and-whiteboard system can capture at production speed, and no amount of additional supervisor diligence closes that gap on its own.
Prioritization
Which Loss to Attack First: Frequency, Severity, and What Actually Moves OEE
Once a mill has visibility into all six loss categories, the temptation is to attack whichever one produces the biggest single number on a report. That is not always the right target — the correct priority depends on which OEE factor is currently the weakest, and on whether a loss is high-frequency-low-severity or the reverse.
If Availability Is the Weak Factor
Focus first on L1 and L2. A single air compressor failure or humidification fault can take down an entire shed at once, and beam-change duration is one of the more controllable losses through better knotting technique, standardized sequencing, and pre-staged beams.
If Performance Is the Weak Factor
Focus on L3 and L4 together — they are often more connected than they appear, since operators who experience frequent minor stops on a specific loom will often deliberately slow it down, converting a stop problem into a speed problem that persists even after the immediate stop cause is fixed.
If Quality Is the Weak Factor
Focus on tracing L5 defects back to their originating machine and shift before attacking L6, since startup reject rates are often a downstream symptom of the same tension and calibration issues driving in-process defects during steady-state running.
In practice, most mills discover that L3 and L4 — the two categories manual systems miss most completely — are also the two with the fastest payback once visibility exists, precisely because nobody has ever systematically attacked them before. A loss that has never been measured has, by definition, never been targeted for improvement.
What This Looks Like Applied
The 200-Loom Mill That Found 40% of Its Downtime on One Machine Model
A weaving mill operating 200 looms was struggling with frequent breakdowns and missed delivery deadlines, and the maintenance team's working assumption was that failures were roughly evenly distributed across the fleet. Modeling the full production process against actual stop-code and loss data told a different story entirely, and it changed where the mill directed its next maintenance budget cycle.
40%
Of total downtime traced to a single loom model with a known mechanical issue
15%
Of idle time caused by yarn shortages, invisible until material flow was mapped
62% → 82%
OEE improvement within six months of loss-driven maintenance targeting
78% → 93%
On-time delivery improvement over the same period
None of this required new looms. It required knowing which loss category was actually driving the OEE gap, on which specific machines, before deciding where to spend maintenance and process-improvement effort — the same diagnostic discipline the Six Big Losses framework is designed to provide at any scale, from a single line to a full multi-shed operation.
Common Mistakes
Where Textile Loss Analysis Goes Wrong
01
Treating every loom stop as equipment failure.
A yarn break stopped and cleared in ninety seconds is a minor stop, not an equipment failure — but on a paper log both can look identical, inflating L1 and hiding the real scale of L3. This distorts maintenance priorities toward mechanical repairs when the real opportunity is in process and yarn-quality improvement.
02
Recording nominal changeover time instead of actual elapsed time.
A beam change that runs long because of a knotting error or a tension recalibration issue gets logged at the standard time anyway, quietly understating L2 and hiding a real, fixable process problem that would otherwise justify operator training or a beam-staging process change.
03
Assuming a running loom is a fully productive loom.
Speed loss is invisible on a simple uptime report. A loom that never stops but runs 8% below its rated cycle time all shift can lose more throughput than several short breakdowns combined, and it will never appear on a downtime log because, technically, it never went down.
04
Disconnecting fabric inspection data from the machine that produced it.
Defects caught at final inspection are only useful for root cause analysis if they are traced back to the specific loom, shift, and time window that produced them — a link most paper-based inspection processes never actually make.
Common Questions
Six Big Losses in Textile Production — Frequently Asked Questions
Which of the Six Big Losses typically costs a textile mill the most?
It varies by mill, but minor stops and reduced speed together consistently account for more total lost production time than equipment failure in most weaving and knitting operations, even though equipment failure is the loss most maintenance teams focus on first. Warp and weft breaks alone are usually the single most frequent stop type on a weaving floor, and because each individual stop is short, the cumulative cost is easy to underestimate without stop-code-level data. A mill that has never measured this distribution should expect the actual ranking to surprise them, since intuition tends to overweight dramatic, visible breakdowns relative to their true share of total lost time.
Book a demo to see which loss category is actually largest on your own floor.
Why is minor stop data so hard to capture manually in a weaving or knitting shed?
A yarn break or lint-triggered stop often lasts under a minute and gets cleared by the operator without ever generating a documented reason code, since a paper or whiteboard system realistically cannot capture every stop at production speed across dozens of machines simultaneously. This is a structural limitation of manual tracking, not a discipline problem — automated PLC-level monitoring captures every stop event with its exact duration and timestamp regardless of how brief it is.
iFactory captures this automatically from existing loom and knitting machine PLC data.
How does the Six Big Losses framework apply differently to spinning versus weaving operations?
Spinning machines — ring frames, open-end rotors, draw frames — fail through different predictable mechanisms than looms, but the same six-category structure applies: equipment failure and changeover time reduce Availability, end-breaks and speed reduction reduce Performance, and yarn quality defects and startup waste reduce Quality. The specific failure modes differ by process — a ring frame's traveler wear bears little resemblance to a loom's reed blockage — but the diagnostic framework and the underlying measurement challenge, manual systems missing the majority of short stops, are consistent across spinning, weaving, knitting, and dyeing operations alike. A mill running multiple process types benefits from applying the same taxonomy everywhere, since it allows loss data to be compared across departments on equal terms rather than each area inventing its own informal categories.
Can humidity and climate control really cause losses across an entire weaving floor at once?
Yes — textile production depends on precise humidity control, typically in the 65-75% relative humidity range, to prevent yarn breakage and electrostatic buildup during high-speed weaving. A humidification system failure does not usually cause an immediate, obvious stop; instead it degrades yarn handling gradually across every loom on the floor over several hours, which makes it one of the more insidious equipment-related losses because the root cause is easy to miss when investigating individual machine stops one at a time rather than looking for a floor-wide pattern across multiple looms simultaneously.
What is the fastest first step for a mill that has never formally tracked the Six Big Losses before?
Start by instrumenting stop-code capture at the PLC level on a representative subset of machines rather than attempting a facility-wide rollout immediately — even two to four weeks of accurate, automated stop-code and cycle-time data on a handful of looms or knitting machines is usually enough to reveal which loss category is actually dominant, since the distribution rarely matches what supervisors assume from memory. Expanding from that initial subset to the full fleet is typically a matter of replicating a proven data pipeline rather than solving a new problem each time.
Book a demo to see how quickly this data becomes actionable on your own floor.
Find Out Which Loss Category Is Actually Costing You the Most
iFactory captures all six loss categories automatically from your existing PLC and SCADA data — no manual stop-code entry, no underreported changeover times, no guessing which loom is the real problem.