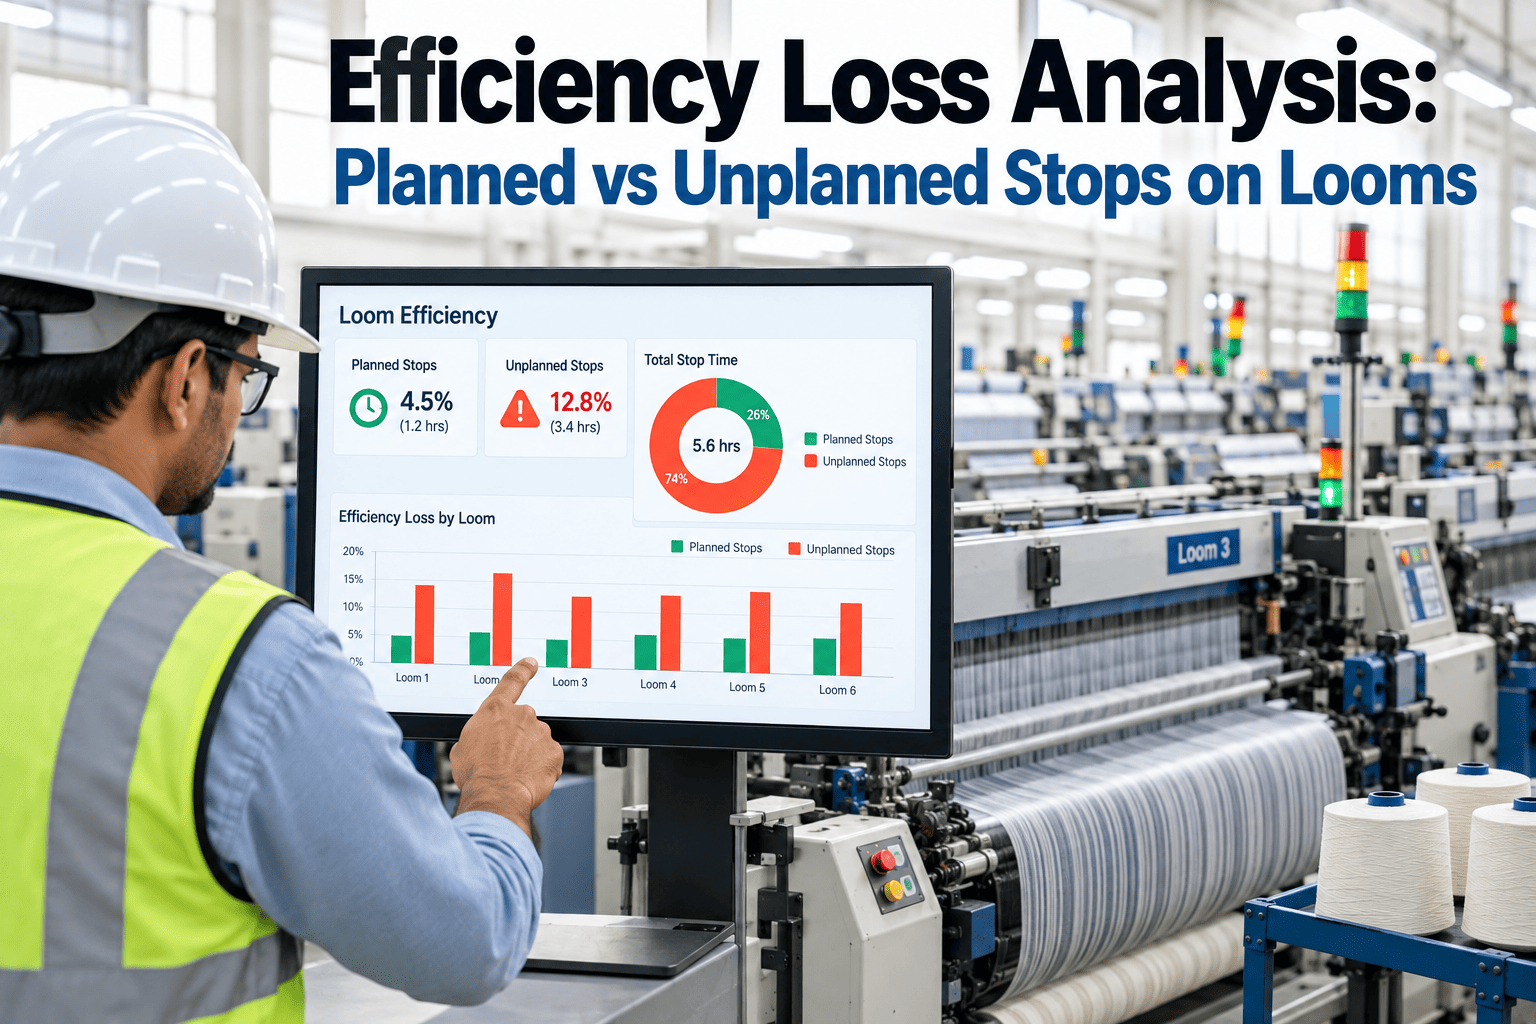
A loom running at 78% efficiency looks like a single number on a shift report, but that missing 22% is actually a dozen different causes tangled together, and most weaving mills never separate them cleanly enough to know where to focus. A warp change scheduled into the shift plan and a weft break that stops the machine unpredictably both show up as "downtime" on a basic efficiency report, yet they demand completely different fixes. This blending of fundamentally different problems into a single number is why so many efficiency improvement projects in weaving mills produce disappointing results despite real effort and real investment. One is a scheduling and changeover speed problem; the other is a material, tension, or mechanical reliability problem. Mills that lump every stop into a single efficiency percentage end up chasing the wrong improvement projects, investing in faster changeover procedures when the real loss is coming from unplanned breakage, or vice versa. Separating planned stops from unplanned stops, and then breaking each category down further, is the single most useful diagnostic step a weaving operation can take before spending money on any improvement initiative. If you want help breaking down your own efficiency loss by stop category, you can book a demo with iFactory's team.
Separate Planned Stops From Unplanned Stops Before You Chase Efficiency Gains
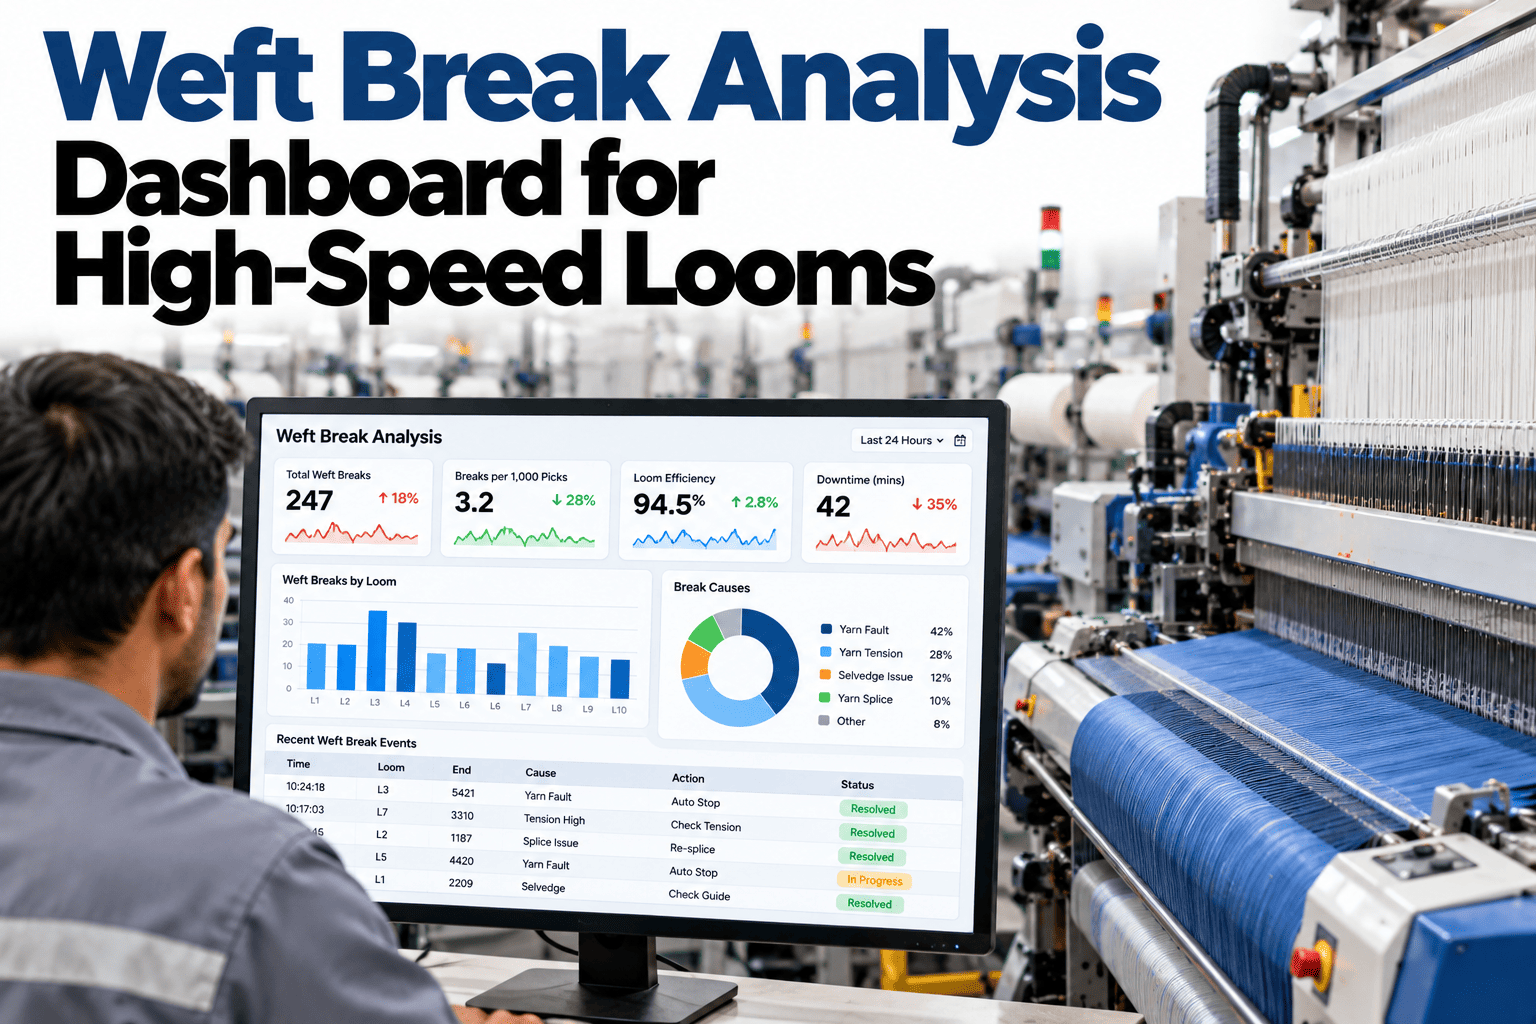
iFactory tracks every loom stop automatically, classifying planned changeovers separately from unplanned breakage and mechanical faults so improvement effort goes where the real loss actually is.
Why Planned and Unplanned Stops Need Completely Different Fixes
Planned stops are scheduled interruptions built into how a loom runs a given order: warp changes, fabric or pattern changes, routine maintenance windows, and shift changeovers. These stops are predictable and their duration can be improved through better procedures, tooling, and operator training. Unplanned stops are the opposite: weft breaks, warp breaks, mechanical faults, and quality-triggered stops that happen unpredictably and interrupt production without warning. Treating both categories as a single "downtime" figure hides which one is actually driving your efficiency gap, and the improvement projects that fix one category rarely move the needle on the other, which is exactly why a mill can invest heavily in changeover training and see almost no efficiency improvement if the real loss was coming from breakage all along.
The distinction also matters for how each category should be staffed and owned within the organization. Planned stop improvement is fundamentally a process engineering and training problem, best owned by production supervisors focused on standardized work and scheduling discipline. Unplanned stop reduction is fundamentally a materials, tension, and maintenance reliability problem, best owned by quality and maintenance teams working together on root cause investigation. Assigning both categories to the same improvement team without this distinction often results in effort spread too thin across problems that require entirely different skill sets to solve well.
Where Efficiency Actually Goes on a Representative Weaving Shift
The chart below reflects the typical breakdown of lost time on a loom running below its rated efficiency, aggregated from mills that implemented detailed stop tracking after previously relying only on a single blended efficiency number.
What Recurring Unplanned Stops Are Usually Telling You
Unplanned stops are rarely random even though they feel that way on the floor. A pattern of repeated stops, once tracked precisely by cause, time of day, and loom, usually points to a specific, addressable root cause rather than general bad luck. The challenge is that this pattern is nearly invisible in a manually logged system, where operators are focused on restarting the machine quickly rather than recording the fine-grained detail needed to spot a cluster, and it is precisely this granularity that automated classification is designed to capture without adding work to an already busy shift.
Weft Breaks Clustering by Shift
If breakage rates spike during a specific shift, the cause is often operator technique, humidity variation, or a specific yarn lot running during that window rather than a machine issue.
Warp Breaks Clustering by Position
Breaks concentrated at specific positions across the warp beam typically point to tension variation across the beam or a heddle or reed wear issue localized to that zone.
Mechanical Faults on Specific Machines
Faults repeating on the same loom rather than spread across the fleet indicate a maintenance issue specific to that machine rather than a process-wide problem.
Quality Stops Tied to a Fabric Style
Quality-triggered stops concentrated on a particular fabric construction often reveal a setup parameter that needs adjustment for that specific style rather than a general defect trend.
Where Changeover Time Actually Goes and How to Compress It
Planned stop duration is often assumed to be fixed, but detailed timing usually reveals significant variation between operators and shifts performing the same changeover, meaning there is real room for improvement without new equipment.
| Changeover Step | Typical Time Range | Where the Variation Comes From |
|---|---|---|
| Warp beam removal and mounting | 12-25 minutes | Tooling availability, beam handling equipment, operator experience |
| Retying or drawing-in | 30-90 minutes | Manual vs automated drawing-in, pattern complexity, thread count |
| Loom parameter reset | 5-15 minutes | Whether settings are stored digitally or re-entered manually each time |
| First-piece quality verification | 8-20 minutes | Inspection thoroughness and whether adjustments are needed after startup |
Impact of Detailed Stop Classification on Weaving Efficiency
The figures below reflect aggregated outcomes from weaving operations that moved from a single blended efficiency metric to detailed stop cause classification and targeted improvement.