Comparing loom efficiency across a mill's entire fleet with a single blended target is one of the most common and most misleading practices in weaving operations. A loom running a simple plain weave at 88% efficiency and a loom running a complex jacquard pattern at 71% efficiency might both be performing exactly at their achievable ceiling for that fabric type, yet a flat plant-wide target of 85% would flag one as excellent and the other as a problem needing intervention. This single-target approach quietly rewards mediocre performance on simple fabrics while punishing genuinely strong performance on complex ones, distorting both the improvement priorities and the performance conversations happening between supervisors and operators. Real benchmarking requires setting a realistic performance target for each fabric category based on its actual achievable ceiling, then measuring the gap between current and target performance within that category. If you want help establishing fabric-specific benchmarks for your own fleet, you can book a demo with iFactory's team.
Stop Comparing Every Loom Against the Same Flat Efficiency Target
iFactory benchmarks each loom against a realistic target specific to the fabric it is actually weaving, so improvement effort goes toward genuine underperformance instead of an unfair comparison.
What Actually Drives the Achievable Efficiency Ceiling for a Given Fabric
Every fabric construction imposes constraints on how fast and how reliably a loom can run it, independent of how well maintained the machine is or how skilled the operator is. Understanding these constraints is the foundation of a fair benchmark. Ignoring them and applying a single target across the whole fleet is the single most common reason a weaving mill's improvement program loses credibility with the floor, since operators quickly recognize when a target is mathematically unachievable for the fabric they are running and stop taking the benchmark seriously altogether. Fabric complexity, thread density, yarn type, and pattern repeat each contribute independently to the achievable ceiling, and a fabric that scores poorly on one factor but well on another can still land in a different benchmark category than a naive assessment of "complex versus simple" would suggest.
Pattern Complexity
Jacquard and complex dobby patterns require more frequent shed changes and heddle movement, inherently increasing stress on components and stop frequency compared to plain weave.
Thread Density
Higher pick density fabrics require more insertions per unit of fabric produced, increasing the statistical opportunity for a breakage event during any given production run.
Yarn Type and Quality
Delicate or lower-quality yarns are inherently more prone to breakage under tension than robust, high-quality yarns, regardless of how well the loom itself is tuned.
Fabric Width and Loom Speed
Wider looms and higher rated speeds increase the mechanical stress on components per unit time, changing the baseline stop frequency even for an identical fabric construction.
Representative Efficiency Targets Across Common Fabric Categories
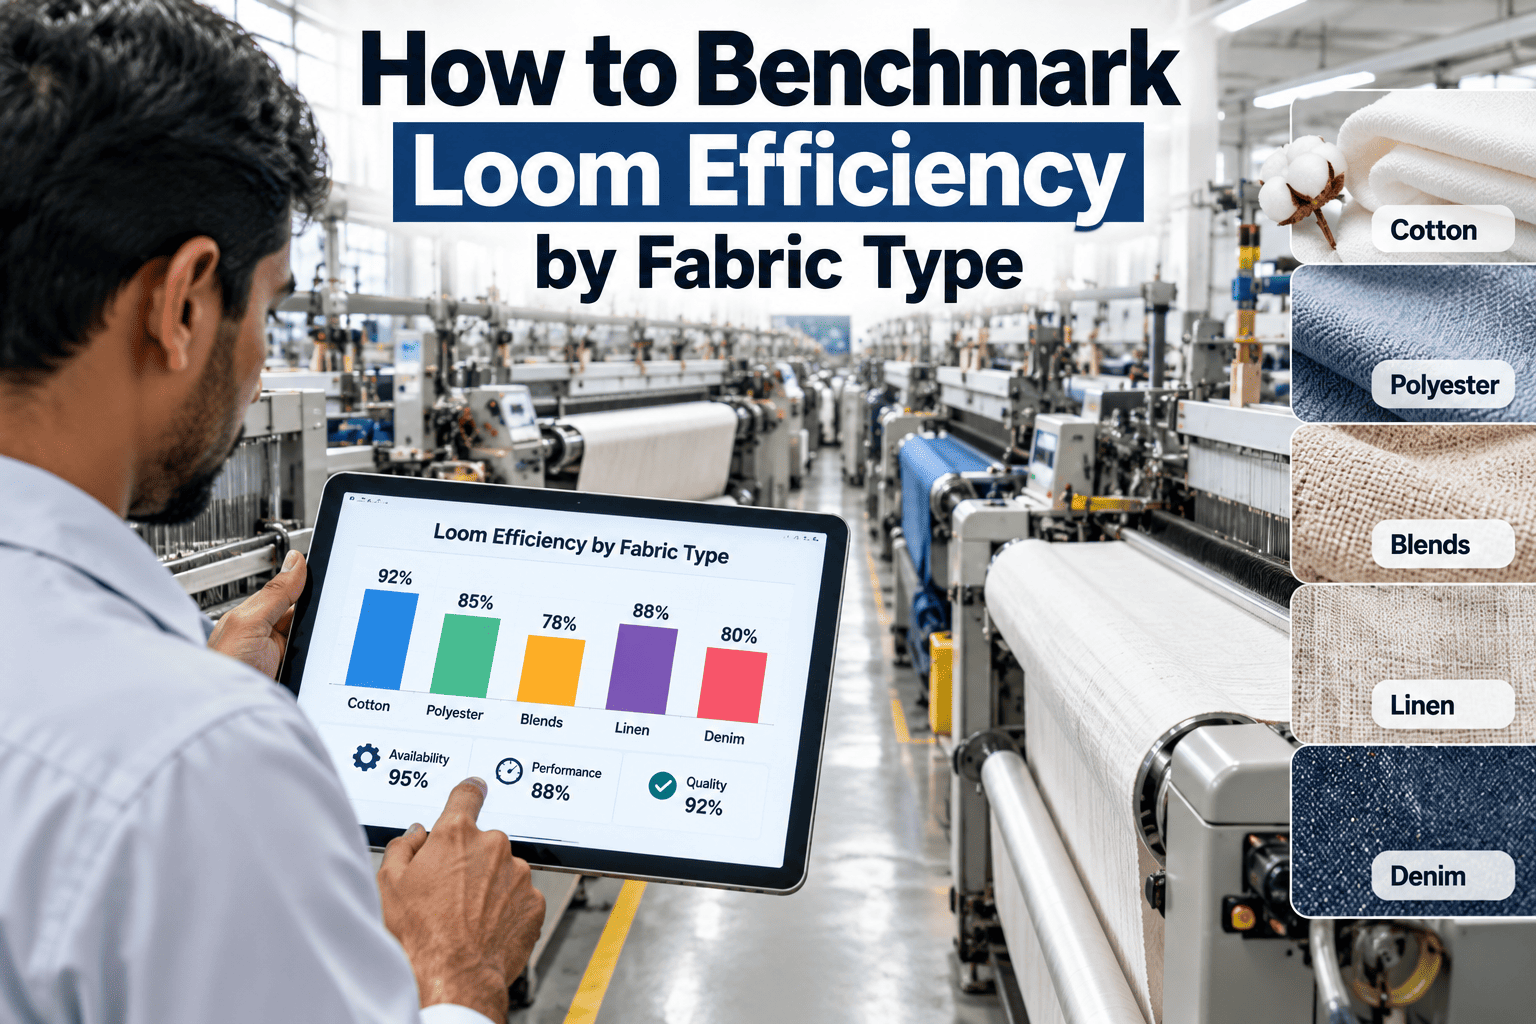
The gauges below show representative achievable efficiency ranges for common fabric categories, compiled from aggregated performance data across multiple weaving operations running well-maintained equipment. Use these as a starting reference point, not an absolute standard, since your specific yarn quality and loom condition will shift the achievable ceiling somewhat. Notice that the gap between categories is not small: the difference between a well-run plain weave loom and a well-run jacquard loom can easily exceed twenty percentage points, which is precisely the gap a flat plant-wide target would misrepresent as a performance problem rather than an inherent characteristic of the fabric being produced.
Turning a Benchmark Gap Into a Specific, Actionable Improvement Plan
A benchmark is only useful if it leads to action. Once a loom's actual efficiency is compared against its fabric-specific target, the size and nature of the gap points toward a different type of investigation depending on how far off target the loom is running. Treating every gap the same way, whether it is two points or twenty, wastes investigation time on minor variance while sometimes under-reacting to a genuinely serious problem, which is why the tiered response below scales the depth of investigation to the size of the gap observed.
How to Establish Fabric-Specific Targets Using Your Own Historical Data
Generic industry benchmarks are a reasonable starting point, but the most accurate targets come from your own fleet's historical performance on each fabric category, since your specific yarn suppliers, loom age, and maintenance practices all shift the realistic ceiling somewhat from a generic industry number. Building this internally also creates a benchmark the floor teams trust more readily, since it is demonstrably grounded in what their own equipment has already proven achievable rather than a number imported from an industry publication with no visibility into your specific conditions.
Segment Historical Data by Fabric Category
Pull efficiency data for every loom run over a representative period and group it by fabric construction type rather than treating the fleet as one dataset.
Identify Your Top-Performing Looms per Category
Within each fabric category, identify which looms consistently achieve the highest sustained efficiency to establish a realistic, proven ceiling.
Set the Target Slightly Above Current Best
Use the top performers as the benchmark target rather than an industry average, since your own equipment and materials have already demonstrated this is achievable.
Revisit Targets Periodically
Update benchmarks as equipment ages, yarn suppliers change, or new fabric categories are introduced to keep targets realistic over time.