Ask a weaving shed manager what their loom efficiency is and most will give a number confidently — usually somewhere between 80% and 92% — but ask how that number was calculated and the confidence often drops fast. Efficiency gets calculated differently machine to machine, shift to shift, and mill to mill, which means the number on the report and the number on the floor frequently don't agree, and neither one reliably tells you where the lost production actually went. Getting the calculation right, and benchmarking it against realistic industry figures for your loom type, is the first step to actually improving it. If your efficiency numbers don't match what production feels like on the floor, book a demo with our team and we'll walk through where the gap is coming from.
Textile Manufacturing · Weaving Production
How to Calculate Loom Efficiency (And Why Your Number Might Be Wrong)
Picks per minute, meters produced per day, and efficiency percentage should all agree with each other. When they don't, the calculation method — not the loom — is usually the problem. Here's how to benchmark efficiency correctly across rapier, air-jet, and other loom types.
78-92%
Typical efficiency range, modern looms
5-8%
Common gap between reported and actual
3
Loss categories that explain most downtime
The Formula Everyone Knows, Applied Inconsistently
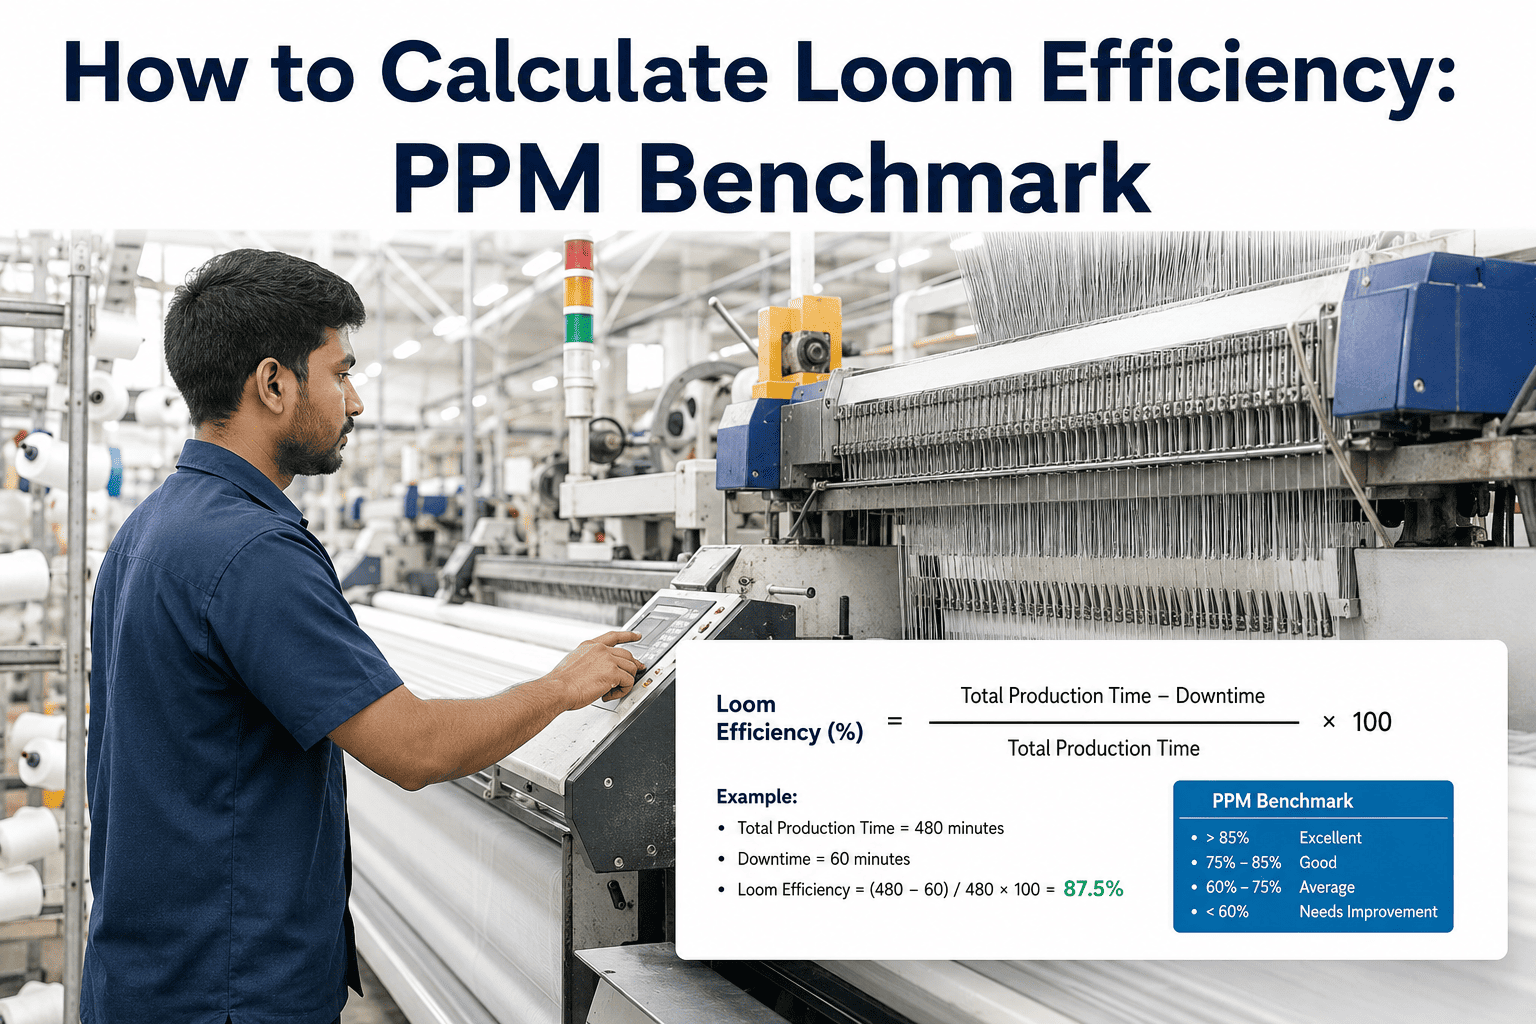
Loom efficiency is calculated as actual production divided by theoretical maximum production over the same period, expressed as a percentage. The formula itself is simple — the inconsistency comes from how mills define "theoretical maximum," and small differences in that definition produce meaningfully different efficiency percentages for identical actual output.
Benchmarking by Loom Type
Rapier, air-jet, and other loom technologies have meaningfully different efficiency benchmarks because their stoppage patterns and speed capabilities differ structurally, not just incrementally. Comparing an air-jet loom's efficiency against a rapier benchmark, or vice versa, produces a misleading conclusion about relative performance.
Loom Type
Typical PPM Range
Typical Efficiency
Air-jet loom
800-1200
85-92%
Projectile loom
350-500
78-86%
Water-jet loom
700-1000
84-91%
Meters Per Day: Translating Efficiency Into a Number the Business Understands
Efficiency percentage matters to process engineers, but meters produced per day is the number that connects directly to delivery commitments and revenue, which is why translating between the two matters for communicating with anyone outside the weaving floor.
01
Rated Speed
Start with the loom's rated PPM for the specific fabric construction currently running.
→
02
Apply Efficiency
Multiply by actual measured efficiency percentage to get real achievable picks per minute.
→
03
Convert to Meters
Divide by picks per meter for the fabric to get realistic meters-per-day output for planning.
See Real-Time Efficiency Across Every Loom, Not End-of-Shift Averages
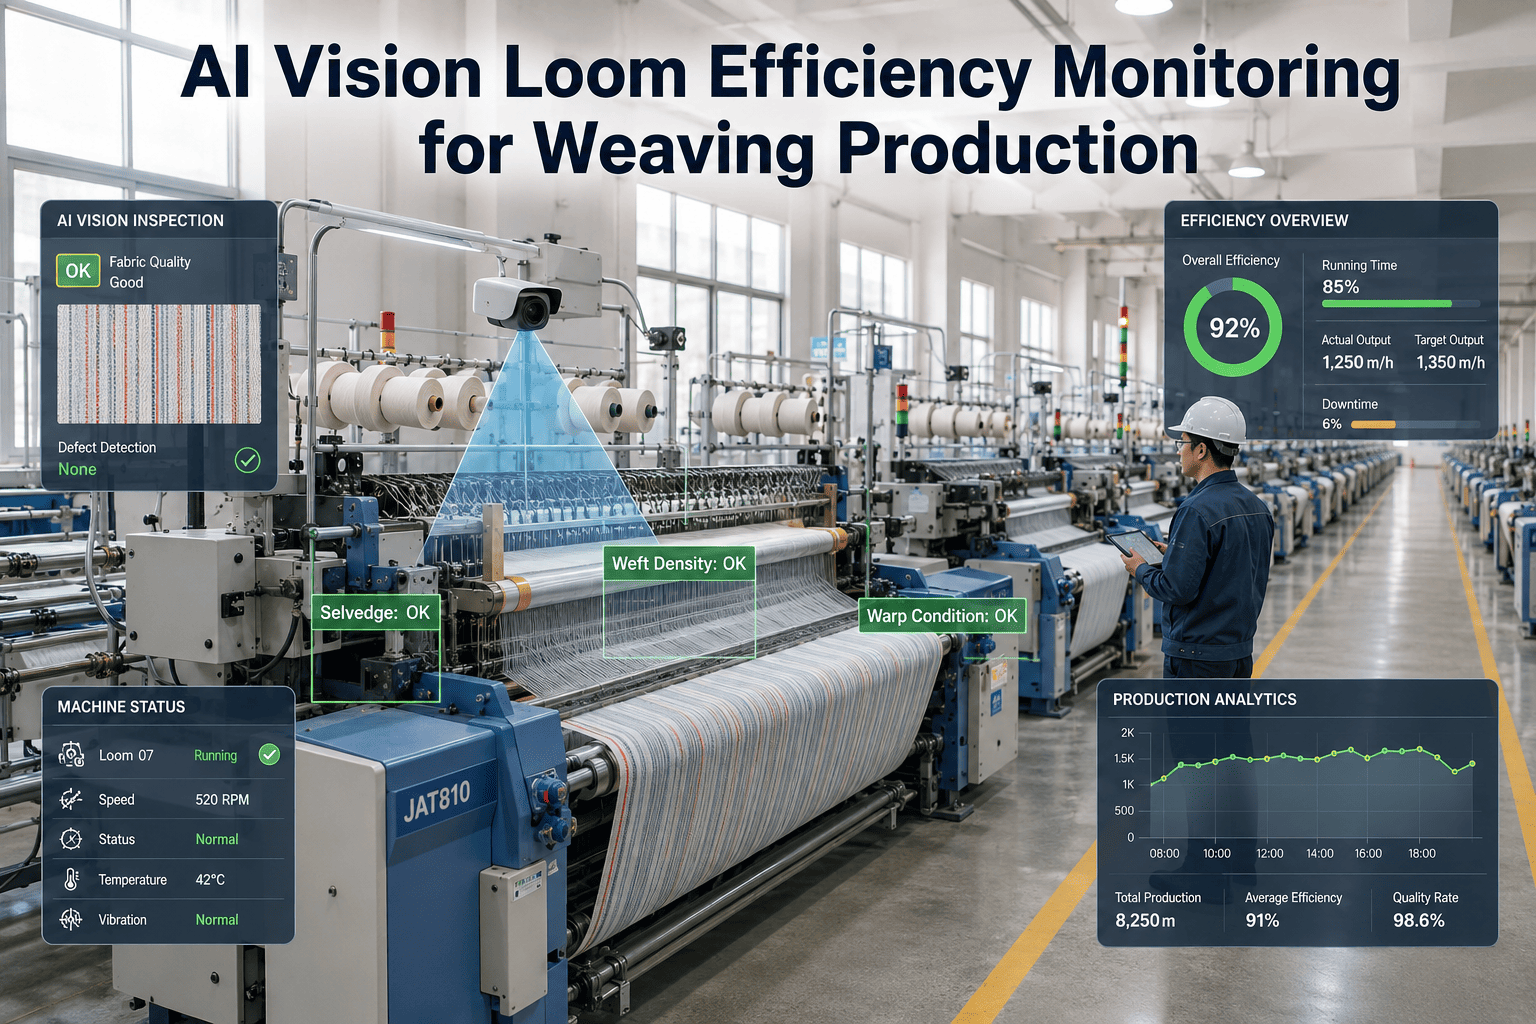
iFactory calculates loom efficiency continuously against each fabric construction's actual rated speed, so the number on your dashboard matches what's really happening on the floor.
Where the Lost Percentage Actually Goes
The gap between theoretical maximum and actual output breaks down into a small number of loss categories, and knowing the proportional breakdown for your own floor is far more useful than a single efficiency percentage, because each category needs a different fix.
Warp Stops
Breaks in the warp yarn requiring the loom to stop for repair and re-threading, often traced back to warp preparation quality rather than the loom itself.
Weft Stops
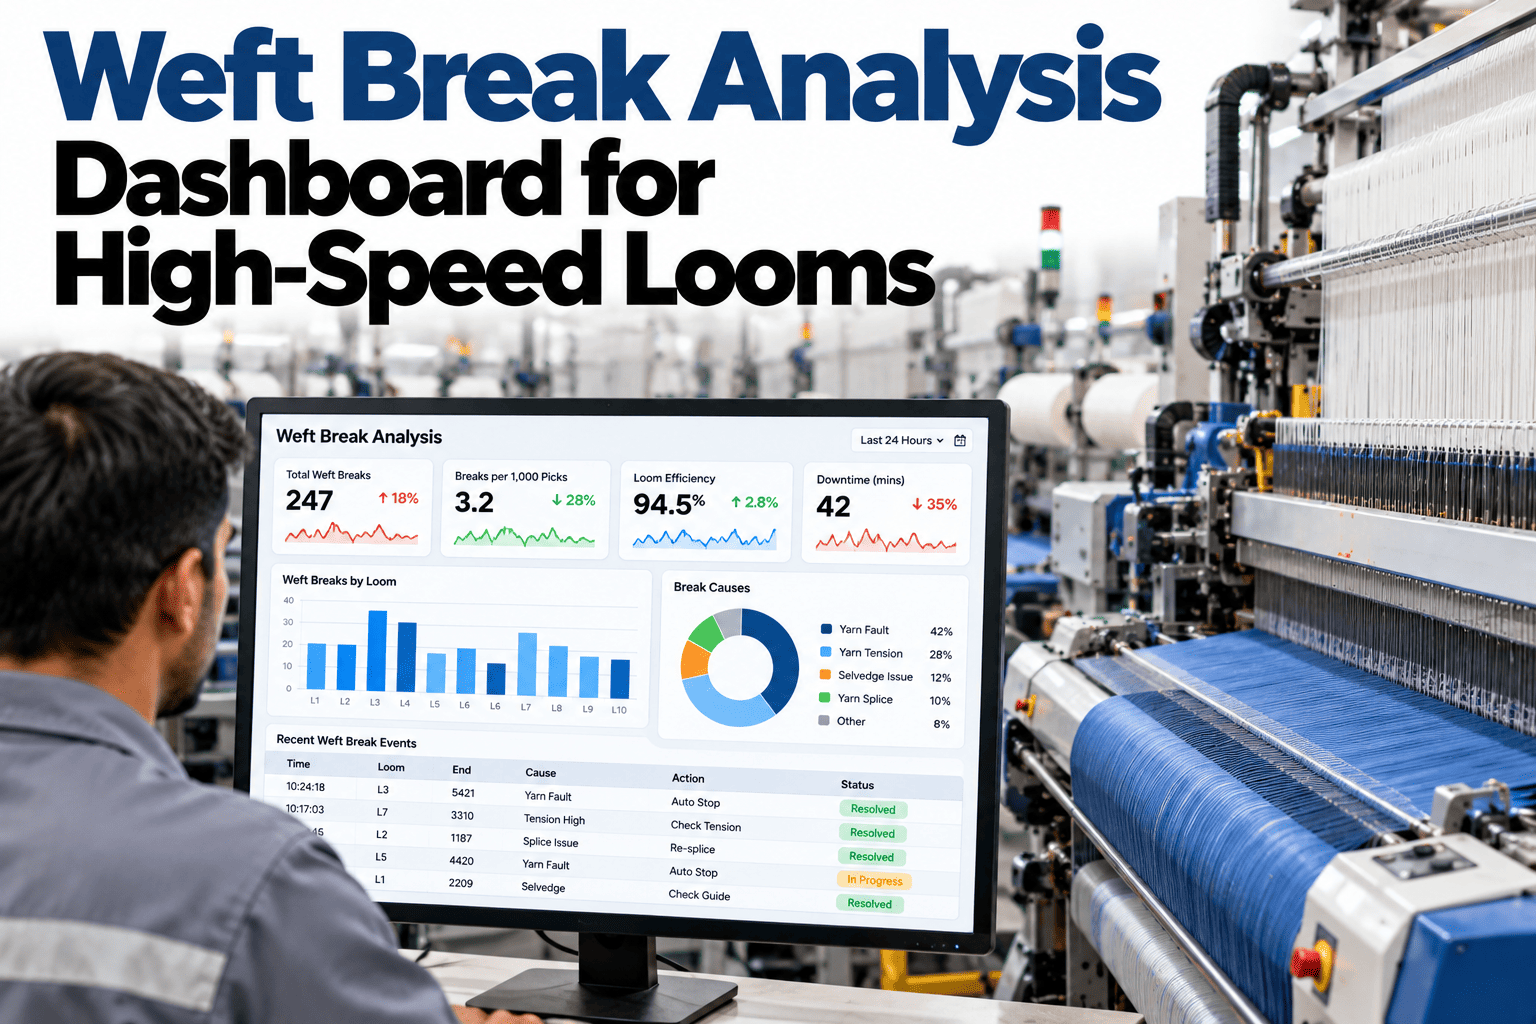
Filling yarn breaks or insertion failures, frequently tied to weft package quality, tension settings, or insertion system wear specific to the loom type.
Mechanical Stops
Loom-initiated stops for mechanical faults, sensor triggers, or scheduled maintenance windows that interrupt an otherwise running shift.
Style / Doff Changes
Planned downtime for beam changes, style changeovers, and quality checks that are necessary but should be tracked separately from unplanned loss.
A Practical Checklist for Cleaning Up Your Efficiency Reporting
Before chasing efficiency improvements on the floor, it's worth confirming the number you're chasing is actually being calculated consistently, since a reporting fix is faster and cheaper than a process fix, and sometimes the "efficiency problem" is really a measurement problem.
Check 1
Confirm theoretical maximum PPM is set per fabric construction, not a single blanket figure applied across every style running on the loom.
Check 2
Separate planned downtime (style changes, scheduled maintenance) from unplanned downtime in the reporting so efficiency reflects controllable loss.
Check 3
Verify the same calculation method and time period definition is used consistently across every loom and every shift for valid comparison.
Check 4
Cross-check reported efficiency against actual meters produced and delivered over a full week to catch calculation drift early.
Frequently Asked Questions
What is a good loom efficiency percentage to target?
Target efficiency depends heavily on loom type and fabric construction, but modern air-jet looms typically run 85% to 92%, rapier looms 82% to 90%, and projectile looms 78% to 86% under well-managed conditions. Rather than chasing a generic industry number, the more useful target is your own loom's realistic best-achieved efficiency on a given fabric construction, since that reflects what's genuinely achievable with your specific yarn quality and maintenance standards rather than an average pulled from different operating conditions.
Why does my reported efficiency not match what I see on the weaving floor?
This is almost always a calculation definition problem rather than a production problem — commonly, theoretical maximum PPM is set using a generic nameplate speed rather than the achievable rated speed for the specific fabric construction currently running, which inflates or deflates the calculated efficiency depending on how the current style compares to that generic baseline. Standardizing theoretical maximum per fabric construction, rather than per loom, is the most common fix.
Book a session with our team if you want help auditing your current calculation method.
Should planned downtime for style changes count against efficiency?
Most mills track two separate figures for exactly this reason — gross efficiency, which includes all downtime, and net or running efficiency, which excludes planned style changes and scheduled maintenance. Mixing the two into a single number makes it impossible to tell whether a low efficiency reading reflects genuine controllable production loss or simply a shift with more planned changeovers than usual, which is a scheduling factor rather than a performance issue.
How much does warp preparation quality actually affect loom efficiency?
Warp stops are consistently one of the largest single loss categories on most weaving floors, and warp preparation quality — sizing consistency, beam tension uniformity, and yarn quality going into warping — is the single biggest lever for reducing them. Mills that tighten warp preparation quality control often see efficiency gains at the loom that no amount of loom-side maintenance or setting adjustment could achieve on its own, since the root cause was never at the loom in the first place.
How does iFactory help standardize loom efficiency reporting?
iFactory calculates efficiency continuously against a per-fabric-construction theoretical maximum, automatically separates planned from unplanned downtime, and applies the same calculation method consistently across every loom and shift, eliminating the reporting inconsistencies that make efficiency numbers hard to trust or compare. Mills use this to identify which specific loss category — warp stops, weft stops, mechanical, or changeover — is driving efficiency down on a specific loom, rather than working from a single ambiguous percentage.
Get an Efficiency Number You Can Actually Trust
Inconsistent calculation methods make efficiency numbers hard to compare across looms and shifts. iFactory standardizes the calculation and shows you exactly where the lost percentage is going.