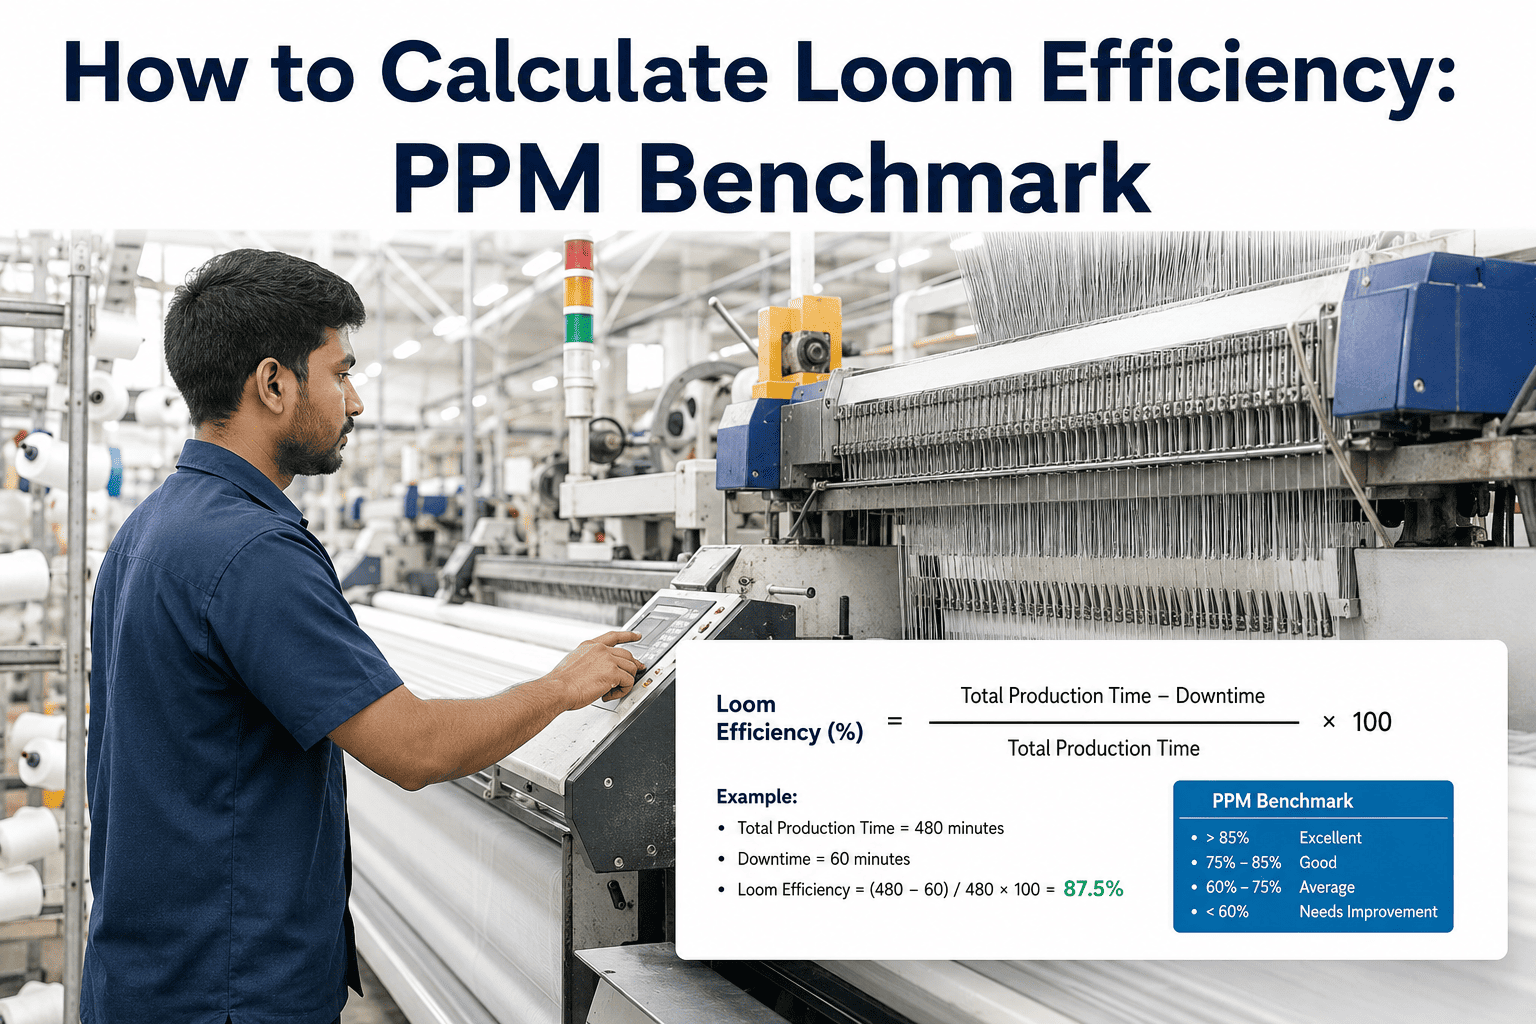
Most looms running in the 75 to 82 percent efficiency band did not arrive there by design — they drifted there over years of small, uncorrected losses that no single person was ever tasked with chasing down. Getting from that range to 90 percent and above rarely comes from one dramatic fix. It comes from breaking total stoppage time into its actual causes, ranking them by impact, and working through the list systematically instead of reacting to whichever stop happened most recently. Plants that treat efficiency as a single number to improve, rather than a sum of specific stop categories to reduce, tend to plateau well below what the loom is mechanically capable of. Book a demo to see your loom's stop-time breakdown by category.
Reality Check
A loom running at 78 percent efficiency is losing more than a fifth of its available running time to stops, changeovers, and idle periods. Identifying which specific categories make up that loss, rather than treating efficiency as one abstract target, is what separates a plant that reaches 90 percent from one that stays stuck for years.
Stop Guessing Which Stop Category Is Costing You the Most
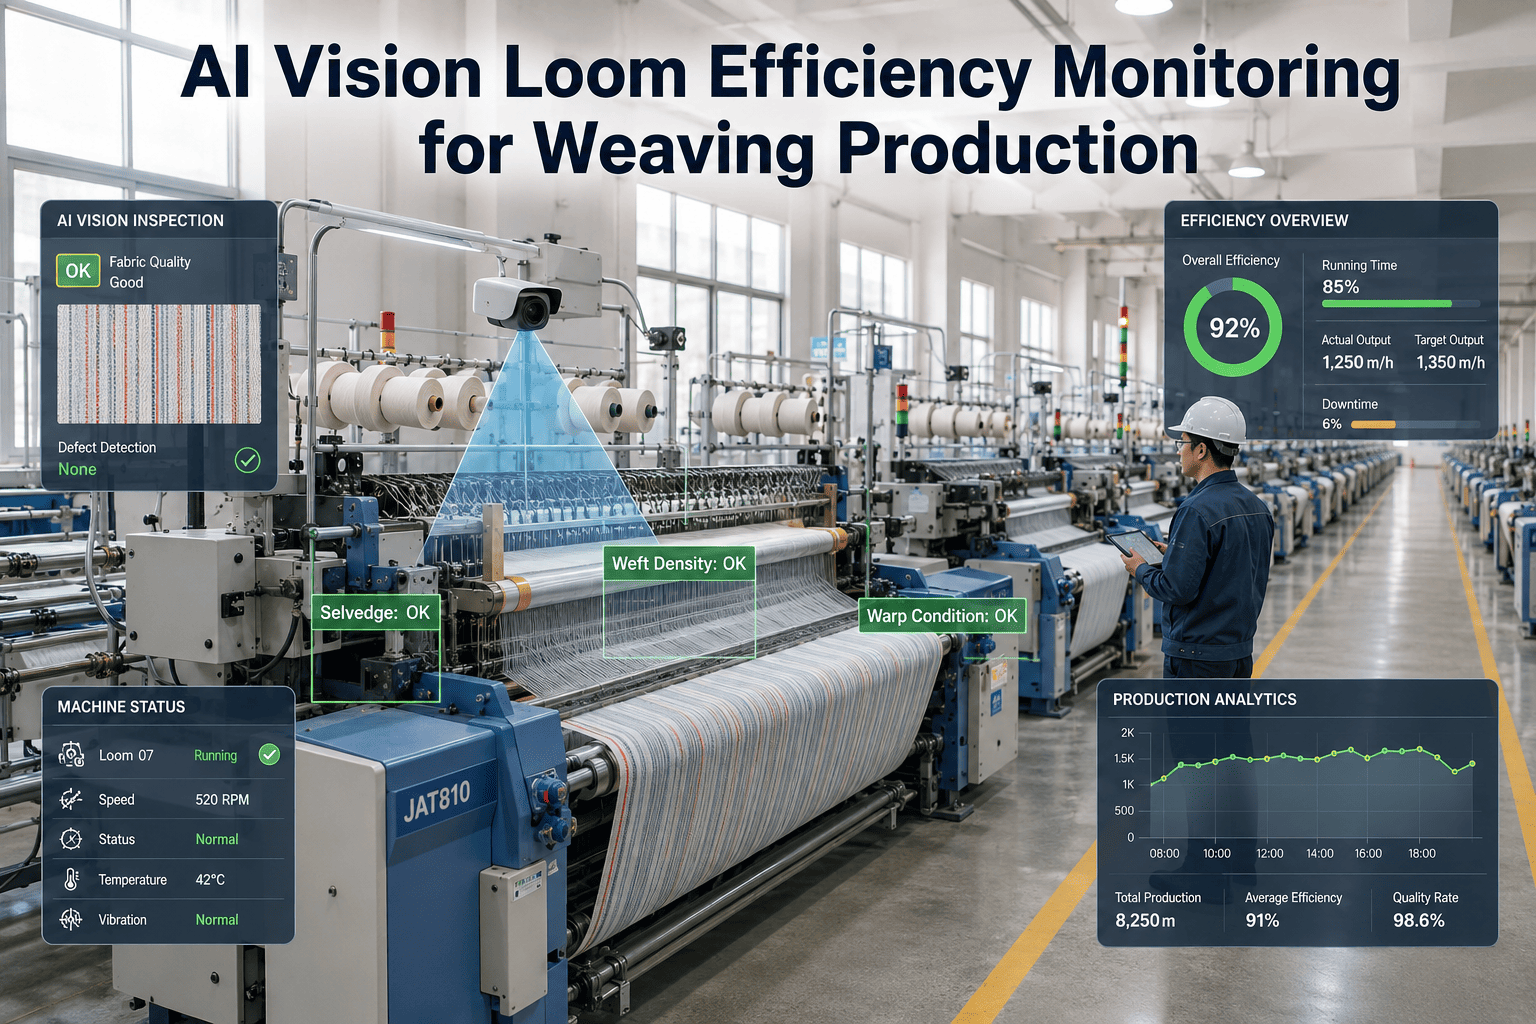
iFactory breaks total loom stoppage time into warp stops, weft stops, mechanical stops, and idle time automatically, so improvement effort goes where the data says it matters most.
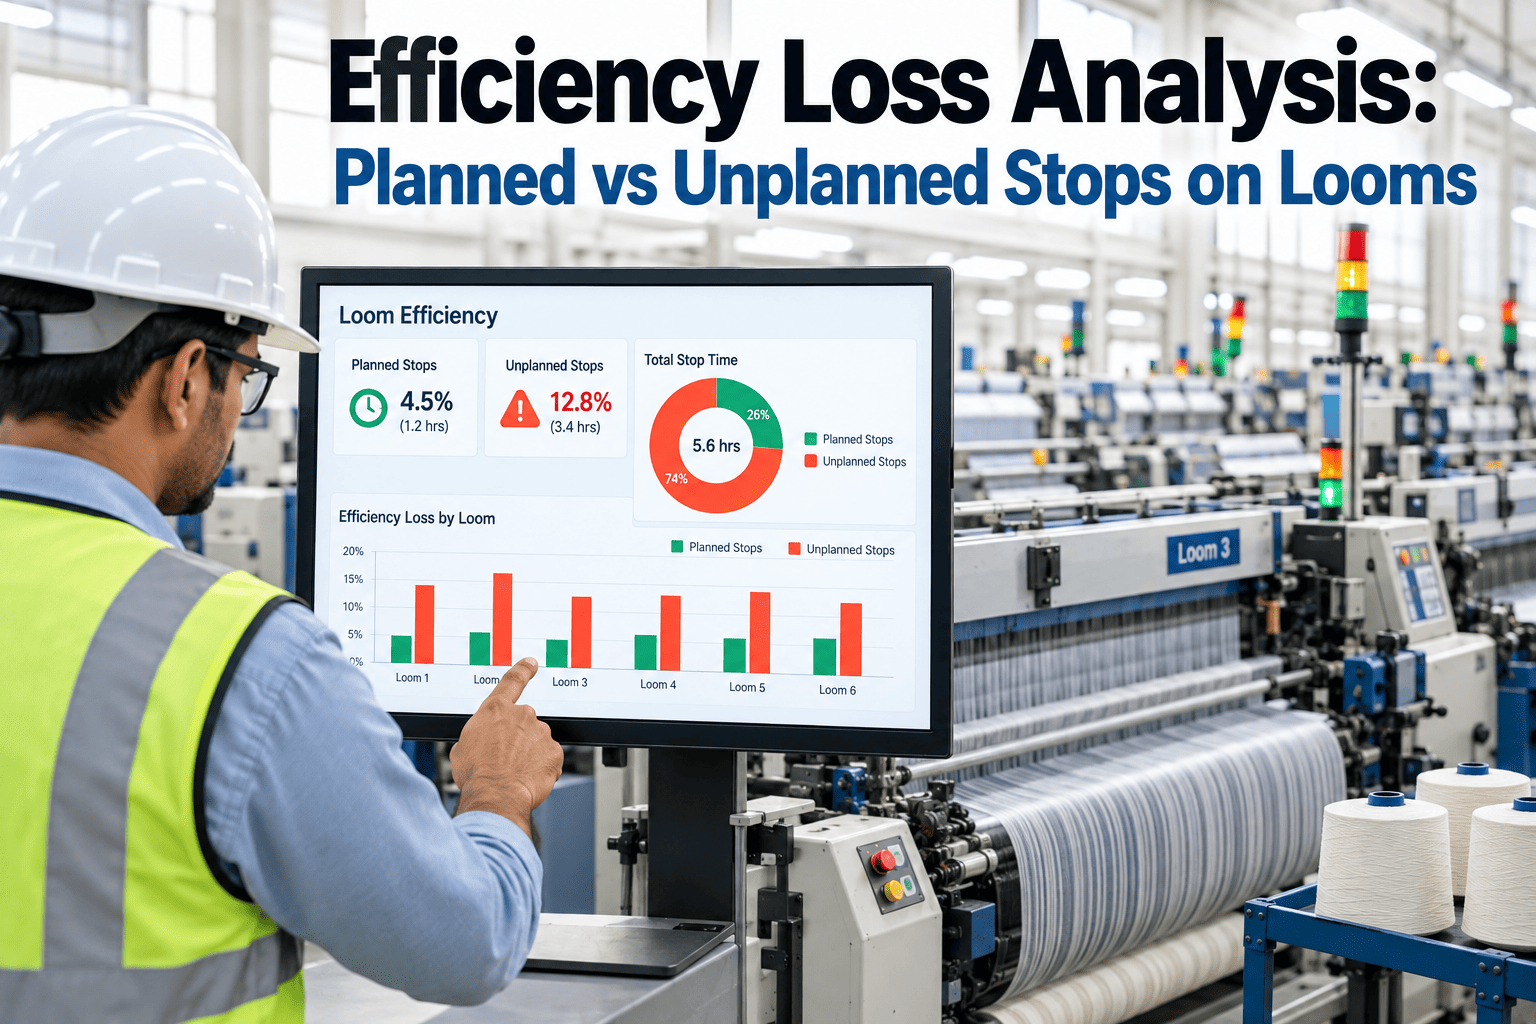
The Four Categories That Make Up Loom Efficiency Loss
Every stop on a loom falls into one of a small number of categories, and knowing the actual split between them is the starting point for any systematic improvement effort.
Warp Stops
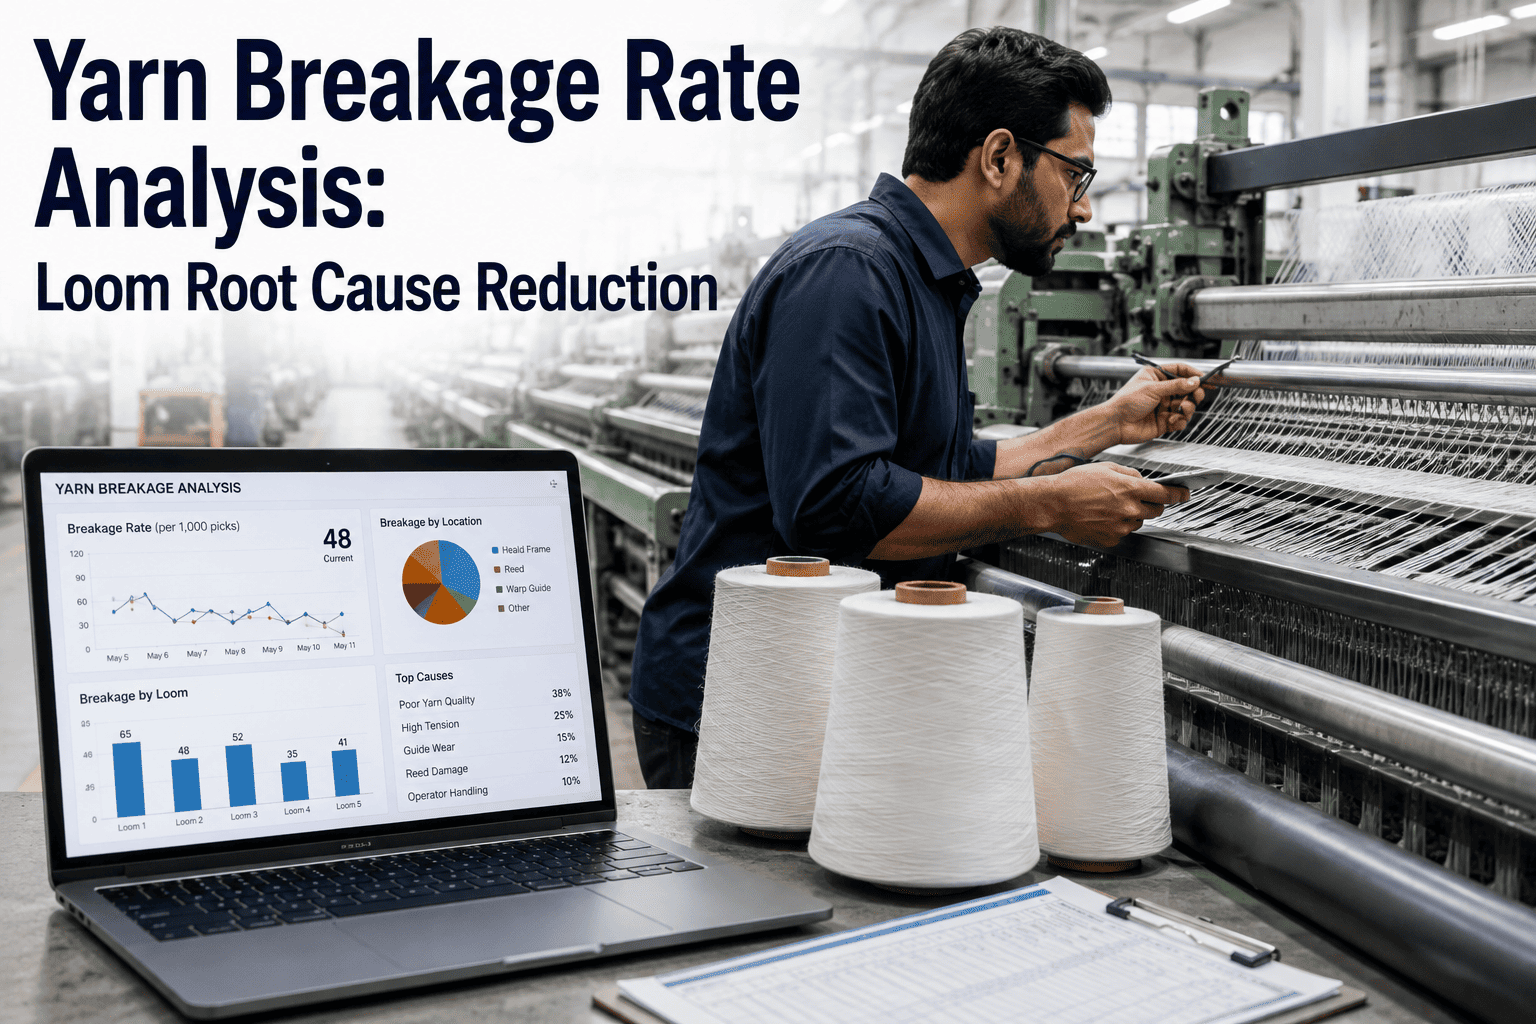
Breaks and stops caused by warp yarn failure, typically tied to sizing quality, beam tension, or yarn strength, and usually the largest single category on looms running below target efficiency.
Weft Stops
Stops caused by weft insertion failure, yarn breaks, or tension irregularity, varying significantly by insertion technology between rapier, air-jet, and projectile machines.
Mechanical Stops
Stops from machine faults, part wear, or maintenance-related failures, generally smaller in count than yarn-related stops but often longer in duration per incident.
Idle and Changeover Time
Time lost to style changes, beam changes, and planned idle periods that are not technically stops but still subtract directly from available running time.
A Systematic Five-Stage Improvement Approach
Moving efficiency upward in a durable way follows roughly the same sequence regardless of starting point, because each stage builds the data the next stage needs.
1
Establish an accurate current-state baselineBefore changing anything, get an honest breakdown of current efficiency by stop category and by loom, since improvement targets set against an inaccurate baseline lead effort in the wrong direction from the start.
2
Rank stop categories by total time lost, not by countA category with fewer stops but longer average duration per stop can cost more total running time than a category with frequent but brief stops, so ranking by cumulative time rather than incident count directs effort correctly.
3
Root cause the top category before moving to the nextWorking through root cause analysis on the single largest category first, rather than spreading effort thin across all categories simultaneously, produces a measurable efficiency gain sooner and validates the approach before scaling it further.
4
Standardize the fix and monitor for regressionOnce a parameter change or maintenance intervention reduces stops in the top category, it needs to be written into the standard operating procedure and monitored, since gains achieved informally tend to erode once the original attention fades.
5
Move to the next category and repeatWith the top category addressed and stabilized, the process repeats on the next largest contributor, progressively closing the gap toward 90 percent rather than attempting one large simultaneous overhaul.
Rank Your Stop Categories by Actual Time Lost
iFactory ranks stop categories by cumulative time impact per loom, so your improvement program targets the biggest opportunity first instead of the most recent complaint.
Typical Efficiency Band by Improvement Stage
| Stage | Typical Efficiency Range | Primary Focus |
|---|
| Unmanaged Baseline | 70–78% | No systematic stop tracking in place |
| Early Improvement | 78–84% | Top stop category identified and addressed |
| Sustained Improvement | 84–88% | Multiple categories addressed, SOPs standardized |
| Mature Program | 90%+ | Continuous monitoring with regression prevention |
What a Mature Efficiency Program Looks Like
4
Stop Categories Tracked Continuously
By Time
Categories Ranked, Not by Count
One at a Time
Category Addressed Before Moving to Next
We spent two years chasing whichever stop had upset production the day before, and our efficiency barely moved. Once we actually ranked our stop categories by total time lost instead of by how annoying each one felt, warp stops turned out to be costing us nearly three times what we thought. Fixing sizing quality on that one category alone got us more improvement in three months than the previous two years combined.
Weaving Manager
Rapier Loom Unit — Bhilwara
Frequently Asked Questions
QHow long does it typically take to move from the high 70s to 90 percent efficiency?
The timeline varies with how large the largest stop category is and how quickly its root cause can be corrected, but plants following a systematic category-by-category approach typically see meaningful movement within the first two to three months on the top category alone, with sustained improvement toward 90 percent unfolding over six months to a year as subsequent categories are addressed and standardized.
QShould every loom in a shed be treated as one efficiency number, or tracked individually?
Tracking efficiency by individual loom rather than as a shed-wide average is important because averaging can hide the fact that a handful of specific looms are dragging the number down while most machines are already performing well. A shed-wide average that looks acceptable can mask two or three looms running well below target that deserve focused attention.
Talk to an expert about loom-by-loom efficiency tracking.QIs warp stop reduction always the highest-impact category to address first?
Warp stops are frequently the largest category, particularly on older or poorly sized yarn, but this is not universal, and some plants find mechanical stops or weft-related issues dominate depending on machine age, fabric construction, and yarn quality. This is exactly why establishing an accurate, plant-specific baseline before deciding where to focus matters more than assuming a generic industry pattern applies.
QDoes raising loom speed help efficiency, or is it a separate lever entirely?
Loom speed and efficiency are related but distinct levers, since running faster without addressing the underlying stop causes can actually increase certain stop categories, particularly weft insertion failures, and end up reducing net output despite the higher nominal speed. Efficiency improvement through stop reduction is generally a more reliable path to higher output than speed increases alone.
QHow do we prevent efficiency gains from eroding after the initial improvement push?
Standardizing the specific parameter changes or maintenance intervals that produced the gain into a written SOP, and continuing to monitor stop data after the fix rather than only during the improvement project, is what prevents gains from quietly eroding once attention moves elsewhere. Plants that treat efficiency improvement as a one-time project rather than an ongoing monitoring discipline tend to see the numbers drift back down within a year.
Book a demo to see ongoing regression monitoring in action.
Find Your Highest-Impact Stop Category First
iFactory ranks warp, weft, mechanical, and idle time losses by actual impact per loom, giving your improvement program a clear, data-driven starting point.