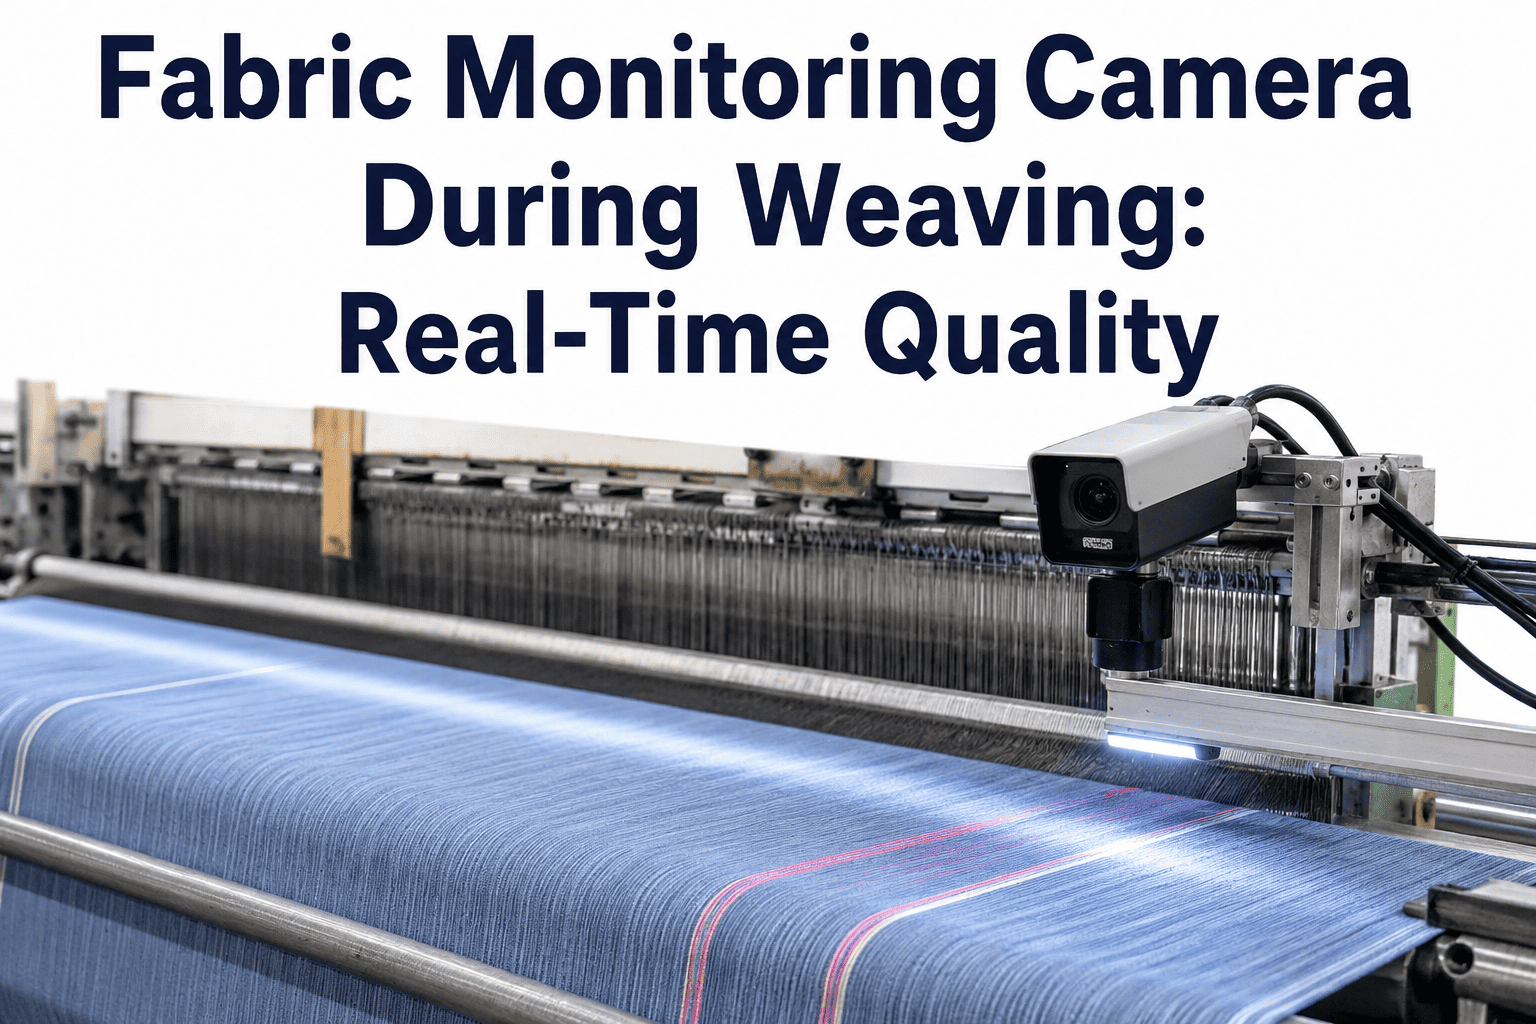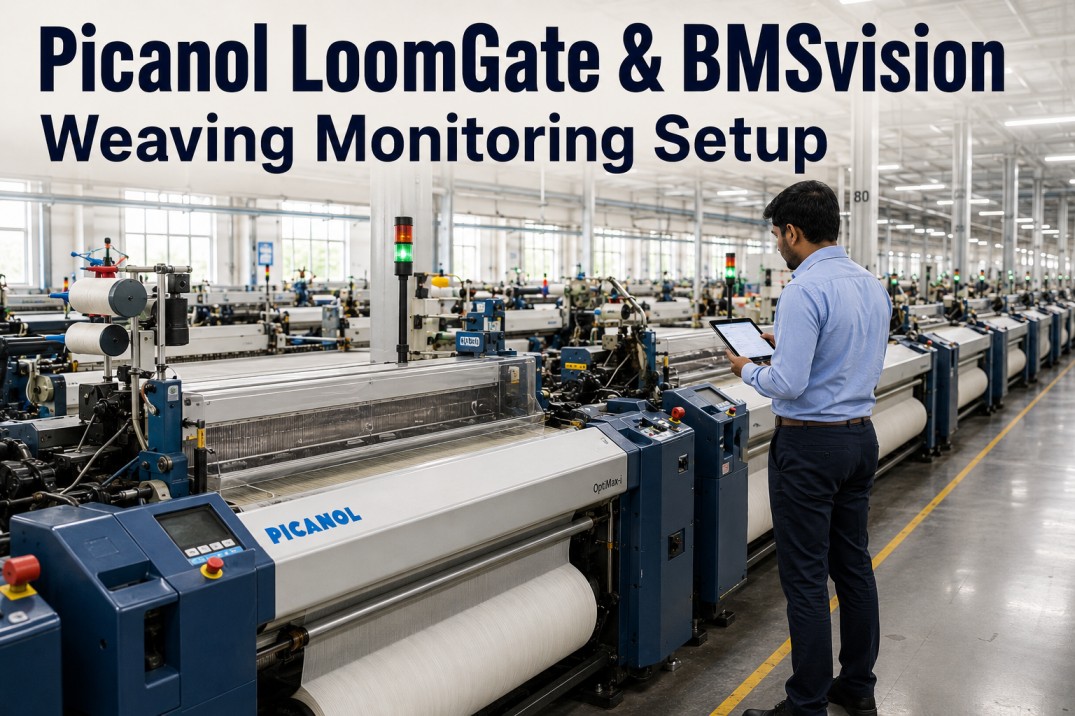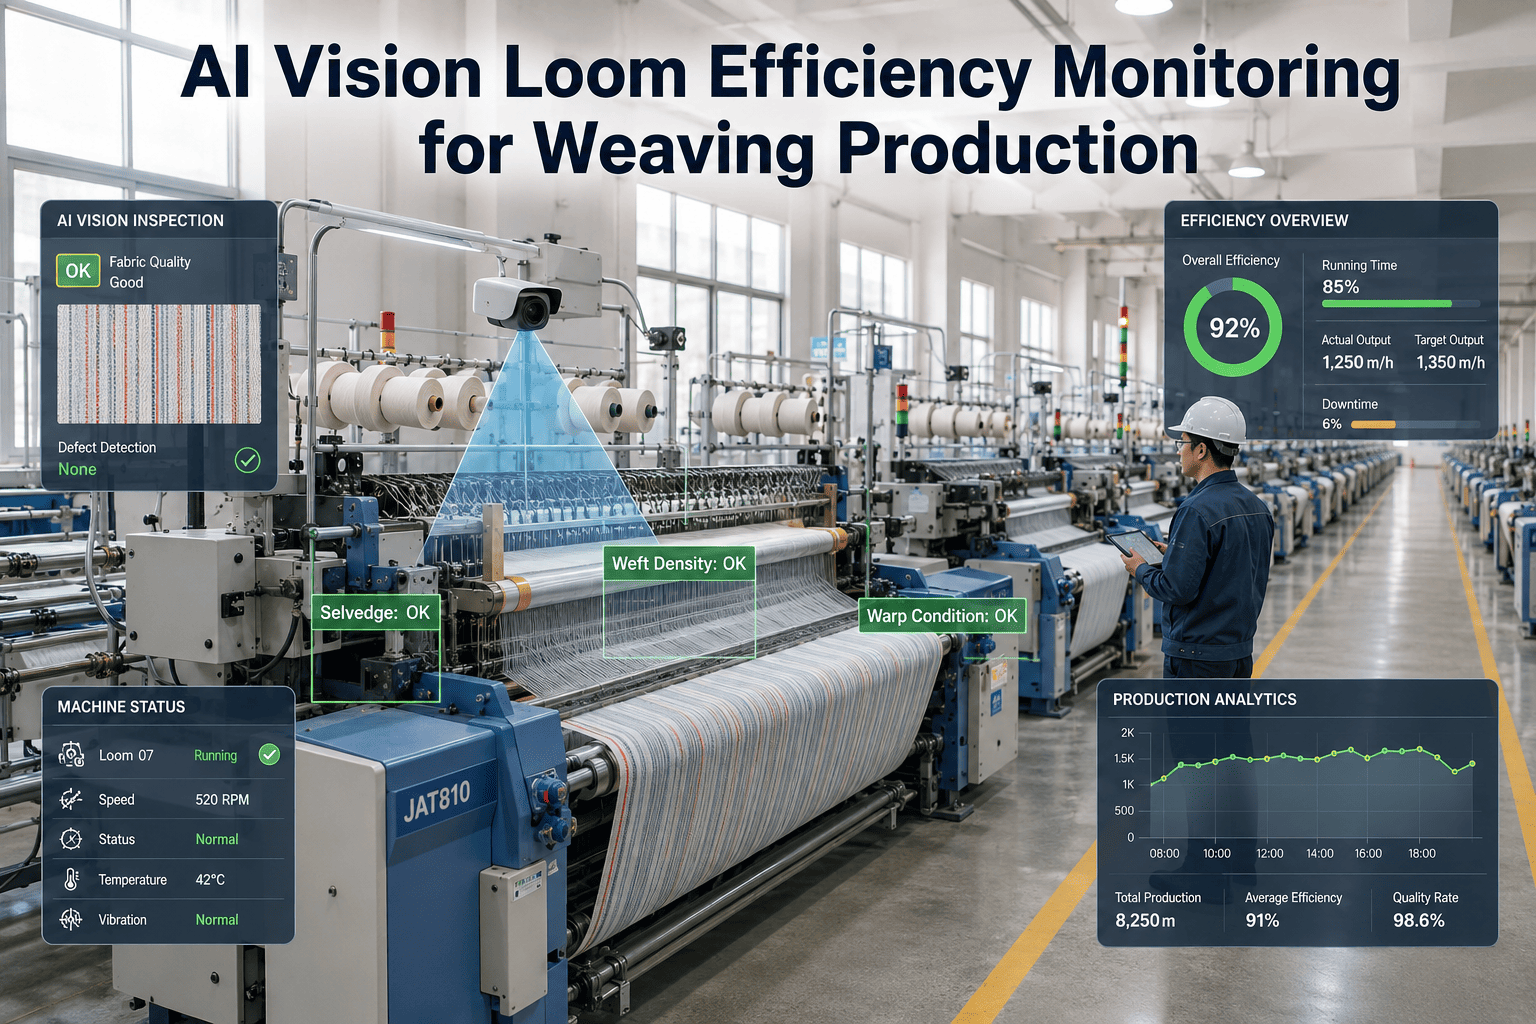
Ask a plant manager what their loom efficiency was last week and most can quote a number from the end-of-shift report. Ask them why efficiency dropped on Tuesday afternoon and the answer usually turns into a guess involving a yarn batch, an absent operator, or a machine that "was acting up." Efficiency reports tell you what happened; they rarely tell you why, and by the time a weekly report lands on a desk, the production hours behind that number are already gone. iFactory's AI vision cameras watch every loom continuously and attribute every minute of lost efficiency to its real cause the moment it happens, and you can book a demo to see it running against your own shed.
Weaving Sheds Lose 15 to 20 Percent of Loom Time to Stoppages Most Managers Only See in a Weekly Report
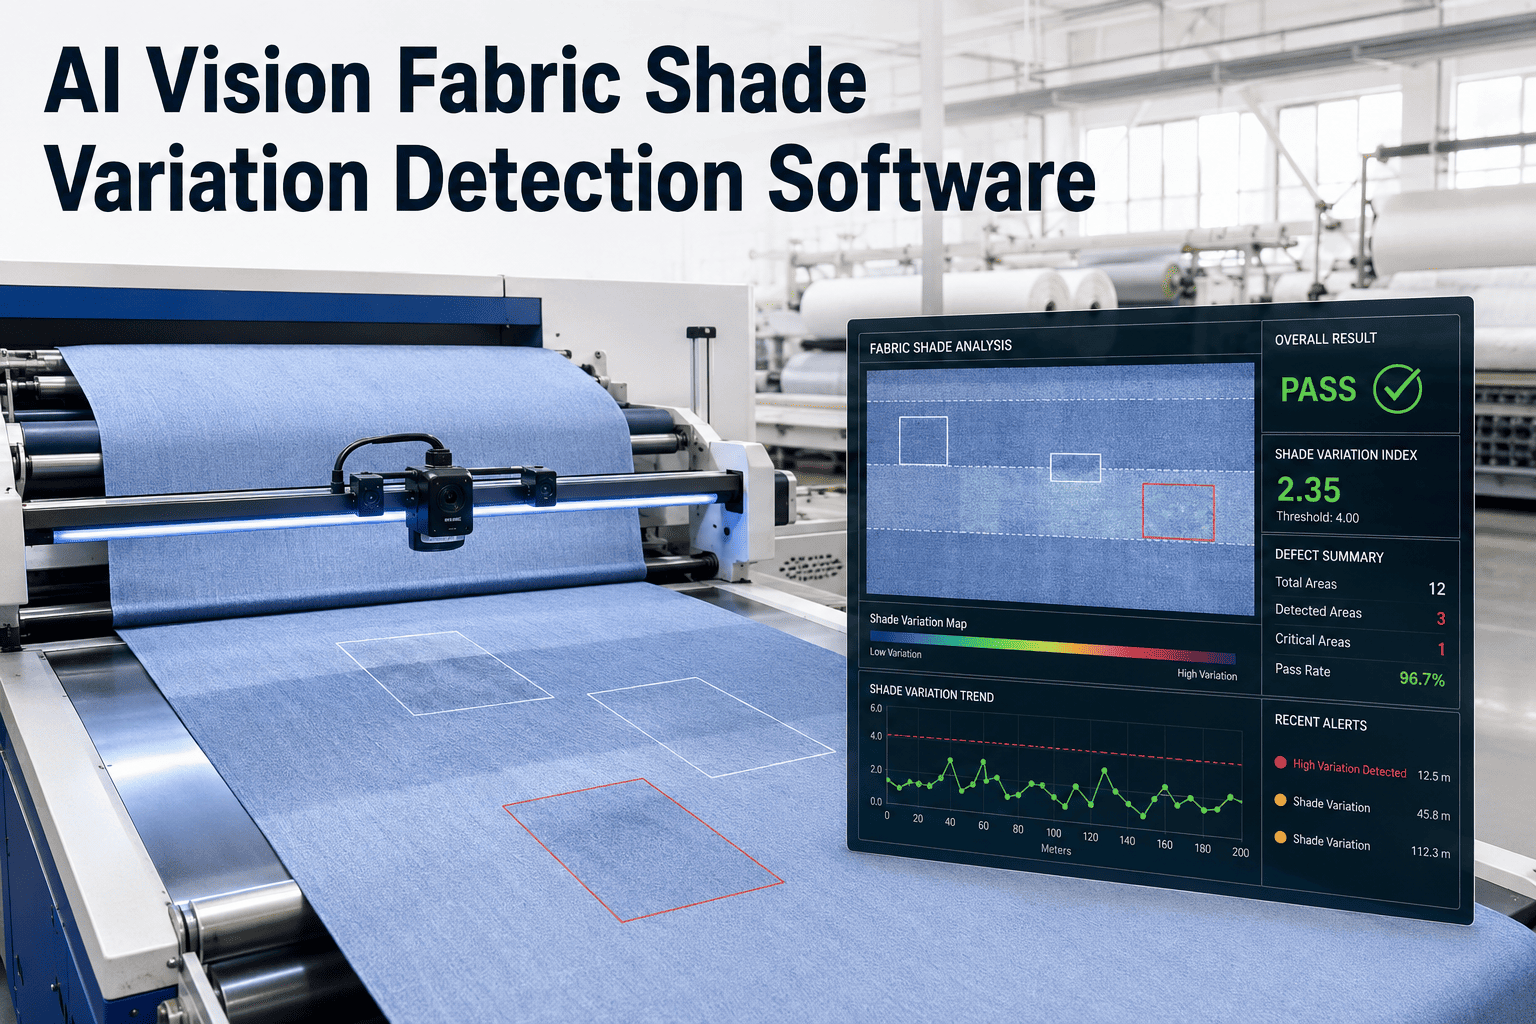
iFactory's AI vision cameras track every loom stoppage, operator response delay, and fabric fault as it happens, turning a lagging weekly efficiency report into a live floor-level view you can act on the same shift.
Loom Efficiency Loss Breaks Down Into Three Trackable Categories, Not One Vague Number
Textile efficiency studies consistently point to the same pattern: warp breaks dominate stoppage time, weft breaks take the second largest share, and mechanical or electrical causes make up the remainder. A single efficiency percentage hides which of these three is actually costing your shed the most time this week.
These figures reflect stoppage-cause studies from air-jet weaving sheds and shift based on loom type, yarn quality, and shed conditions, which is exactly why a shed needs its own live breakdown rather than an industry average.
Four Efficiency Signals iFactory's Vision Cameras Capture on Every Loom, Every Shift
Efficiency loss is rarely a single event. It accumulates across stoppages, delays, and quality issues that a weekly report compresses into one number, losing the detail a supervisor needs to fix the actual problem.
Stoppage Detection
Identifies the exact moment a loom stops and classifies the likely cause from visual cues at the stoppage point, rather than waiting for a manual log entry.
Operator Response Time
Measures the gap between a stoppage starting and a weaver arriving to fix it, surfacing coverage gaps across loom assignments.
Fabric Fault Flagging
Flags visible fabric defects such as skip weaves or startup marks as they form, tying quality loss directly to the stoppage that caused it.
Bottleneck Ranking
Ranks looms by cumulative lost time across a shift, so supervisors know exactly which machines need attention first.
A Weekly Efficiency Report Cannot Tell You What Happened at 2 PM on Tuesday
iFactory's AI vision cameras attribute every minute of lost loom time to its real cause as it happens, so your team can fix today's bottleneck today instead of next week.
What a Shift Supervisor Sees on the Loom Efficiency Dashboard
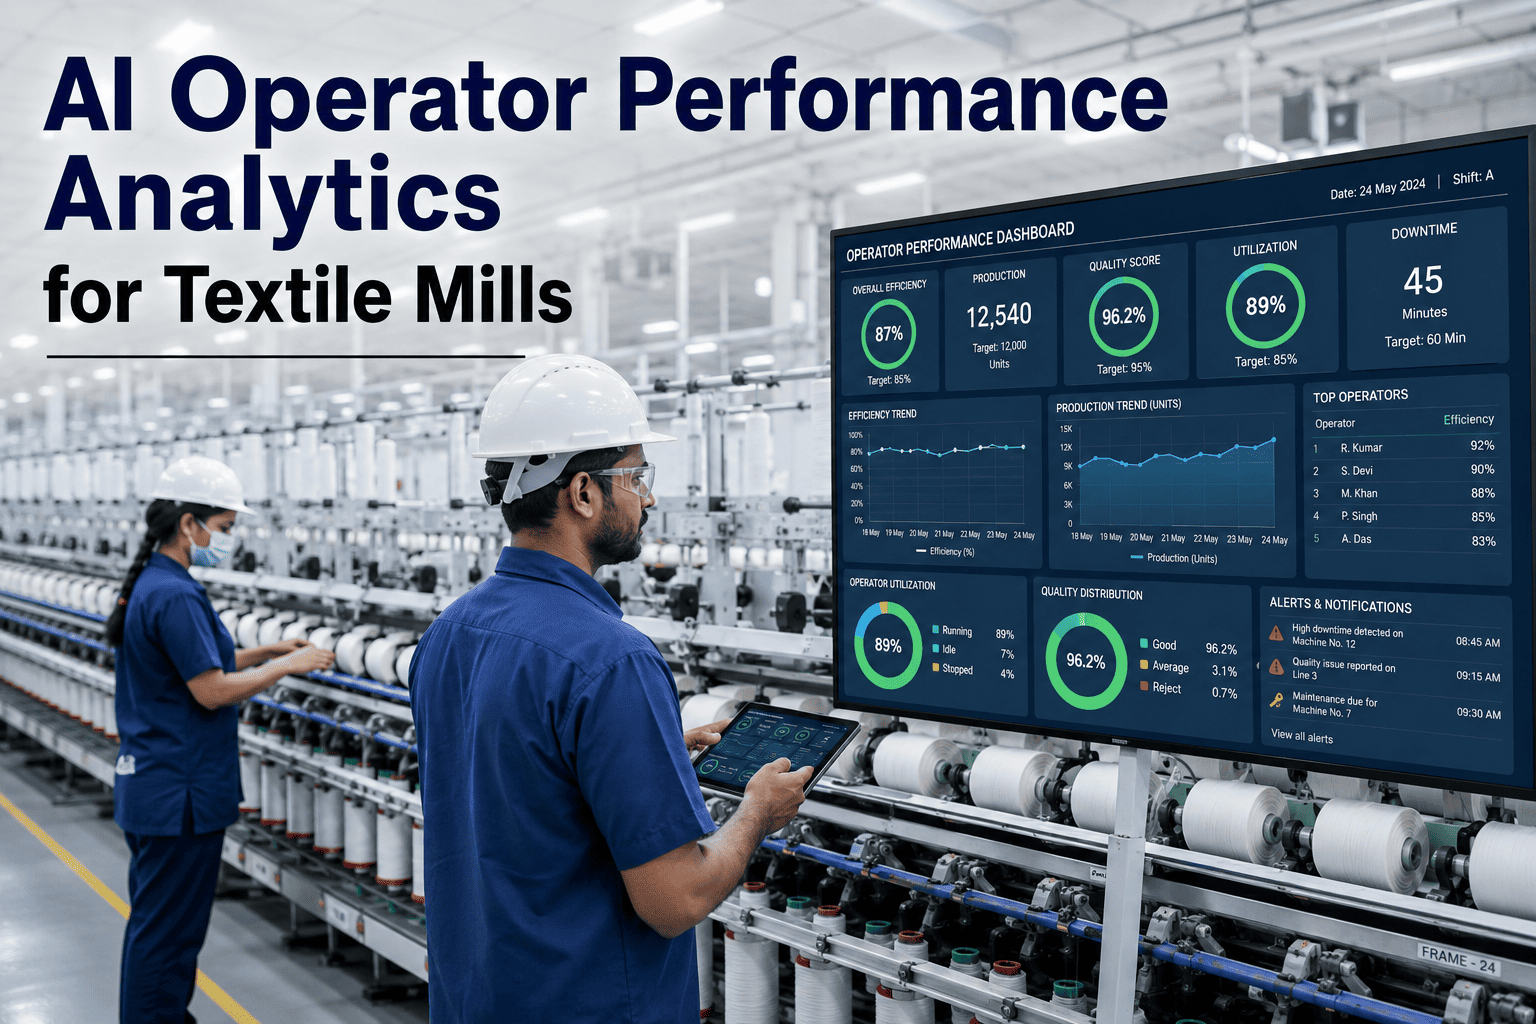
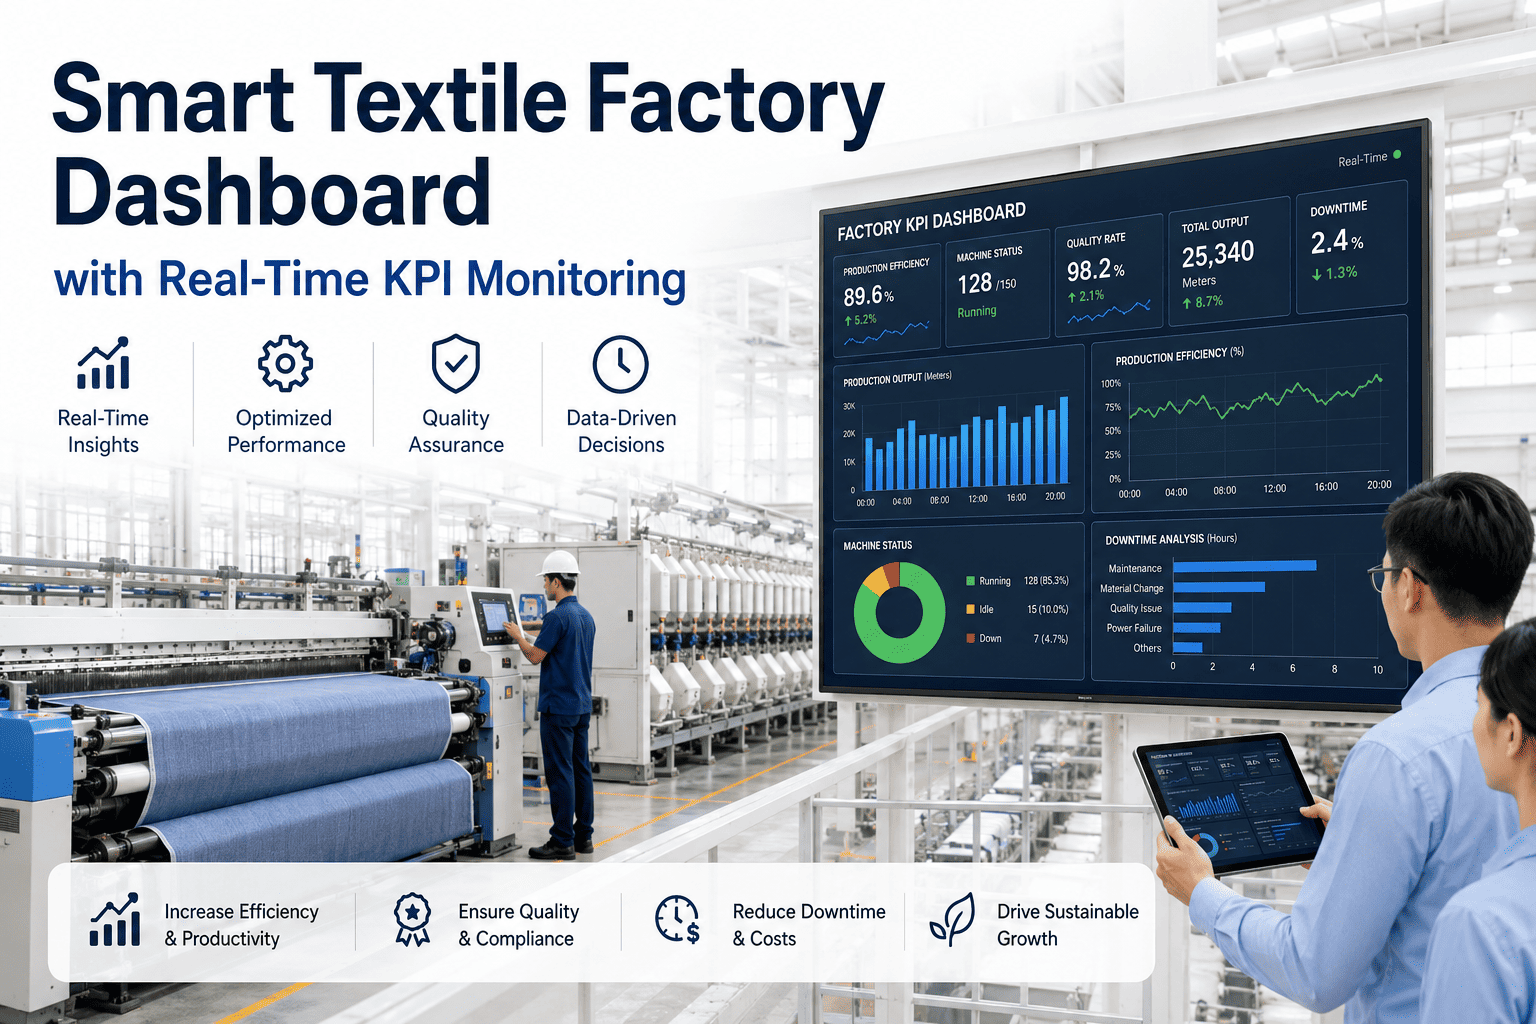
Rather than a single shed-wide percentage, supervisors get a live, sortable view of every loom's performance across the shift, so attention goes to the machines actually losing time right now.
| Loom ID | Efficiency | Top Loss Cause | Lost Minutes (Shift) |
|---|---|---|---|
| L-014 | 92% | Weft break | 18 min |
| L-027 | 81% | Warp break | 52 min |
| L-033 | 74% | Warp break | 71 min |
| L-041 | 88% | Operator delay | 29 min |
Results Reported by Weaving Sheds Running AI Vision Efficiency Monitoring
The following figures reflect performance changes reported by sheds after moving from periodic manual efficiency logging to continuous AI vision monitoring across a full production cycle.
Questions Plant Managers Ask About AI Loom Efficiency Monitoring
Stop Waiting for a Weekly Report to Tell You What Went Wrong on the Floor
iFactory's AI vision cameras track stoppages, response times, and fabric faults on every loom in real time. Book a demo and see your own efficiency data broken down by real cause.