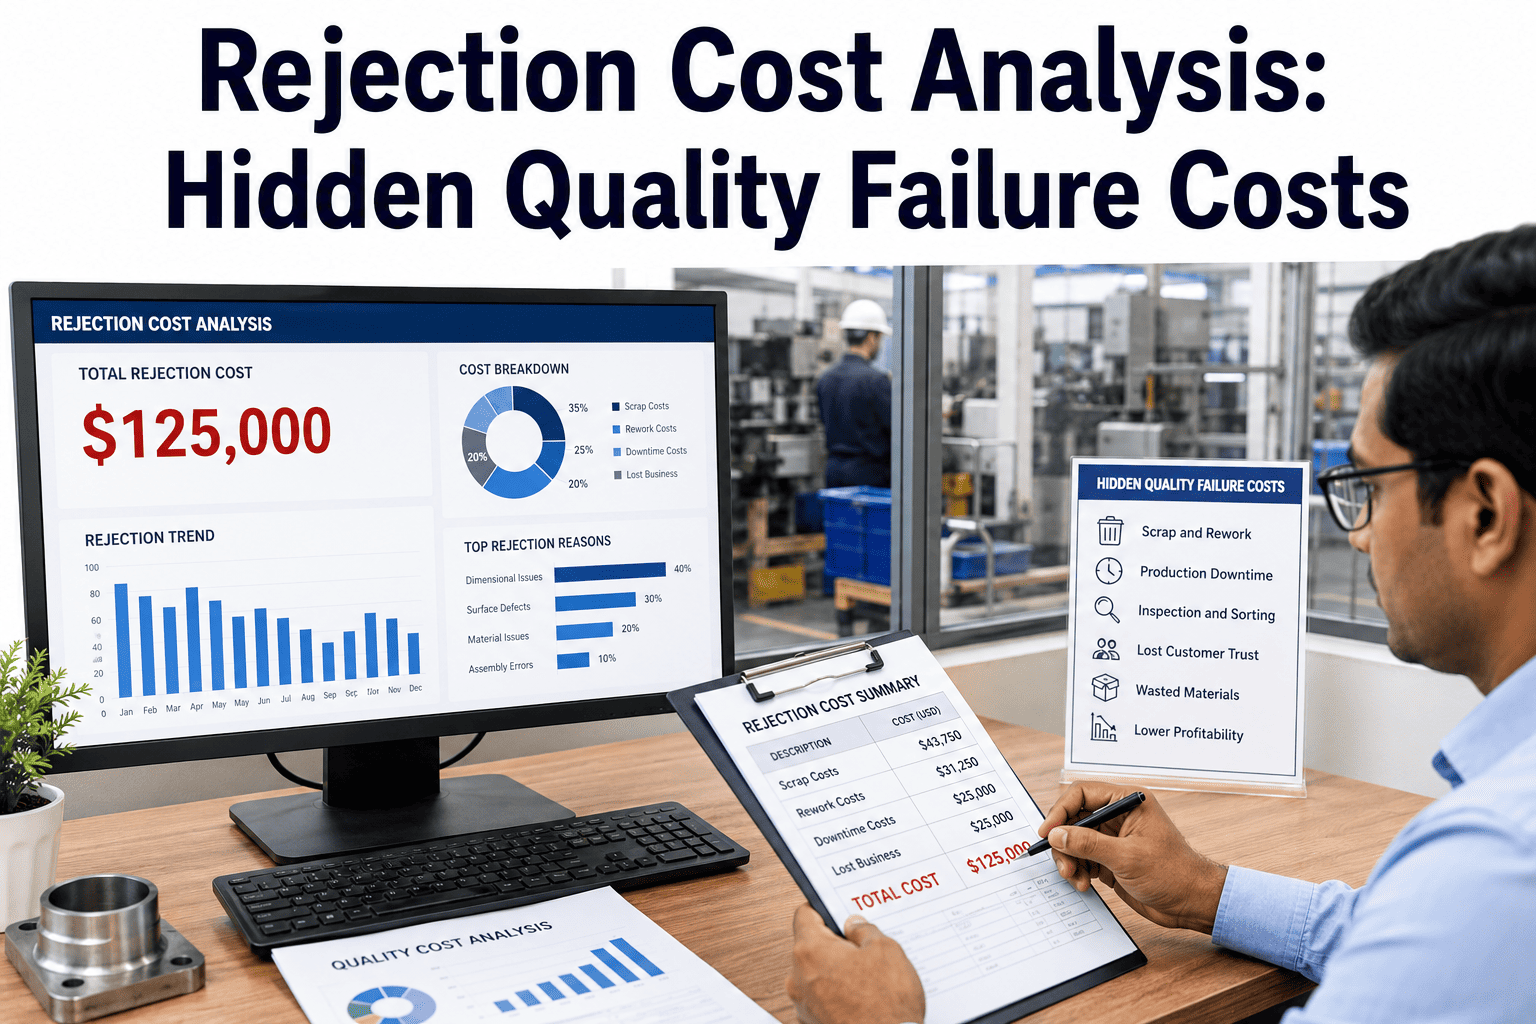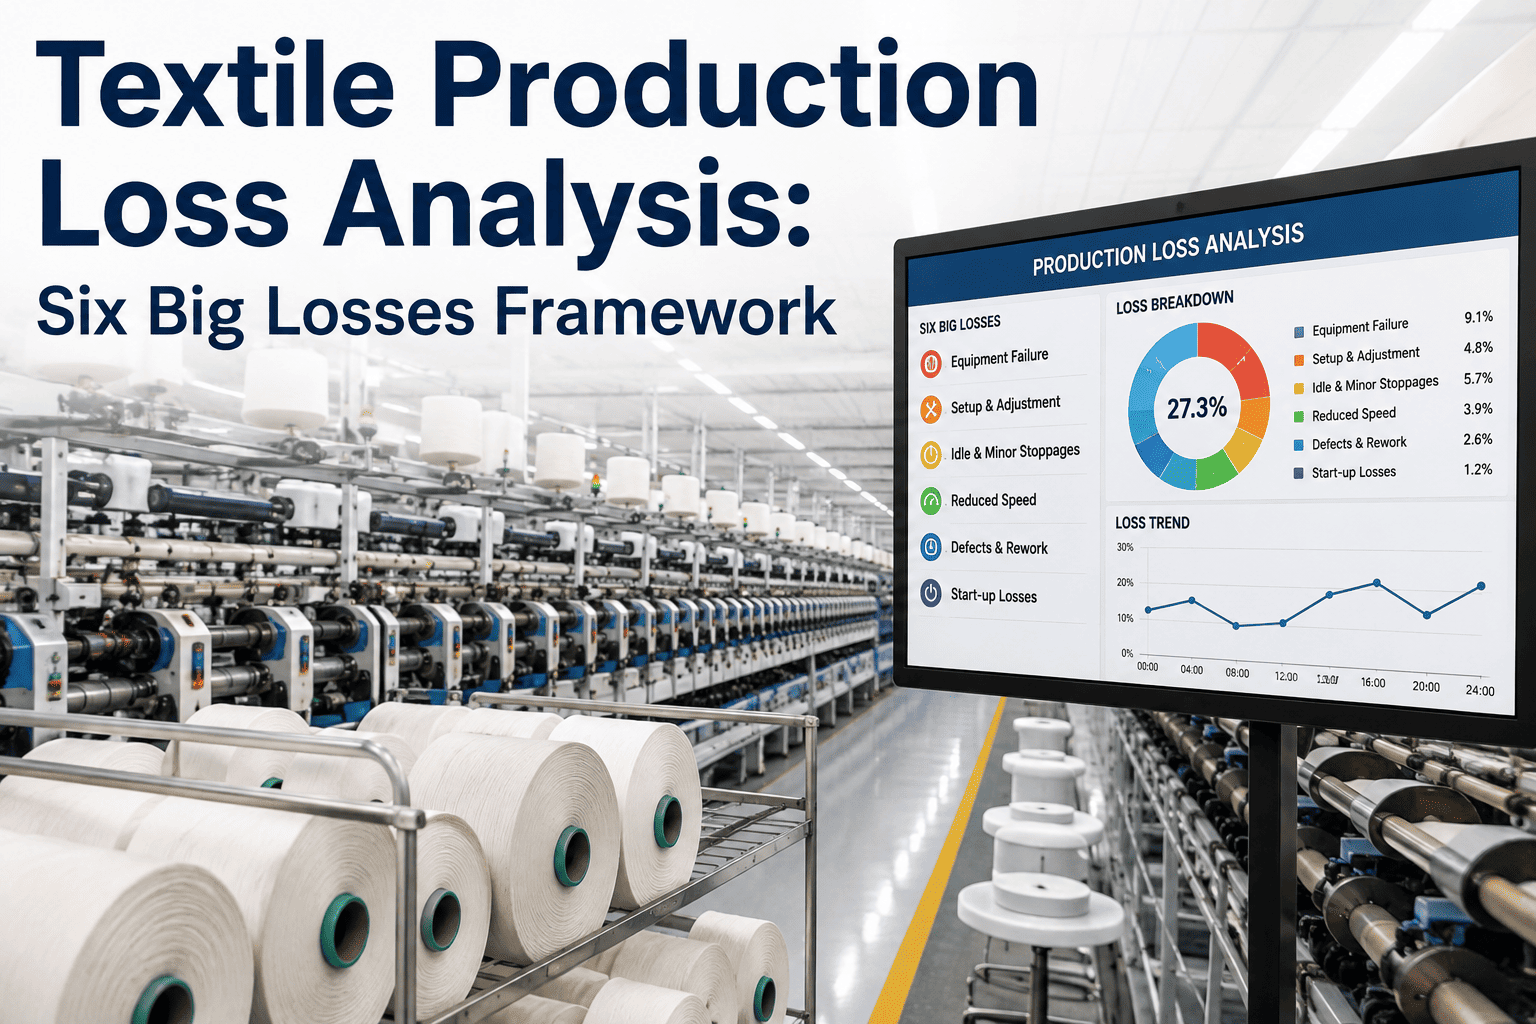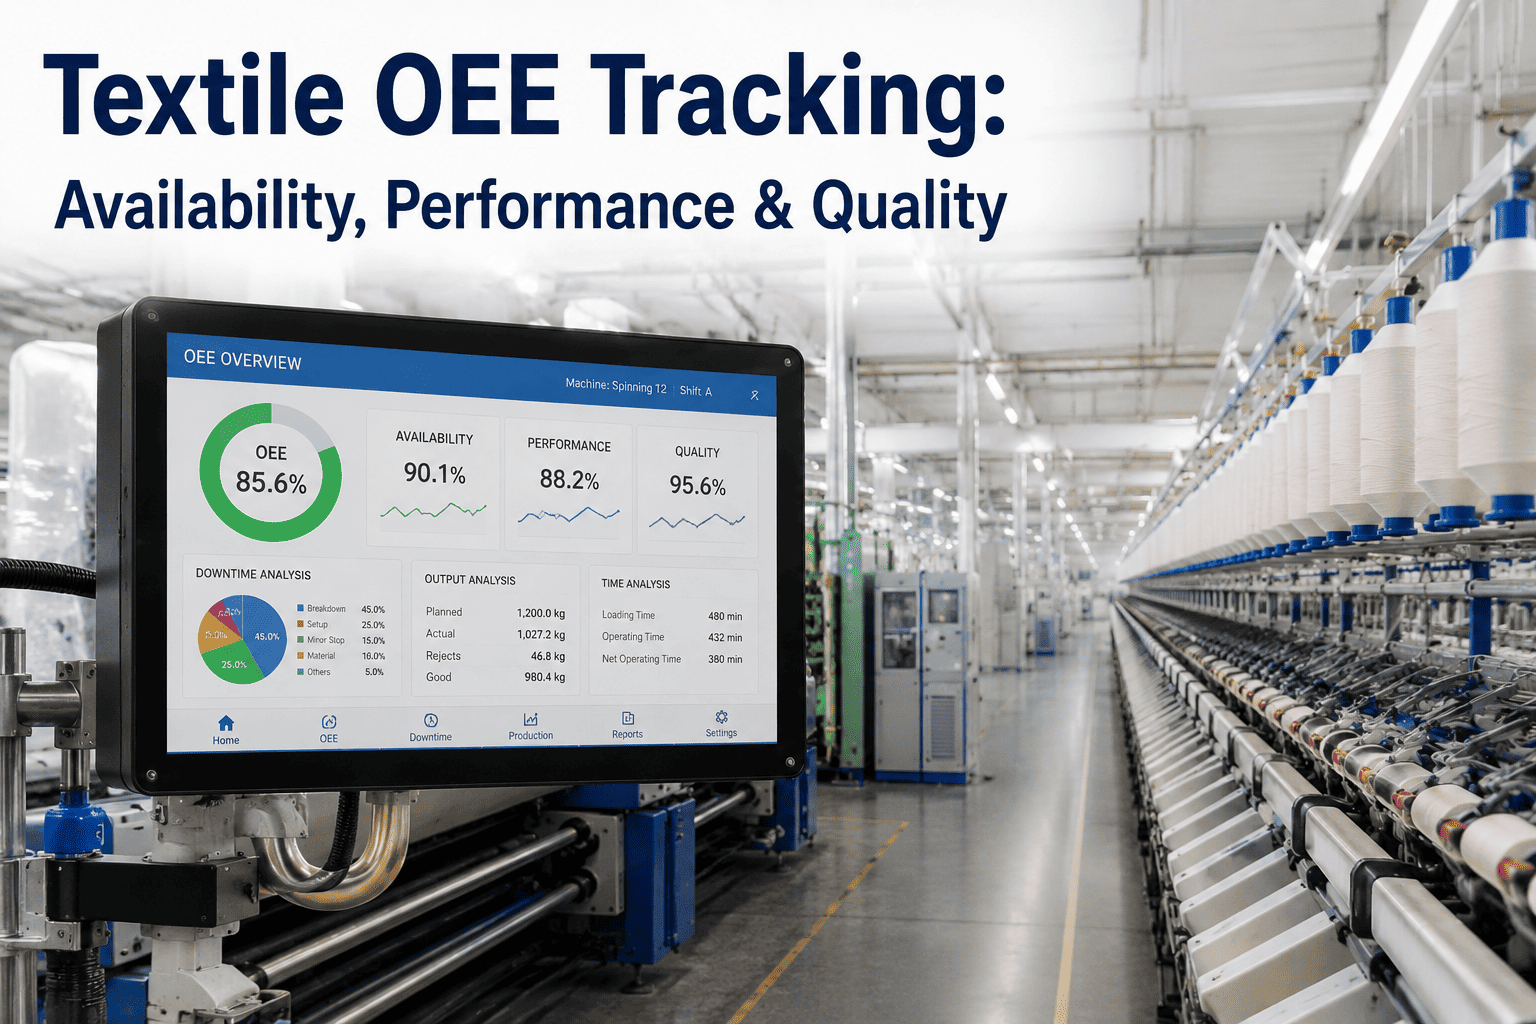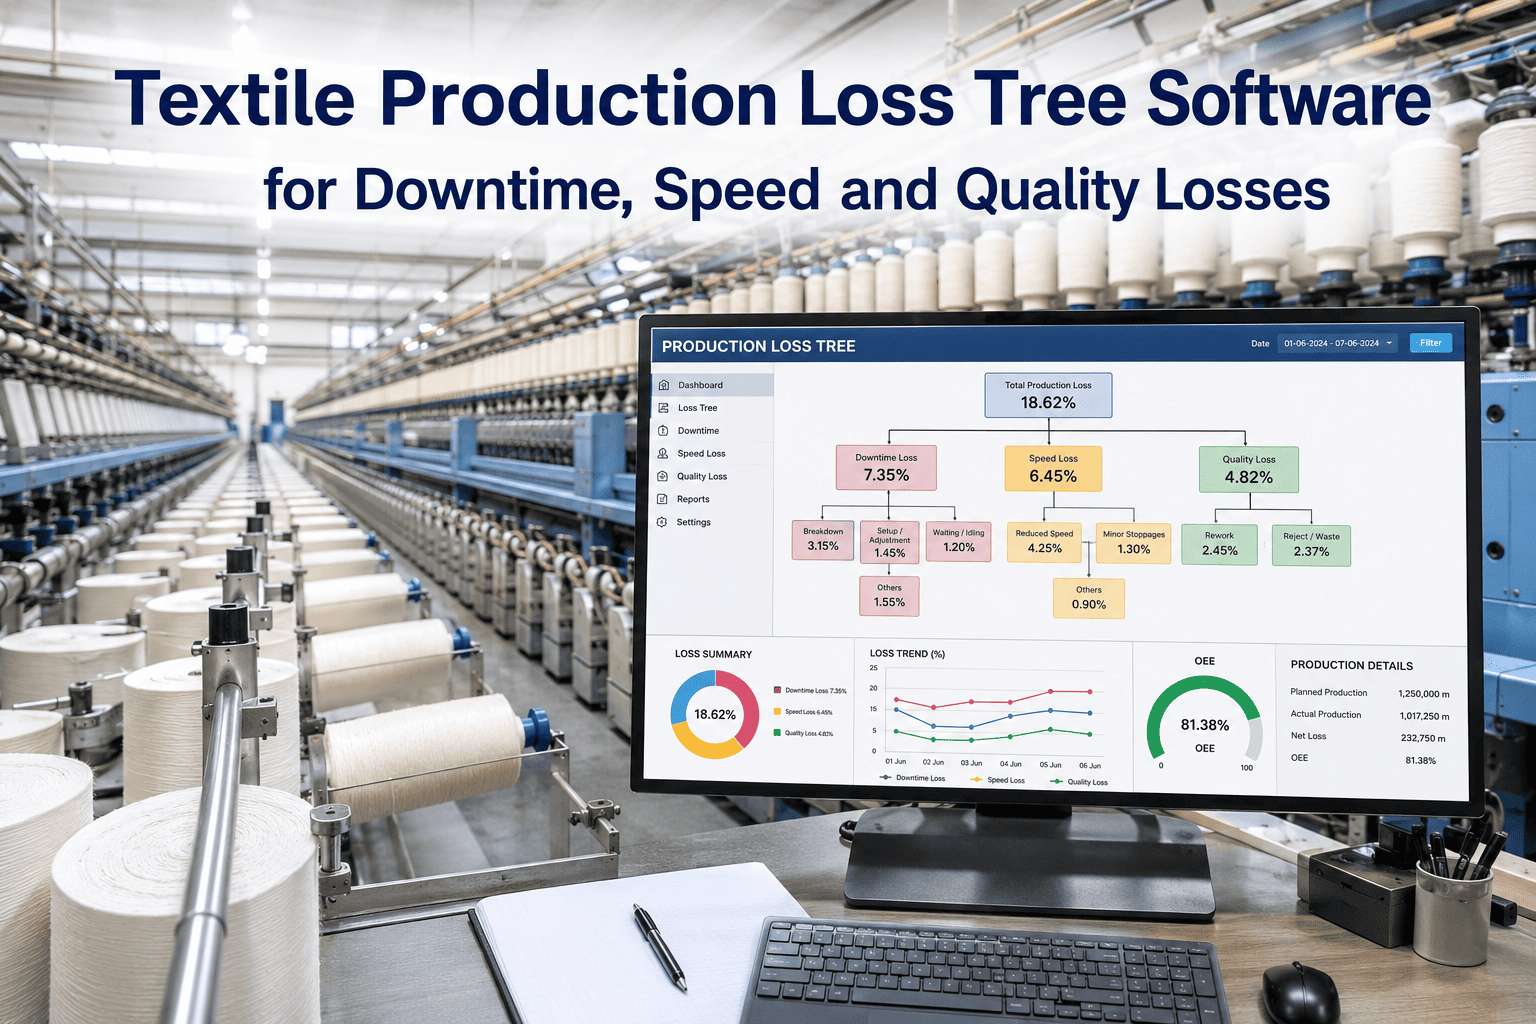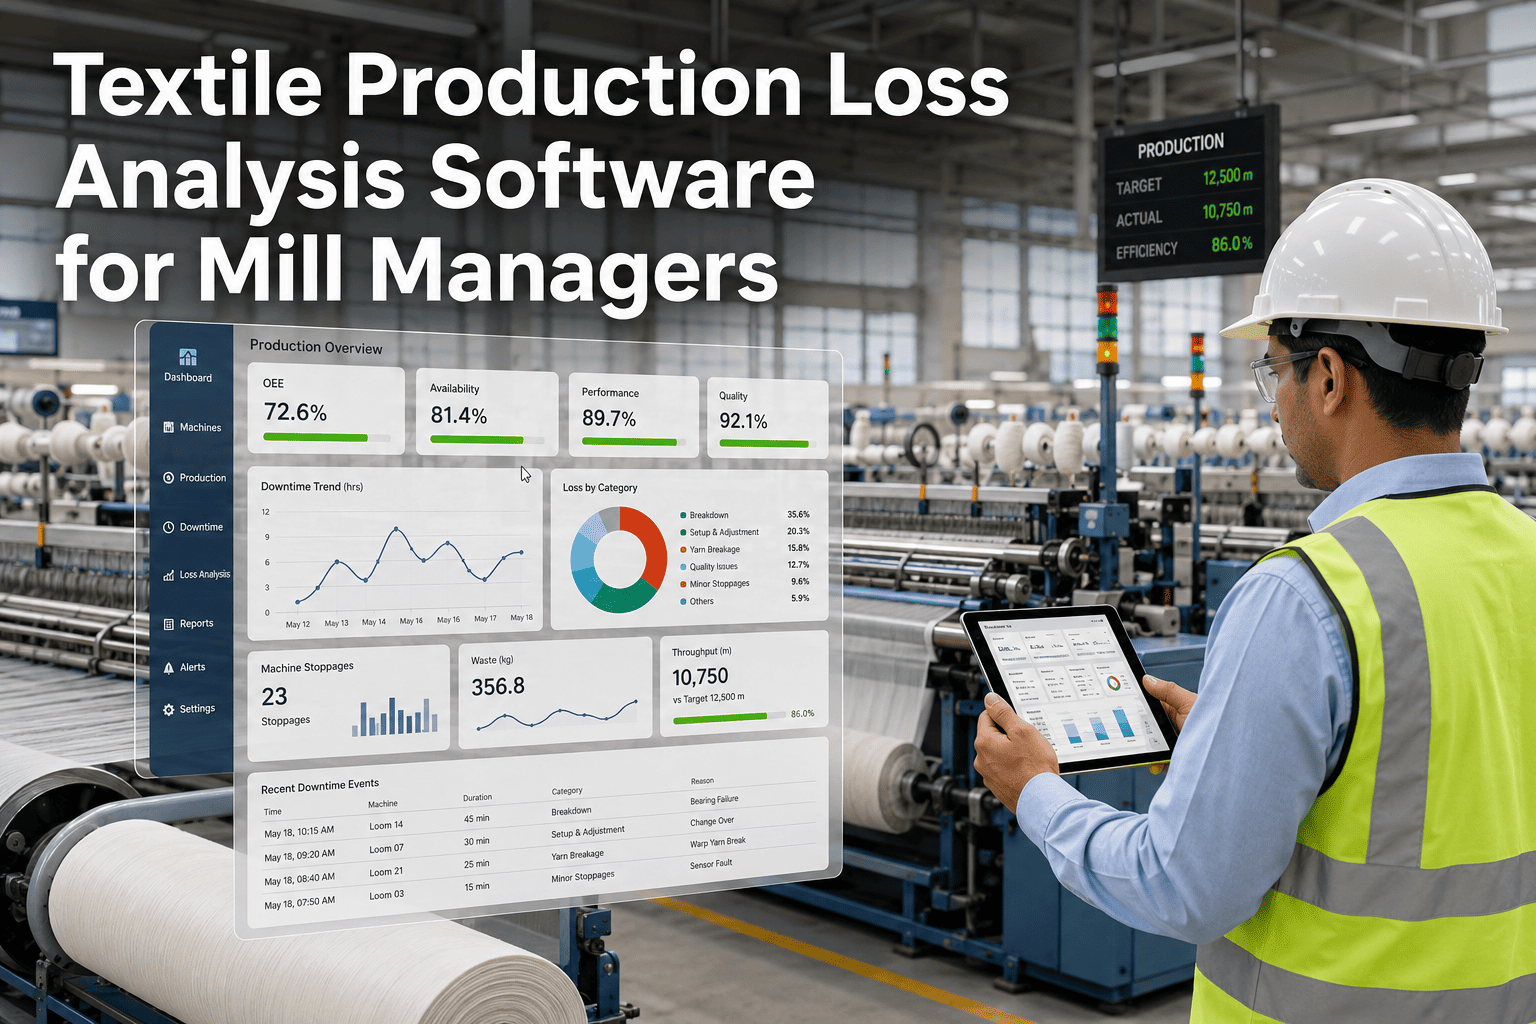
A mill running at 82 percent efficiency looks fine on a summary report, but that single number hides a specific chain of losses: some picks lost to downtime, some to running slower than rated speed, some to quality rejects, and some to the changeover between fabric styles. Most mill managers can quote the final efficiency figure without being able to say which of these four categories is actually eating the most production time this month, because each one tends to live in a different report, if it is tracked at all. iFactory's AI breaks total output loss down into its real causes automatically, and you can book a demo to see your own loss breakdown calculated from live production data.
Between Rated Capacity and Shipped Fabric, Most Mills Lose 20 to 35 Percent of Production to Causes Nobody Has Fully Mapped
iFactory's AI tracks every stage of production loss, from downtime to speed loss to quality rejects to changeovers, and shows exactly where your mill's capacity is disappearing before the next report cycle.
From Rated Capacity to Shipped Fabric — Where the Volume Actually Goes
Production loss compounds in stages, and each stage narrows total available capacity a little further before fabric ever reaches the warehouse floor.
The Four Causes Behind Every Point of Missing Efficiency
Stoppages and Breakdowns
Warp breaks, weft breaks, mechanical failures, and waiting time for repairs, historically the single largest category in weaving sheds.
Running Below Rated Speed
Looms and machines operating slower than their rated capacity due to yarn quality, humidity conditions, or conservative operator settings.
Rejects and Rework
Fabric defects such as skip weaves, startup marks, and off-shade dyeing that require downgrading, rework, or rejection before shipment.
Style and Beam Transitions
Time lost switching between fabric styles, beam gaiting, and machine setup, often underestimated because it happens between production runs rather than during them.
An 82 Percent Efficiency Number Cannot Tell You Which of Four Categories Is Costing You the Most
iFactory's AI breaks total loss into downtime, speed, quality, and changeover, so your team fixes the biggest bucket first, not the loudest one.
From Raw Production Data to a Ranked Loss Report in Three Steps
Continuous Data Capture
Loom and machine data, stoppage logs, and quality inspection results are captured continuously rather than compiled at shift end, preserving the timing detail a summary report loses.
Loss Classification
Every gap between rated and actual output is classified into downtime, speed, quality, or changeover loss using machine state and quality data together.
Ranked Reporting by Line and Shift
Losses are ranked by dollar or volume impact per line, shift, and asset, so the team knows exactly where to focus improvement effort first.
What a Ranked Loss Breakdown Looks Like on the Floor
| Production Line | Downtime Loss | Speed Loss | Quality Loss | Top Priority |
|---|---|---|---|---|
| Weaving Line A | 11.2% | 4.1% | 2.8% | Downtime |
| Weaving Line B | 6.4% | 8.9% | 3.1% | Speed Loss |
| Dyeing Line 2 | 5.0% | 2.2% | 9.7% | Quality Loss |
What Mill Managers Report After Deploying Loss Analysis Software
Questions Mill Managers Ask About Production Loss Analysis
Stop Guessing Which Loss Category Is Costing You the Most Output
iFactory's AI ranks downtime, speed, quality, and changeover loss by real impact on every line, every shift. Book a demo and see the breakdown behind your own efficiency number.