Compressed air is the most expensive utility in a textile mill, consuming 10 to 30 percent of total electrical load depending on the mix of air-jet looms, ring spinning traveler systems, and pneumatic controls. The U.S. Department of Energy estimates that 20 to 30 percent of all compressed air generated in a typical industrial facility is lost to leaks — and textile mills, with their extensive pipe networks, vibration-heavy machinery, and continuous three-shift operation, consistently land at the upper end of that range. A single 3-millimeter orifice in a 7-bar line wastes approximately $2,500 per year in continuous operation, and most mills operate dozens of undetected leaks across spinning, weaving, and finishing departments. The compounding effect is a direct drag on margin that few operations teams can see without the right detection infrastructure.
Find the Leaks That Are Costing Your Mill Thousands per Month
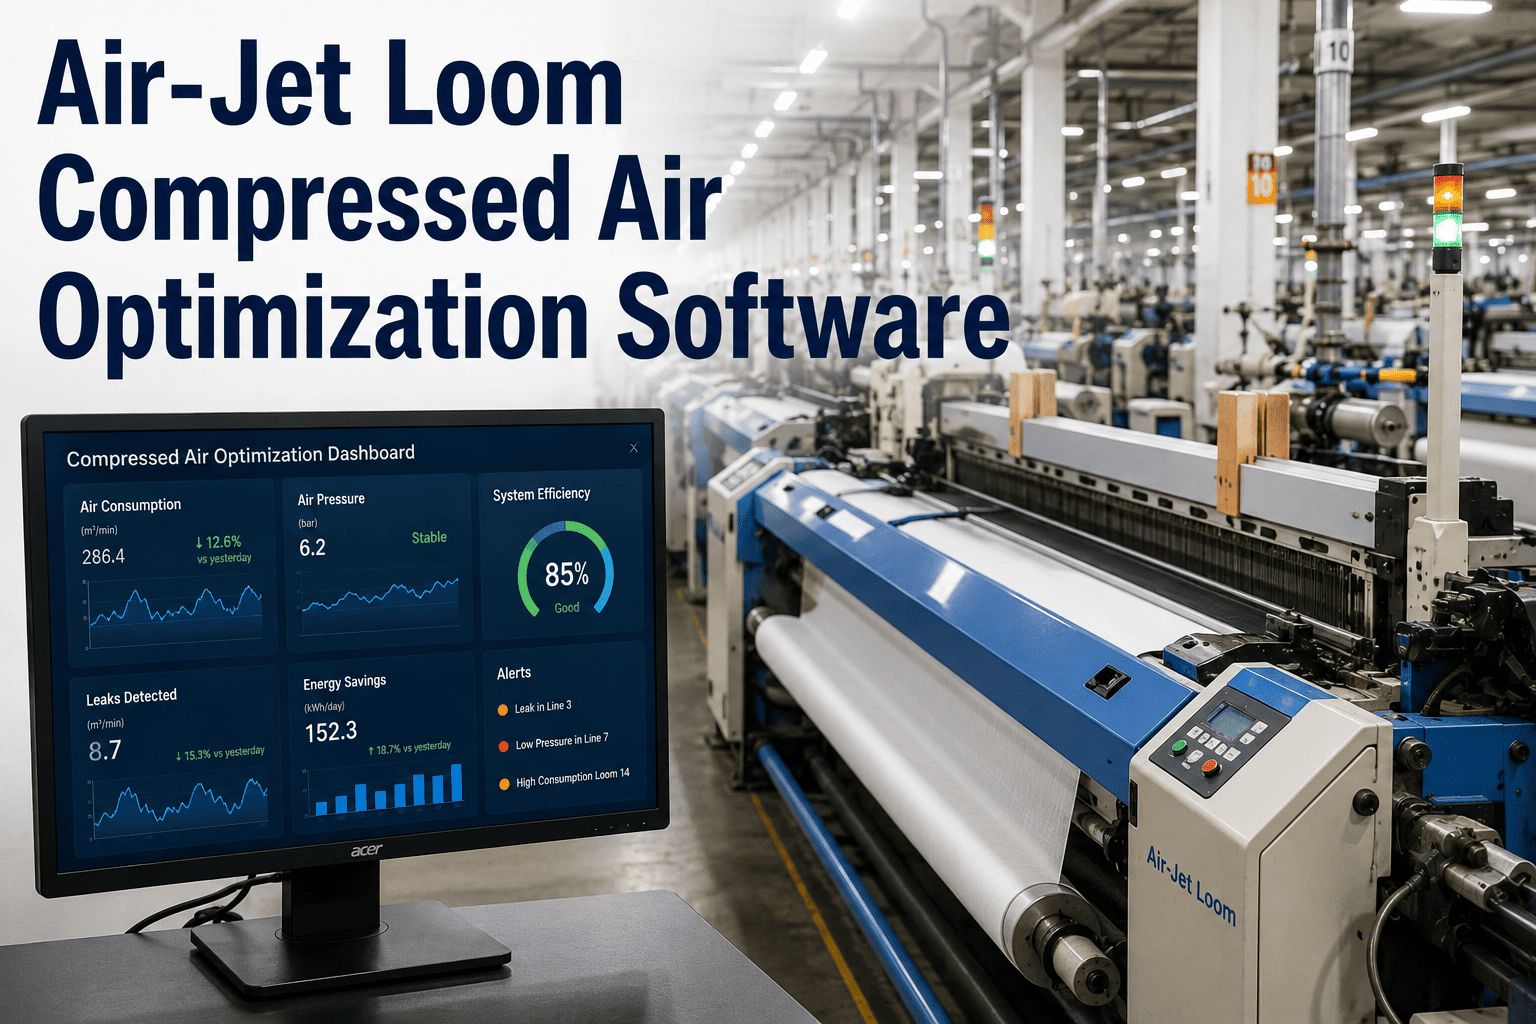
iFactory Compressed Air Monitoring connects ultrasonic sensors, flow meters, and compressor PLCs into a single dashboard that detects new leaks within hours — not months.
What Each Leak Costs Your Mill per Year
The table below maps leak orifice diameter to compressed air loss at typical textile mill operating pressure. The annual cost assumes $0.12 per kWh and 8,000 operating hours per year — standard for three-shift textile operations. Most mills operate between 15 and 40 detectable leaks at any given time.
| Orifice Diameter | CFM Loss at 7 Bar | kW Equivalent | Annual Cost per Leak | Textile Mill Prevalence |
|---|---|---|---|---|
| 1 mm | 2.8 CFM | 0.6 kW | $580 | Very common |
| 2 mm | 11.0 CFM | 2.3 kW | $2,200 | Common |
| 3 mm | 25.0 CFM | 5.2 kW | $5,000 | Frequent |
| 4 mm | 44.0 CFM | 9.2 kW | $8,800 | Occasional |
| 5 mm | 69.0 CFM | 14.4 kW | $13,800 | Rare |
Four Ways to Find Compressed Air Leaks in a Mill Environment
Each method balances cost, coverage, accuracy, and whether production must stop. The right approach depends on mill size, criticality of air supply, and whether the goal is a one-time audit or continuous leak management.
Listen During Off-Hours
Shut down production equipment, keep compressors pressurized, and walk the pipe network.
Only catches large leaks audible above ambient noise. Ineffective in open-end spinning or weaving sheds where residual machine noise masks smaller orifices. No quantification capability.
Soapy Water Spray
Apply diluted soap solution to fittings, couplings, and suspect joints. Bubbles indicate leak location.
Labor-intensive and impractical for overhead pipe runs common in textile mills. Not suitable near electrical panels. No quantification. Typically finds only visible, accessible leaks.
Ultrasonic Detection
Handheld or camera-based detectors convert inaudible 38-42 kHz leak frequencies into audible signals and visual heat maps.
Detects leaks up to 20 feet away in noisy production environments. Quantifies dB level for cost estimation. Typical survey finds 25-40 leaks per shift in a mid-size textile mill. Payback within weeks.
IoT Continuous Monitoring
Fixed flow meters, pressure sensors, and ultrasonic transducers feed real-time data to an analytics platform.
Detects new leaks within hours of formation. Tracks leakage rate as a live KPI. Sends automated alerts when consumption deviates from baseline. Integrates with CMMS for automated work order generation. Achieves under 5% sustained leakage rate.
Go Beyond Annual Audits to Continuous Leak Management
iFactory's IoT-based air monitoring catches leaks within hours, not months. Real-time flow data, automated alerts, and repair verification keep your leakage rate below 5% year-round.
Six-Month Path to Under 5% Sustained Leakage
The facilities that achieve and maintain single-digit leakage rates follow a phased approach. Jumping straight to repair without measurement baseline and ongoing monitoring produces short-term gains that erode within months as new leaks develop.
System Mapping & Measurement
Install temporary or permanent flow meters on main headers and key branches. Establish baseline consumption during production and idle periods. Document compressor configuration, pressure setpoints, and distribution network layout.
Full Facility Leak Survey
Conduct ultrasonic scan of every accessible fitting, valve, coupling, hose, and connection across spinning, weaving, and finishing departments. Tag, photograph, and log each leak with dB level and estimated CFM loss. Prioritize by annual cost.
High-Impact Repair Cycle
Repair all leaks above 2 mm equivalent diameter — typically the top 30% of leaks by count that account for 70% of total CFM loss. Confirm each repair with verification scan. Record post-repair consumption baseline.
Continuous Monitoring Deployment
Deploy fixed sensors at critical nodes. Configure threshold-based alerts for flow deviation, pressure drop, and overnight consumption anomalies. Integrate with existing CMMS for auto-generated repair work orders.
Pressure Optimization & Culture
Reduce system pressure in 1-psi increments while monitoring endpoint performance — each 2 psi reduction saves 1% energy. Establish daily leakage rate KPI visible on production dashboards. Train shift teams on leak reporting protocol.
What Facilities Achieve With Structured Leak Management
Published case studies from textile and industrial facilities that deployed ultrasonic detection and continuous monitoring programs show consistent, verifiable outcomes across multiple operating contexts.
A food processing plant using quarterly ultrasonic routes and an acoustic imaging camera achieved $160,572 in cumulative cost avoidance over four years, with average savings of $40,134 annually.
An automotive components manufacturer reduced total compressed air consumption by 30% within 90 days of deploying continuous flow monitoring combined with a structured leak survey and repair cycle.
A pharmaceutical facility that upgraded from manual ultrasonic to acoustic imaging camera increased leak discovery rate by over 400%, finding 26 leaks in a single one-hour survey worth $27,000 in annual savings.
Frequently Asked Questions
How much compressed air does a typical textile mill waste through leaks?
Industry data consistently shows 20-30% of total compressor output is lost to leaks in facilities without active leak management programs. Textile mills with extensive air-jet weaving operations, ring spinning traveler systems, and pneumatic controls typically land at the higher end of this range. iFactory's baseline assessments on textile mills have documented leak rates as high as 38% in facilities that had never conducted a systematic leak survey.
What is the payback period for a compressed air leak detection system?
Facilities deploying iFactory Compressed Air Monitoring typically achieve full payback within 8-14 months. The quick wins — identifying and repairing the largest 10-15 leaks that account for 60-70% of total CFM loss — usually cover the monitoring infrastructure cost within the first 90 days. Ongoing leak detection maintains the gains and prevents the gradual creep back to baseline leakage rates.
How does iFactory detect new leaks without dedicated ultrasonic hardware?
iFactory analyzes flow rate, pressure decay, and compressor duty cycle patterns to detect when consumption deviates from established baselines. A sudden increase in overnight flow — when most production equipment is off — signals new leak formation before it shows up on a monthly utility bill. The platform integrates with existing ultrasonic detectors, flow meters, and compressor PLCs. For facilities that want continuous ultrasonic coverage, we support integration with fixed acoustic sensors that scan key zones automatically.
Can leak detection be done without shutting down production?
Yes. Ultrasonic detection works while the system is fully pressurized and production is running. The detector filters out ambient machine noise and isolates the ultrasonic frequency range of escaping air. Acoustic imaging cameras add visual overlay so technicians see the leak location superimposed on a real-time image. The only situation requiring partial shutdown is repair of leaks in pressurized lines, which can be scheduled during planned maintenance windows.
What is a realistic leakage rate target for a well-managed textile mill?
Facilities with active continuous monitoring and a structured repair program consistently achieve and sustain under 5% total system leakage. This requires quarterly ultrasonic surveys to catch new leaks, real-time flow monitoring to detect deviation, and a maintenance workflow that prioritizes leaks by annual cost. Facilities relying solely on annual audits typically drift back to 15-20% leakage within 12-18 months as new leaks develop from vibration, thermal cycling, and connection wear.
See Every Cubic Meter of Compressed Air Your Mill Produces
iFactory maps compressor output, distribution losses, and end-use consumption into a single operations view. Detect leaks, verify repairs, and track leakage rate as a live KPI — all from one dashboard deployed in weeks, not months.