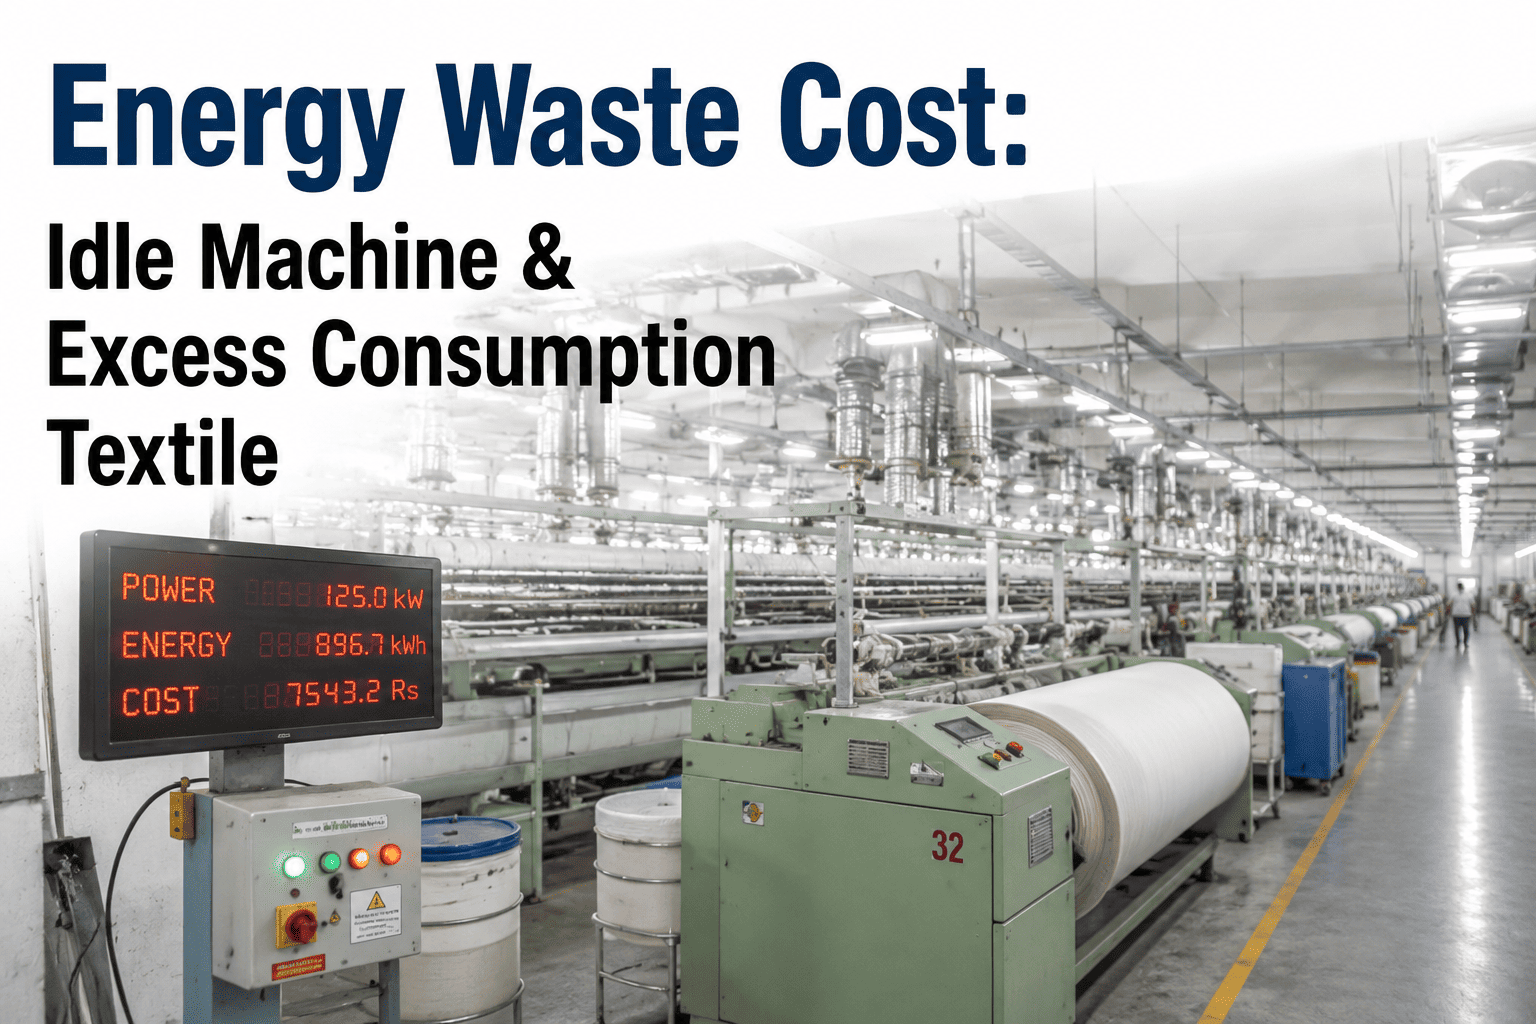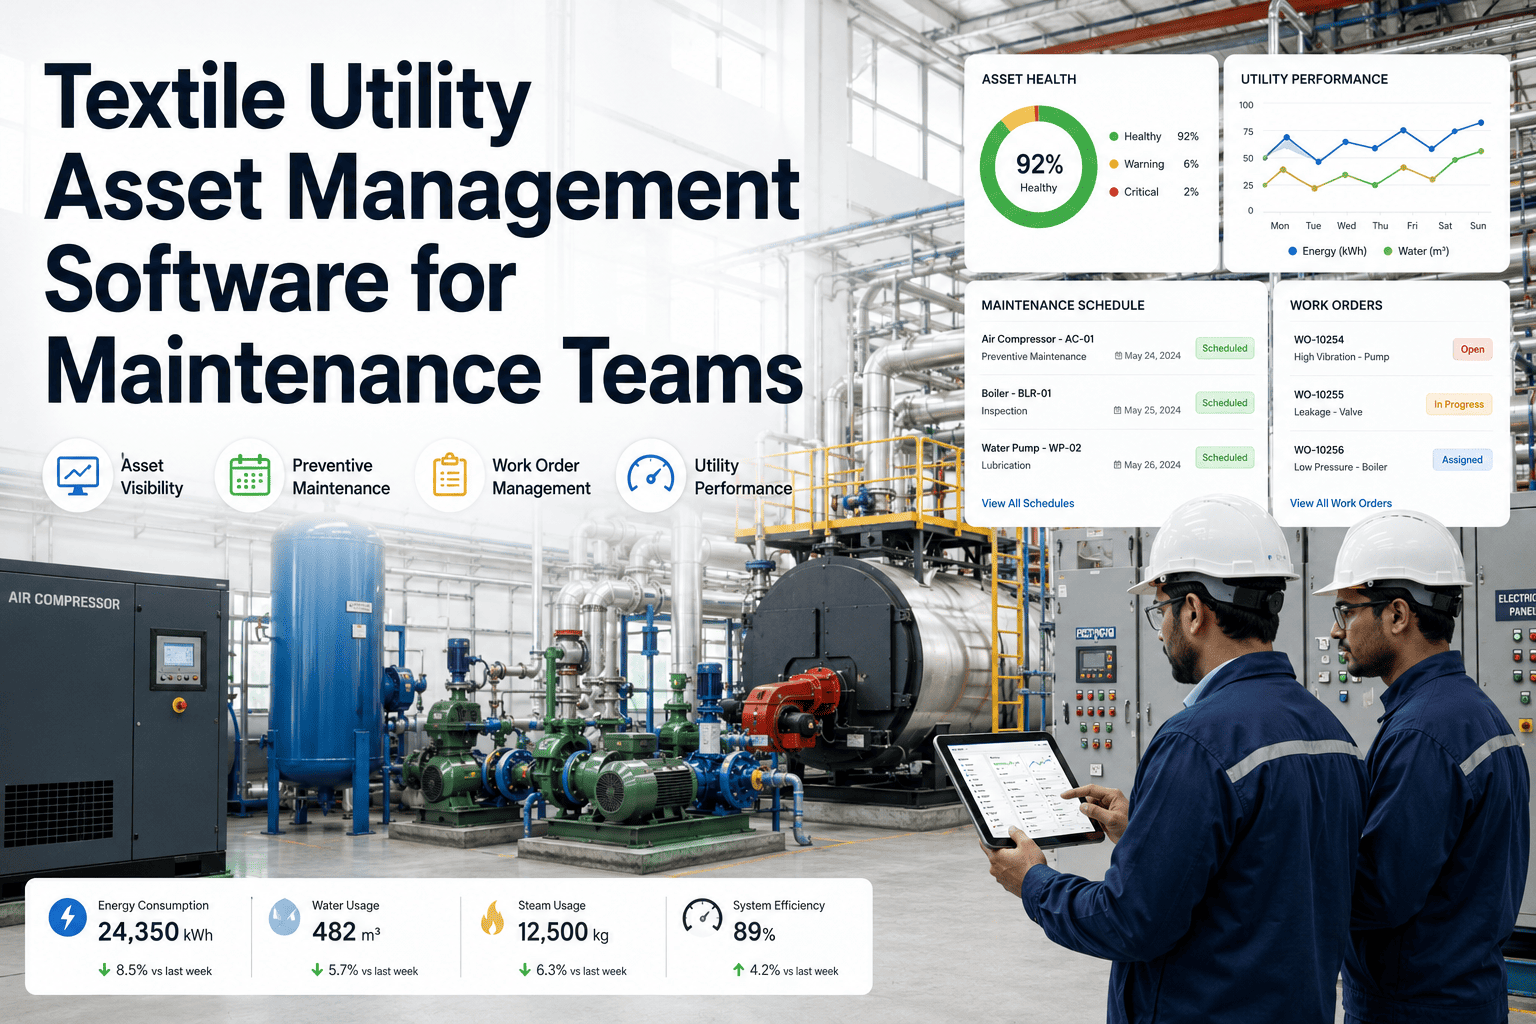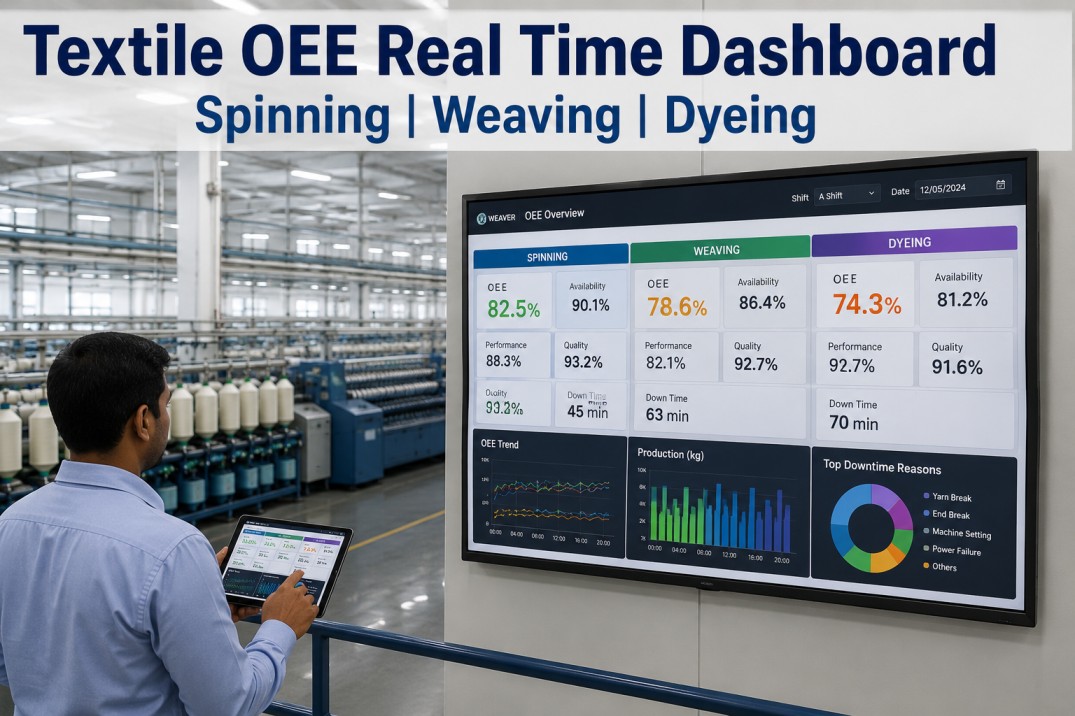
In textile manufacturing, compressed air is a critical yet often overlooked utility that drives pneumatic controls, spinning machines, weaving looms, and auxiliary equipment across the mill floor. However, up to 30% of generated compressed air is lost through undetected leaks, inefficient demand patterns, and pressure drops that silently erode profitability. For plant managers, maintenance directors, and CTOs overseeing spinning, weaving, and utility operations, the lack of granular visibility into compressed air usage translates directly into inflated energy bills, unplanned downtime, and compromised production quality. This comprehensive guide delves into the technical intricacies of compressed air leak detection, abnormal demand analysis, and cost-by-area analytics tailored specifically for textile mills. By leveraging real-time monitoring, AI-driven anomaly detection, and actionable dashboards, enterprises can reclaim lost efficiency and achieve measurable sustainability gains. Book a Demo to see how iFactory transforms your utility data into profit.
Uncover Hidden Losses in Your Compressed Air Network
Real-time leak detection, demand profiling, and cost allocation across every production zone.
Leak Detection Precision
Identify leaks down to 0.1 CFM with ultrasonic sensors and AI pattern recognition. Reduce energy waste by up to 25% within weeks.
Demand Profiling
Analyze consumption trends per shift, machine type, and product line. Eliminate artificial demand from open blowing or idle equipment.
Cost-by-Area Analytics
Allocate compressed air cost to specific departments, cost centers, or even individual machines. Drive accountability and targeted savings.
The True Cost of Compressed Air Leaks in Textile Mills
Compressed air is one of the most expensive utilities in a textile plant, often representing 10-15% of total energy consumption. A single 3mm leak at 7 bar pressure can waste over $1,500 per year in electricity costs. In a typical mill with hundreds of fittings, valves, and connections, cumulative losses can exceed $100,000 annually. Beyond direct energy waste, leaks cause pressure fluctuations that degrade product quality—inconsistent yarn tension in spinning, uneven fabric formation in weaving, and erratic pneumatic actuator performance. Traditional manual leak detection using soapy water or handheld ultrasonic detectors is labor-intensive, intermittent, and fails to capture transient leaks that occur during production peaks. iFactory's continuous monitoring solution deploys networked ultrasonic sensors at strategic points across the compressed air network, feeding data into an AI engine that learns baseline patterns and flags deviations in real time. This enables maintenance teams to prioritize repairs based on leak severity, location, and energy cost impact, transforming reactive maintenance into a proactive, data-driven strategy.
Five-Step Implementation for Compressed Air Optimization
Sensor Deployment
Install ultrasonic flow meters and pressure transducers at main headers, branch lines, and critical consumption points. Calibrate for textile-specific humidity and dust conditions.
Baseline Creation
Collect 14 days of continuous data to establish normal operating envelopes for pressure, flow, and demand patterns across shifts and production seasons.
Anomaly Detection
Deploy AI models that detect deviations from baseline, including leak signatures, sudden demand spikes, and gradual pressure degradation indicating system wear.
Cost Allocation
Map compressed air consumption to specific cost centers using production schedules and machine-level data. Generate hourly, daily, and monthly cost reports per area.
Continuous Optimization
Use dashboard insights to adjust compressor sequencing, reduce system pressure, schedule proactive maintenance, and validate savings from interventions.
Spinning Zone
Roving frames, ring spinning, and open-end machines consume 60-70% of mill air. Monitor per-machine CFM to detect leaking valves, worn seals, or improper settings.
Weaving Zone
Air-jet looms require precise pressure for weft insertion. Pressure drops below 6 bar cause defects and slowdowns. Real-time alerts prevent quality losses.
Utility Zone
Compressors, dryers, filters, and receivers. Track overall system efficiency, dew point, and filter loading. Optimize compressor sequencing for minimum energy use.
Transform Your Utility Data into Profit
Stop losing money to invisible leaks. Gain real-time visibility and control over your compressed air network with iFactory.
Compressed Air Leak Severity Classification
| Leak Size | CFM Loss at 7 bar | Annual Cost (USD) | Detection Method | Repair Priority |
|---|---|---|---|---|
| Pinpoint (0.5 mm) | 0.5 | $250 | Ultrasonic sensor | Low |
| Small (1 mm) | 2.0 | $1,000 | Ultrasonic / Soap test | Medium |
| Medium (3 mm) | 6.5 | $1,500 | Audible hiss / Sensor | High |
| Large (5 mm) | 18.0 | $4,500 | Visible / Sensor | Critical |
| Major (10 mm) | 72.0 | $18,000 | Obvious / Sensor | Immediate |
Real-Time Dashboard
Visualize flow, pressure, and cost metrics on a single pane of glass. Drill down to machine level with historical trends and anomaly timelines.
Automated Alerts
Receive SMS, email, or in-app notifications when a leak is detected or when demand exceeds thresholds. Reduce response time from days to minutes.
Cost-by-Area Reports
Generate automated reports that allocate compressed air cost to spinning, weaving, finishing, and utilities. Enable chargebacks and drive energy reduction initiatives.
Case Study: 22% Energy Reduction in a 50,000 Spindle Mill
A leading textile manufacturer in India deployed iFactory's compressed air monitoring across their spinning and weaving units. Within 90 days, they identified 47 leaks totaling 85 CFM, reduced system pressure from 7.5 to 6.8 bar, and optimized compressor sequencing. Annual energy savings exceeded $120,000, with a payback period of less than 6 months. The plant achieved a 22% reduction in compressed air energy consumption and improved yarn strength consistency by 8% due to stabilized pressure.
Frequently Asked Questions
How does iFactory detect compressed air leaks in a textile mill?
iFactory deploys a network of ultrasonic flow sensors and pressure transducers at strategic points across the compressed air system. These sensors continuously measure flow rate, pressure, and temperature, transmitting data to a cloud-based AI engine. The AI models learn the normal operating patterns for each sensor location and time of day. When a deviation occurs—such as a sudden increase in flow without a corresponding production event—the system flags it as a potential leak. The dashboard shows the exact location, leak magnitude in CFM, and estimated energy cost. Maintenance teams receive instant alerts and can prioritize repairs based on severity. This method detects leaks as small as 0.1 CFM, far beyond human hearing or manual inspection. Book a Demo to see it in action.
What is cost-by-area analytics and how does it benefit my textile plant?
Cost-by-area analytics is a feature that allocates compressed air consumption to specific production zones, cost centers, or even individual machines. By integrating with your production schedules and machine states, iFactory calculates the exact cost of compressed air used in spinning, weaving, finishing, and utilities. This granularity enables you to identify which areas are over-consuming, set energy budgets, and drive accountability. For example, if weaving looms are consuming 40% more air than baseline due to worn seals, the cost is directly attributed to that department. Managers can then implement targeted reduction measures and track savings over time. This approach typically uncovers 10-15% additional savings beyond leak repairs alone. Contact Support for more details.
Can iFactory integrate with existing compressor controls and SCADA systems?
Yes, iFactory is designed for seamless integration with a wide range of industrial protocols including Modbus, OPC-UA, MQTT, and BACnet. It can read data directly from compressor controllers, PLCs, and SCADA systems without requiring additional hardware. The platform also supports API-based integration with ERP and MES systems for automated cost allocation. Our deployment team works with your existing infrastructure to ensure minimal disruption. In most cases, integration is completed within 2-4 weeks. The result is a unified view of compressed air performance alongside other utility metrics like electricity, water, and steam. Book a Demo to discuss your specific setup.
What ROI can I expect from implementing compressed air leak detection?
Typical ROI from iFactory's compressed air leak detection and analytics solution ranges from 6 to 12 months, depending on the size of the mill and current leak levels. Many customers achieve 15-30% reduction in compressed air energy costs within the first year. For example, a mid-sized textile mill spending $500,000 annually on compressed air energy can save $75,000-$150,000 per year. Additional savings come from reduced maintenance costs, fewer unplanned downtime events, and improved product quality. The system also helps extend compressor life by optimizing runtime and reducing wear. Our customers consistently report that the solution pays for itself within the first year. Contact Support for a custom ROI analysis.
How does iFactory handle pressure fluctuations and abnormal demand events?
iFactory continuously monitors pressure at multiple points in the network and correlates it with flow data. When a pressure drop occurs, the system analyzes whether it is due to increased demand from production, a leak, or a compressor failure. The AI engine distinguishes between normal demand spikes (e.g., shift startup) and abnormal events (e.g., a sudden 20% flow increase with no production change). For abnormal events, an alert is sent immediately with the likely cause and location. The dashboard also provides historical pressure profiles to help optimize setpoints and compressor sequencing. By stabilizing pressure, you reduce energy consumption and improve product consistency. Book a Demo to see how it works in real time.
Ready to Stop Paying for Leaks?
Start your journey to compressed air efficiency with iFactory. Real-time visibility, AI-driven insights, and measurable savings.