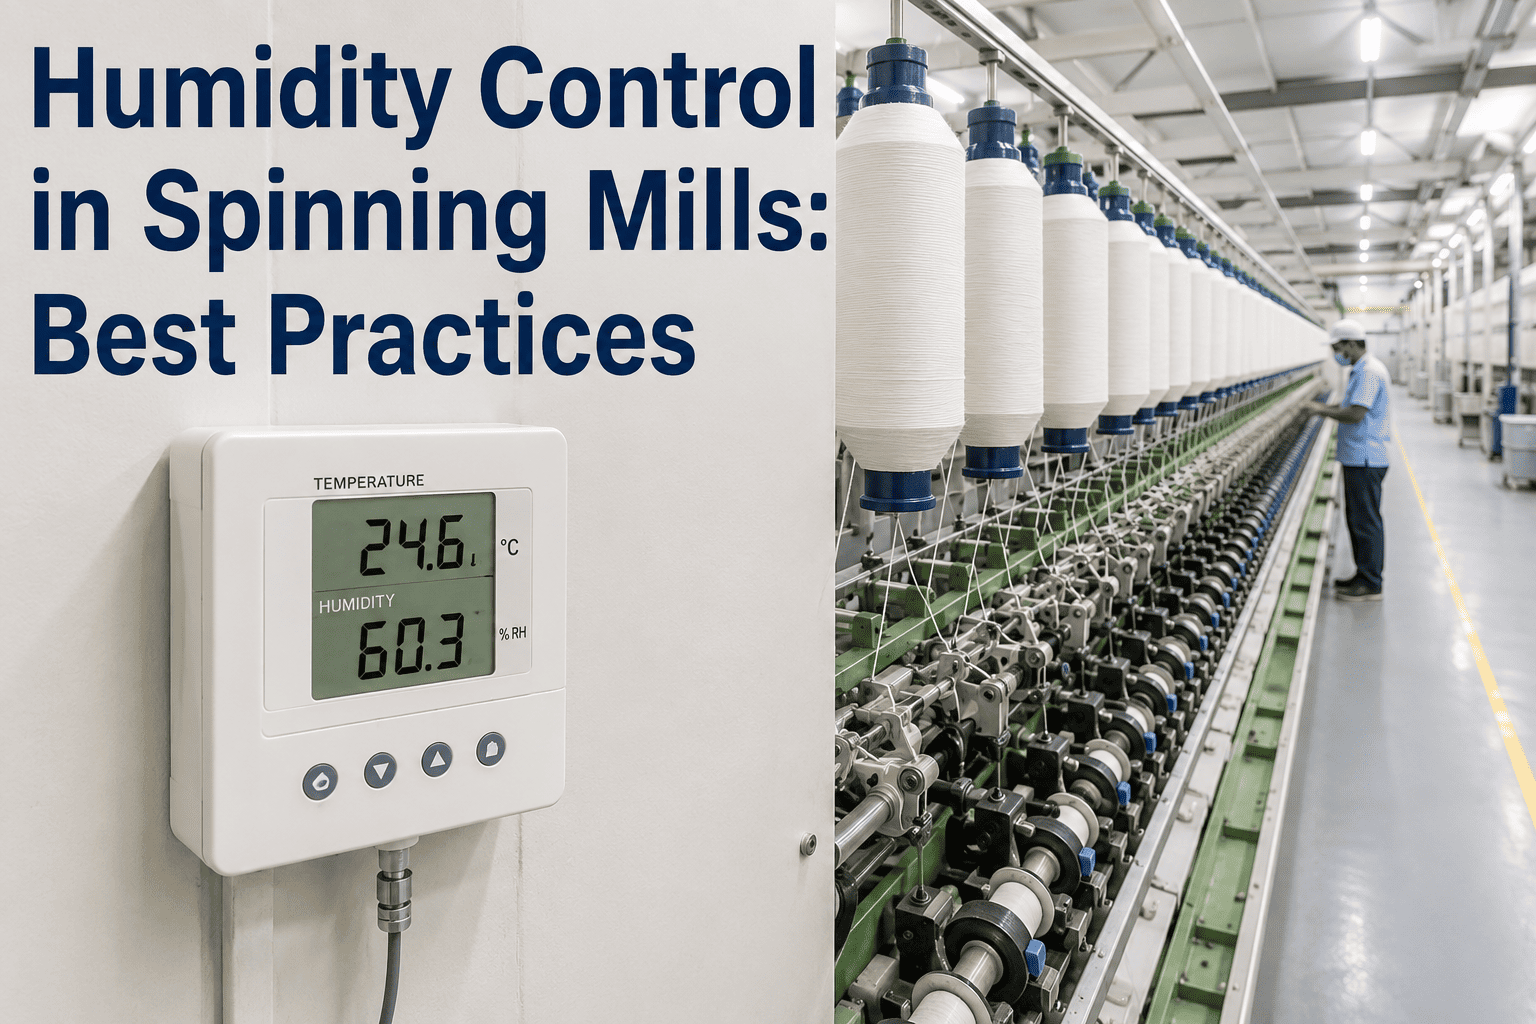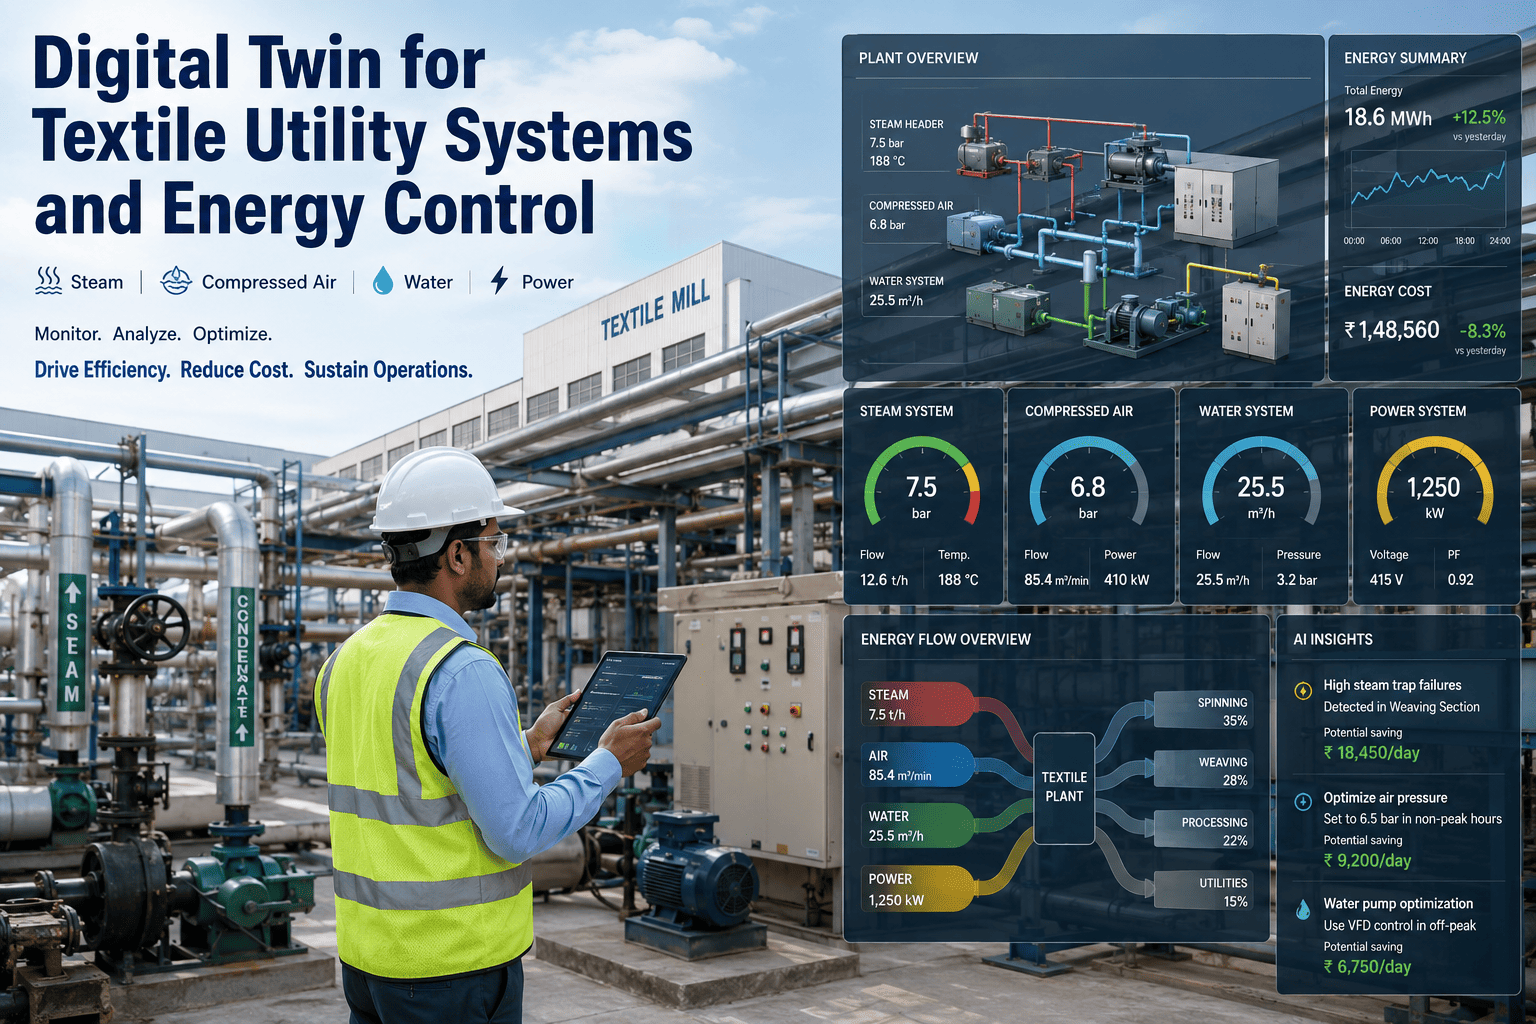
A ring-frame spinning hall that drifts even two degrees above its set humidity band starts throwing yarn breaks within the hour, and a dye house chiller that trips during a batch can turn an entire lot into seconds-quality fabric. Textile manufacturing is one of the few industries where the HVAC and chilling plant is not a comfort system — it is a production input, as critical as the fibre itself, because moisture regain, yarn elasticity and dye uptake all move with temperature and relative humidity. Yet most mills still run chillers, humidification plants and air-handling units on fixed setpoints and manual logbooks, burning enormous electricity to chase stability they never quite reach. AI-driven energy optimization changes that equation by continuously balancing utility load against real-time process tolerance, and if your utility bills keep climbing while quality claims keep arriving, Book a Demo to see how iFactory ties energy and quality together on one screen.
Hold Temperature and Humidity Steady Without Overpaying for It
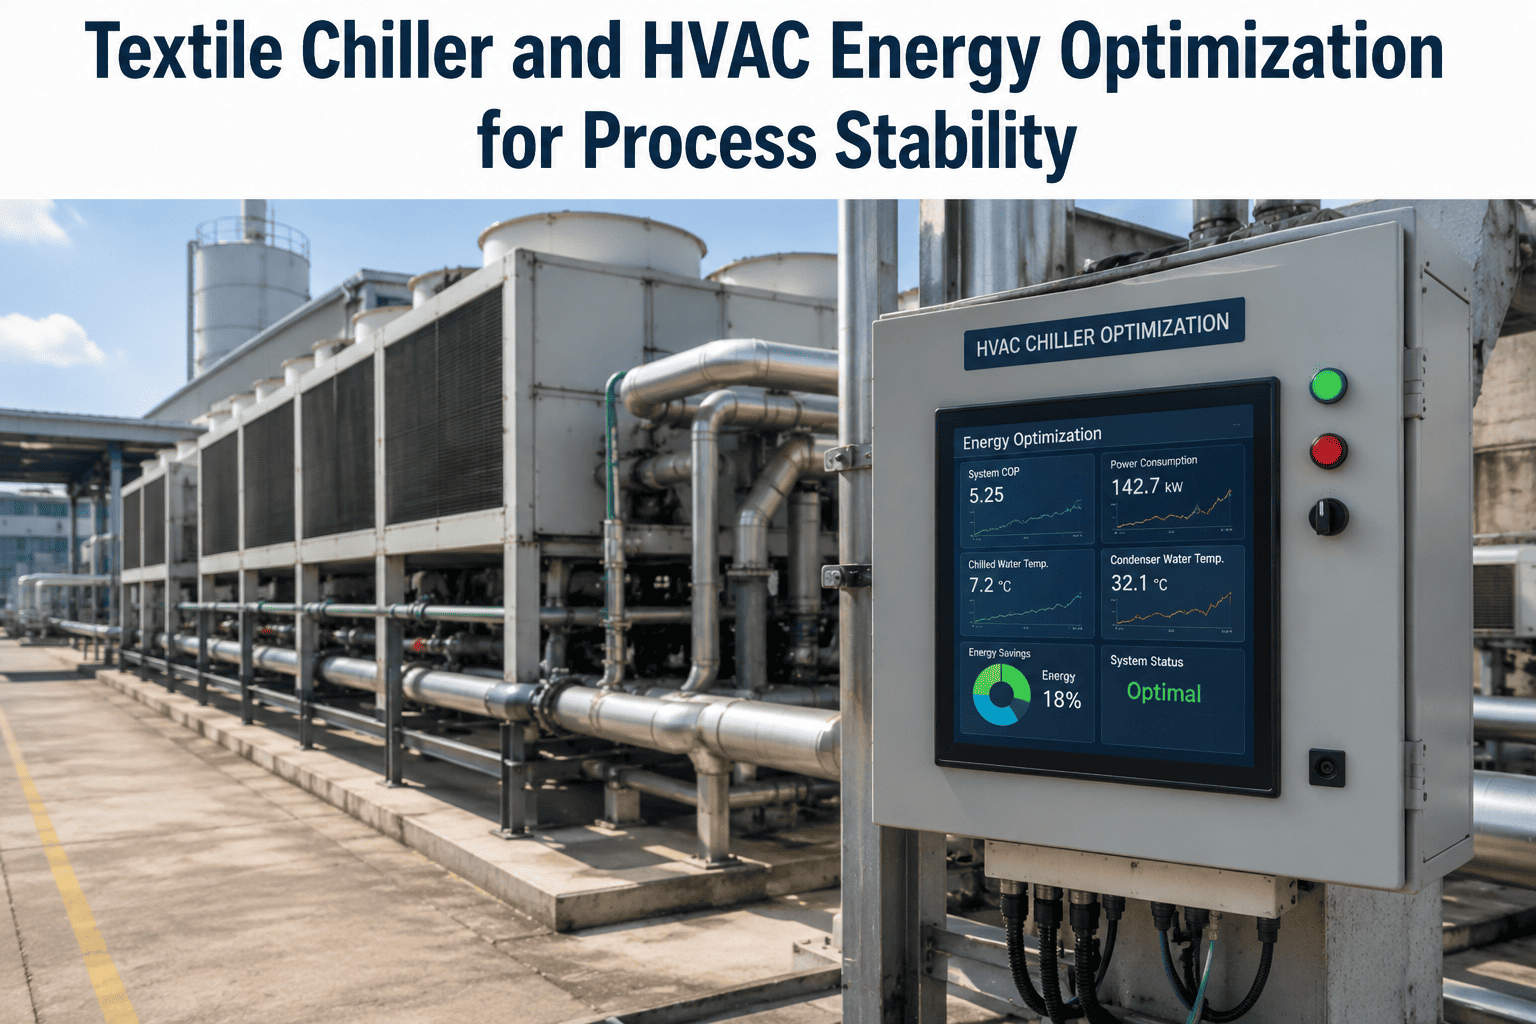
iFactory's Energy Optimization AI watches chillers, humidification plants and HVAC load against live process tolerance bands, trimming waste while protecting the conditions your yarn and fabric actually need.
Why Textile Utility Plants Waste So Much Energy
Chillers and humidification plants in a typical mill are sized for worst-case summer load and then run near that ceiling year-round, because nobody wants to risk a humidity excursion during a critical spinning or weaving shift. That conservative habit is understandable and expensive. Compressors cycle harder than the actual moisture load requires, cooling towers run at fixed speed regardless of ambient wet-bulb temperature, and steam or ultrasonic humidification stays on well past the point the hall has reached target regain.
The deeper problem is that energy decisions and quality decisions are made by different people looking at different data. The utility engineer watches power draw and chiller tonnage; the spinning or weaving in-charge watches breakage rates and moisture regain on a separate paper log. Nobody is looking at both together in real time, so the plant defaults to running everything harder than needed, all the time, just in case.
How AI-Driven Energy Optimization Works on the Shop Floor
iFactory's Energy Optimization AI does not simply chase the lowest possible power draw — that approach is dangerous in a textile plant, because a chiller running too lean can let humidity drift outside the process tolerance band and quietly damage a production lot. Instead, the system treats process stability as the hard constraint and searches for the lowest energy path that stays inside it, department by department and shift by shift.
Temperature, relative humidity, chiller load, condenser water temperature and ambient wet-bulb readings stream continuously from sensors already installed across spinning, weaving and dye house zones.
Live readings are checked against the process tolerance band set for each department — spinning halls, warping rooms and dye houses all carry different acceptable ranges depending on fibre and process stage.
Chiller staging, cooling tower fan speed, pump frequency and humidification cycles are recommended or auto-adjusted to the minimum load that keeps every zone inside its band, ahead of ambient swings.
The model refines itself against actual outcomes — breakage rates, moisture regain readings and rework — so setpoint recommendations keep improving instead of running on a static rulebook.
Because the model is trained on your own plant's seasonal and shift patterns, it anticipates load rather than reacting to it — pre-cooling before a known afternoon humidity spike, for instance, instead of scrambling once the hall has already drifted. Mills that want to see this running against their own utility bills can Book a Demo with a sample of their own consumption data.
Where Energy Optimization Pays Off Fastest
Ring & Rotor Spinning Halls
Humidity control directly affects fibre-to-fibre friction and static, so spinning halls are usually the single largest humidification and cooling load in a mill — and the department with the most to lose from an excursion.
Weaving Preparation
Warping and sizing are sensitive to both temperature and moisture, and inconsistent conditions here show up later as warp breaks on the loom, far from where the root cause actually occurred.
Dye House Chilling
Process water chillers supporting dyeing and finishing cycle hard and often, and even small load-matching improvements compound across dozens of batches a day.
Utility & Boiler Rooms
Compressor staging and cooling tower operation benefit from the same load-matching logic, cutting demand charges without any change to production behaviour.
See Your Own Chiller and HVAC Load Modelled
iFactory can run a no-obligation analysis against your recent utility and humidity logs to show where energy is being spent without buying any additional process stability.
Predictive Maintenance Keeps the Optimization Honest
Energy optimization only holds if the chiller and humidification equipment behind it stays healthy — a fouled condenser or a drifting sensor can quietly force the system to work harder for the same result, eroding savings without anyone noticing until the bill arrives. iFactory layers predictive maintenance signals from compressor vibration, condenser approach temperature and sensor drift on top of the energy model, flagging equipment health issues before they undo the optimization gains. This closes the loop between the two questions every utility manager actually has: is the plant efficient right now, and will it stay that way through the next shift.
Fixed Setpoint Operation
- Runs to worst-case load year-round
- No visibility into quality impact of drift
- Manual logbooks reviewed after the fact
- Compressor wear treated as a separate concern
AI-Optimized Operation
- Matches load to real-time process tolerance
- Links humidity drift directly to quality data
- Continuous monitoring with proactive alerts
- Equipment health feeds directly into the model
Frequently Asked Questions
Will optimizing energy use put yarn or fabric quality at risk?
No — the system is built to treat your process tolerance band as a hard constraint rather than a target to shave. It only reduces chiller and HVAC load within the range your spinning, weaving or dye house teams already consider safe, and it tightens further only when the data shows room to do so. Quality thresholds are set by your own process engineers, not by the algorithm, so nothing changes about what "acceptable" means for your fibre or fabric. You can review the full methodology by visiting Support before rolling it out plant-wide.
How long does it take to see measurable energy savings?
Most mills see an initial reduction in chiller and HVAC power draw within the first four to six weeks, once the model has enough seasonal and shift data to recommend confident setpoint changes. Savings continue to grow over the following quarter as the system learns your specific plant's thermal behaviour, ambient patterns and production schedule. A full utility cycle, typically three to four months, is usually needed to see the complete seasonal picture.
Do we need to replace our existing chillers or sensors?
In most installations, no replacement is required — iFactory connects to the sensors, chiller controllers and BMS points already present in the plant using standard industrial protocols. Where a critical zone lacks adequate humidity or temperature sensing, we recommend a small number of additional sensors rather than a full retrofit. The goal is to layer intelligence onto existing infrastructure, not to force a capital equipment upgrade.
Can this work across multiple departments with different humidity needs?
Yes — spinning, weaving preparation and dye house zones typically carry different process tolerance bands, and the platform is designed to manage each independently rather than applying a single plant-wide setpoint. Every zone gets its own model tuned to its fibre type, process stage and historical quality data, while the underlying utility plant is optimized holistically across all of them together.
How does this connect to our existing maintenance program?
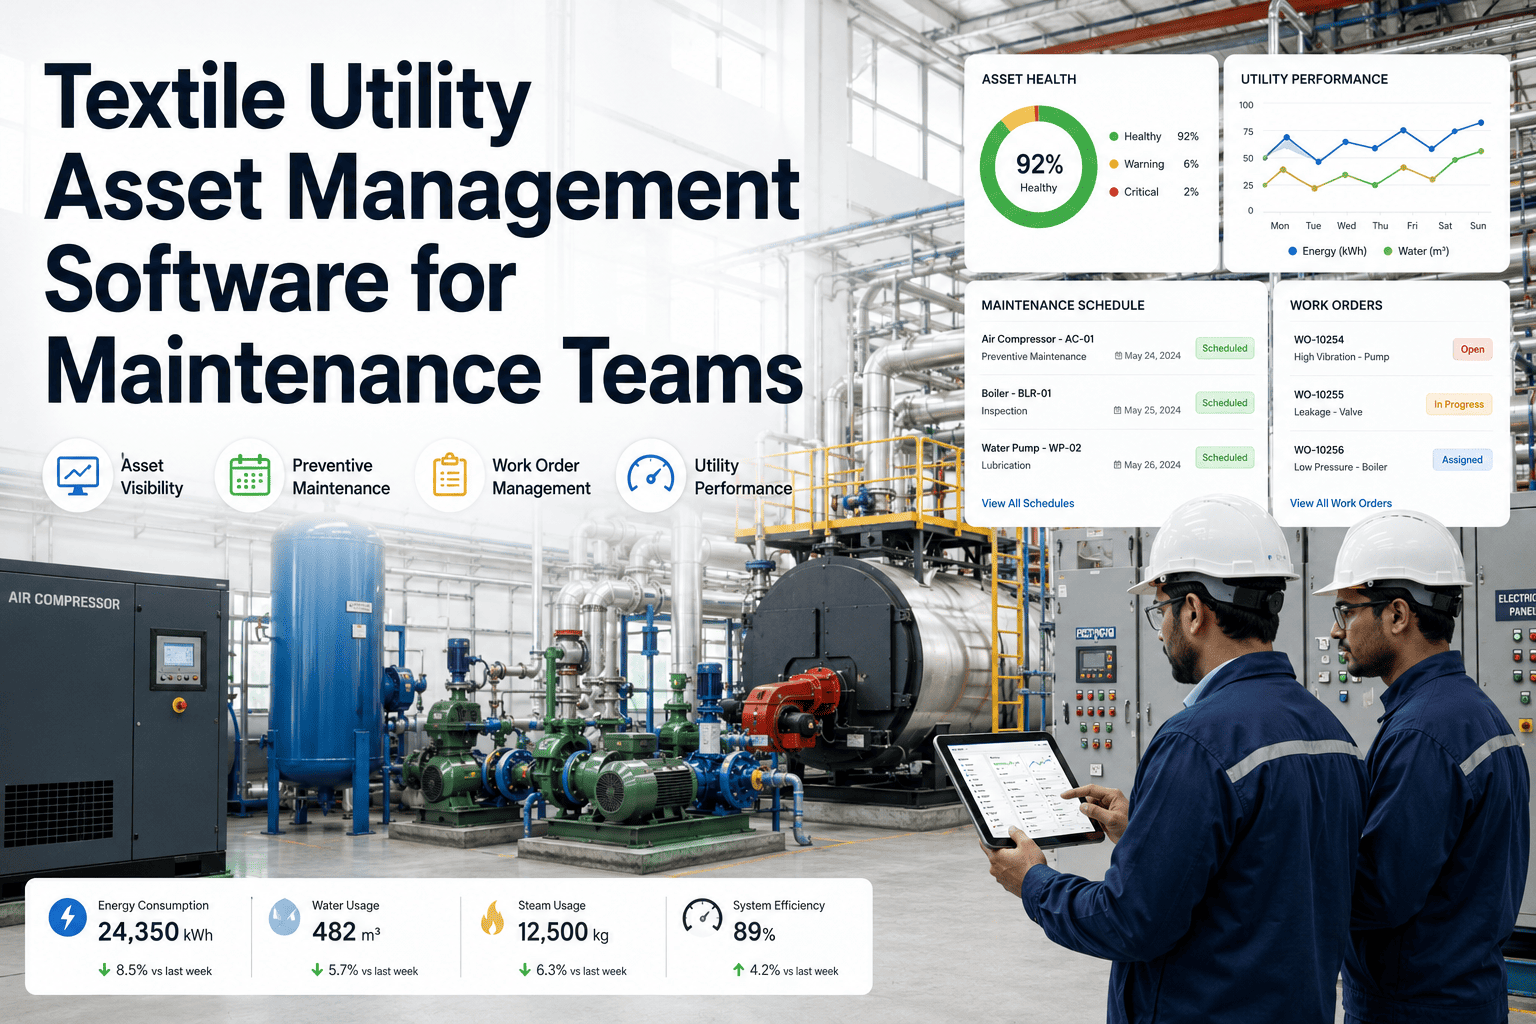
Energy optimization data feeds directly into equipment health monitoring, so compressor wear, condenser fouling and sensor drift are flagged as part of the same system rather than tracked separately. For mills that already use a CMMS or work order platform, this can be integrated so maintenance tasks are generated automatically when equipment health threatens the optimization gains. Reach out through Support to discuss your current maintenance setup.
Bring Energy and Process Stability Onto One Screen
Utility cost and production quality have always been the same problem in a textile mill, just tracked in different places by different teams. iFactory's Energy Optimization AI puts chiller load, humidification cycles, HVAC performance and process tolerance on a single live view, so every setpoint decision is made with both cost and quality in front of the person making it. The result is a plant that spends less on utilities without gambling on the conditions your yarn and fabric depend on.
Ready to See Where Your Utility Budget Is Leaking?
Bring your last three months of chiller and humidity logs — we'll show you exactly where the AI would have trimmed load without touching your quality band.