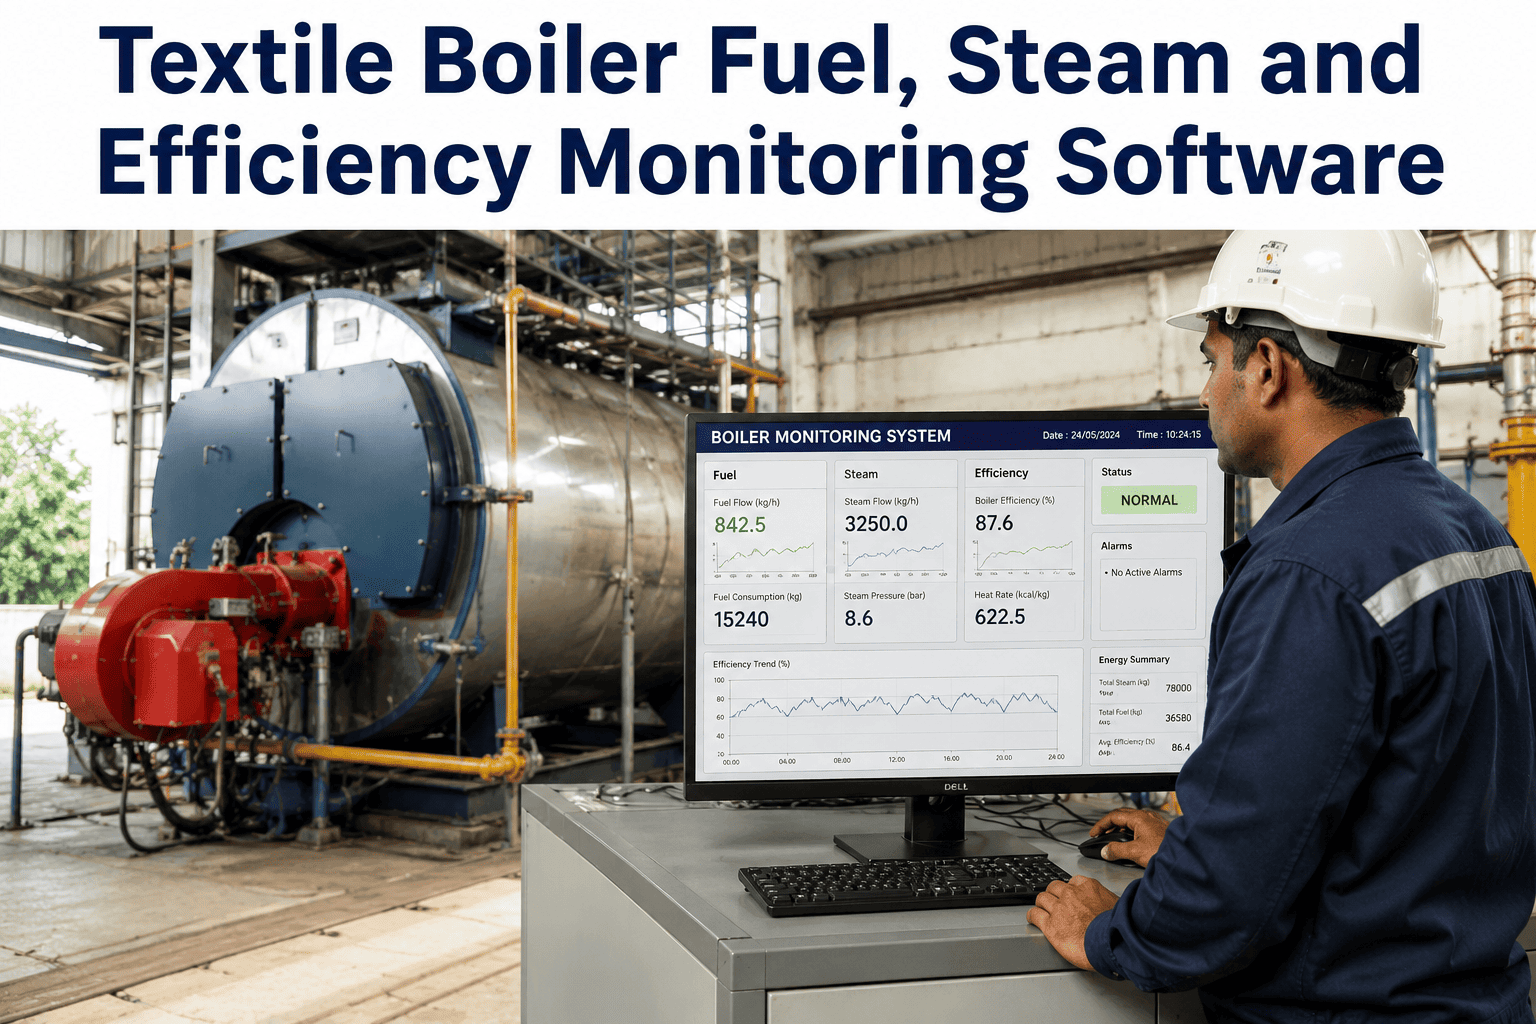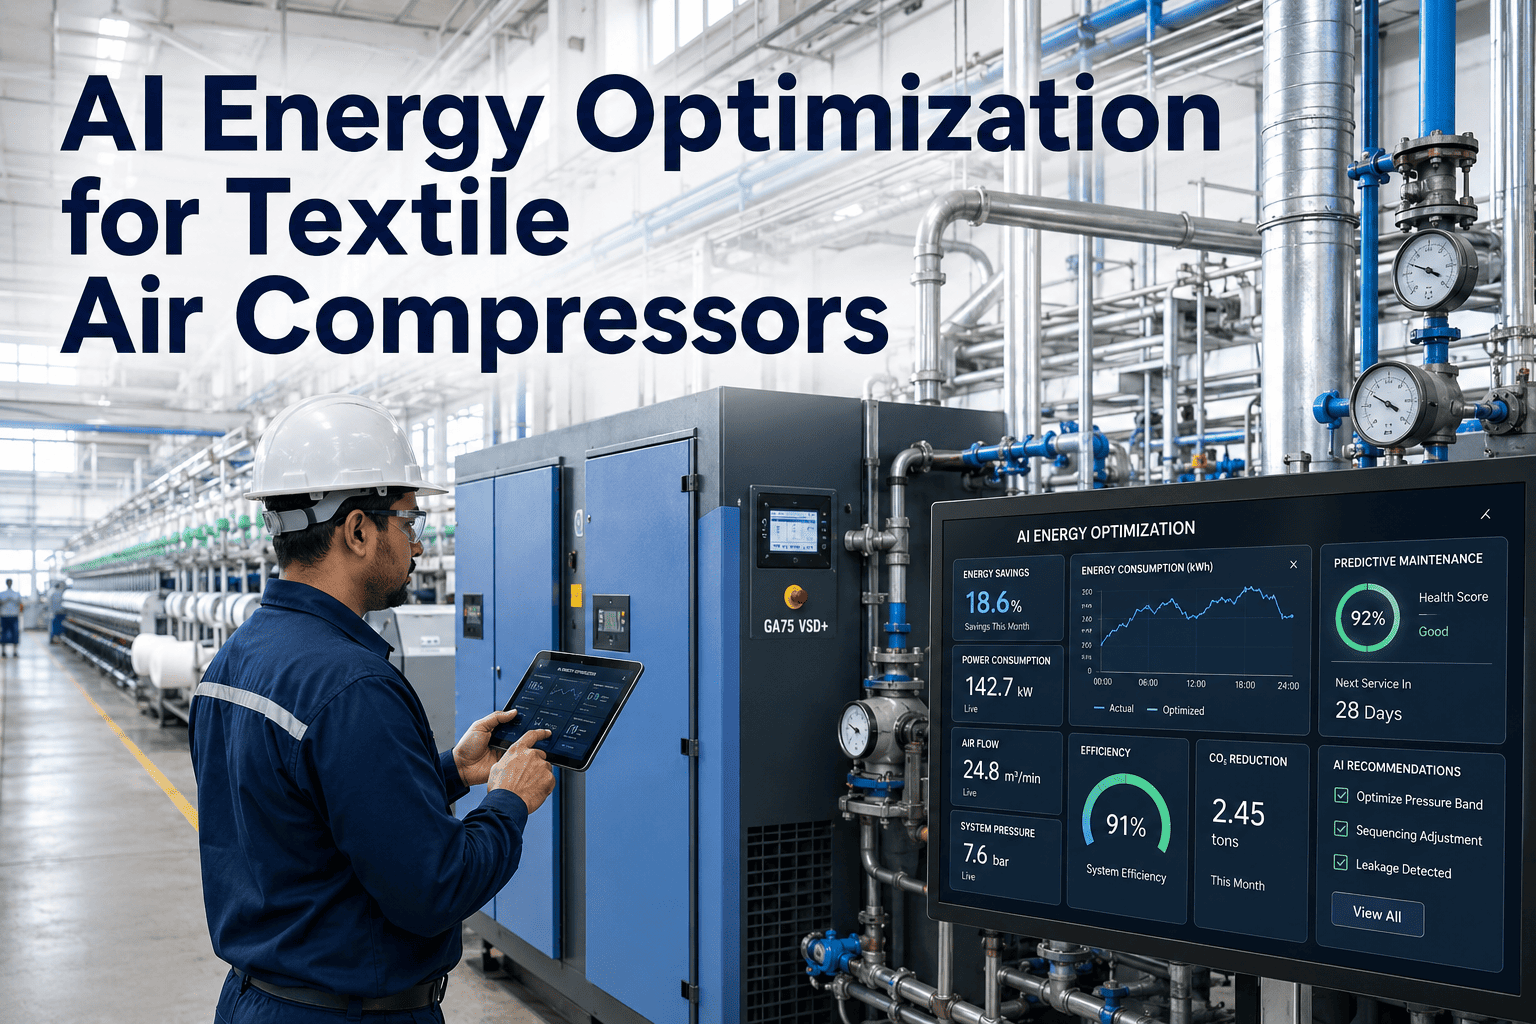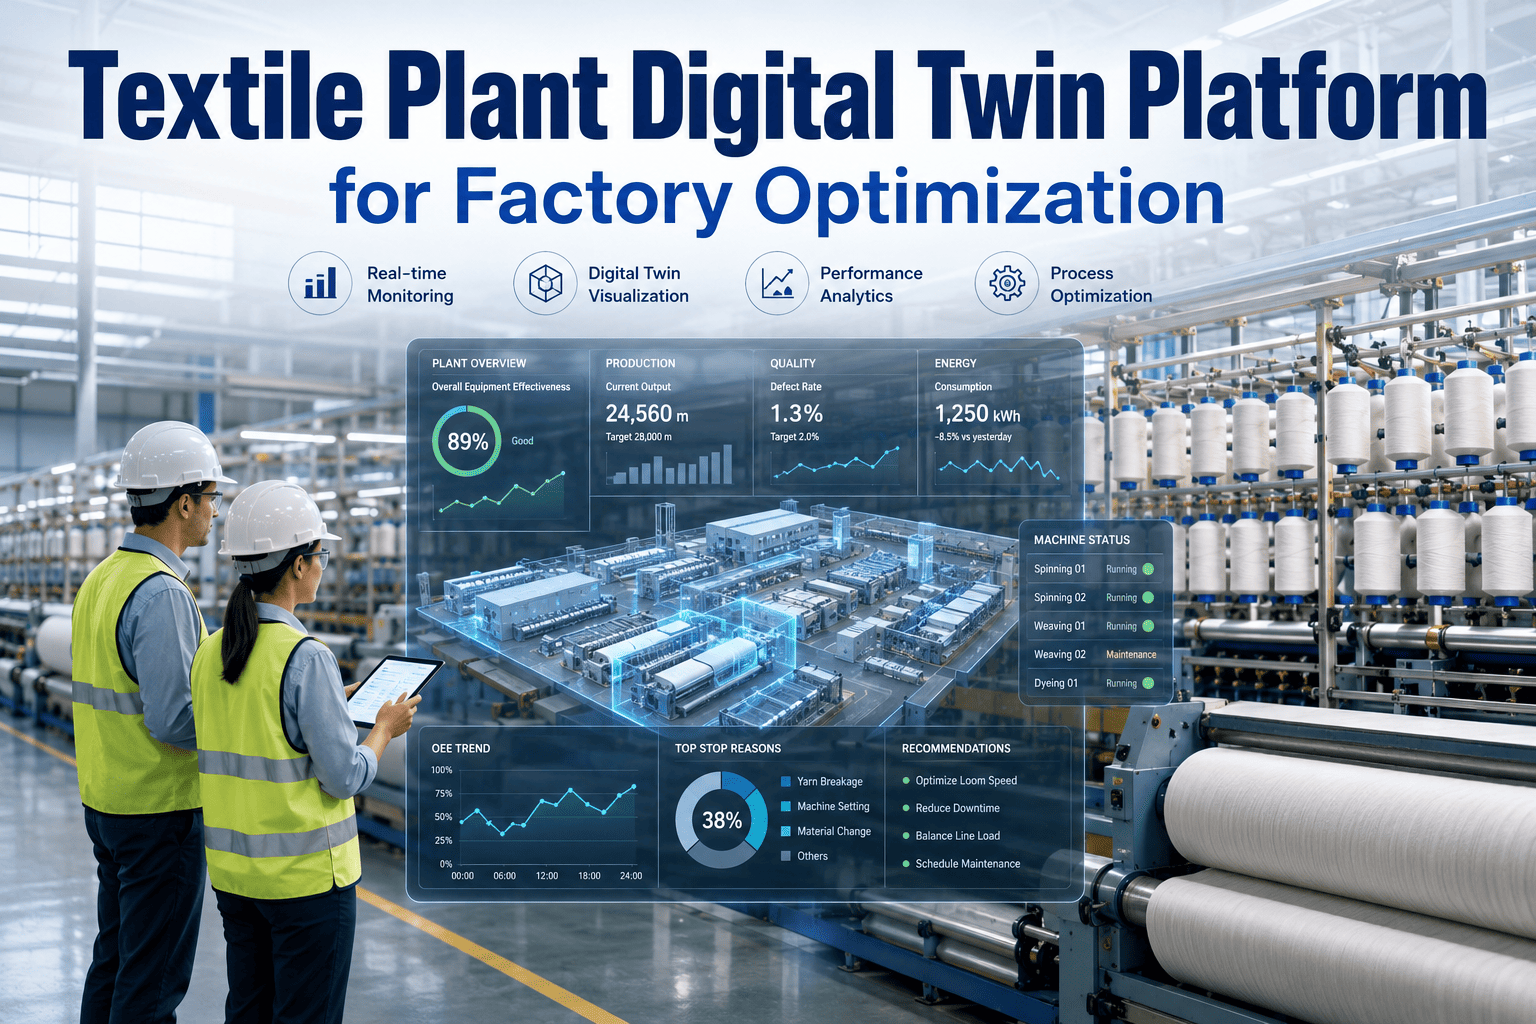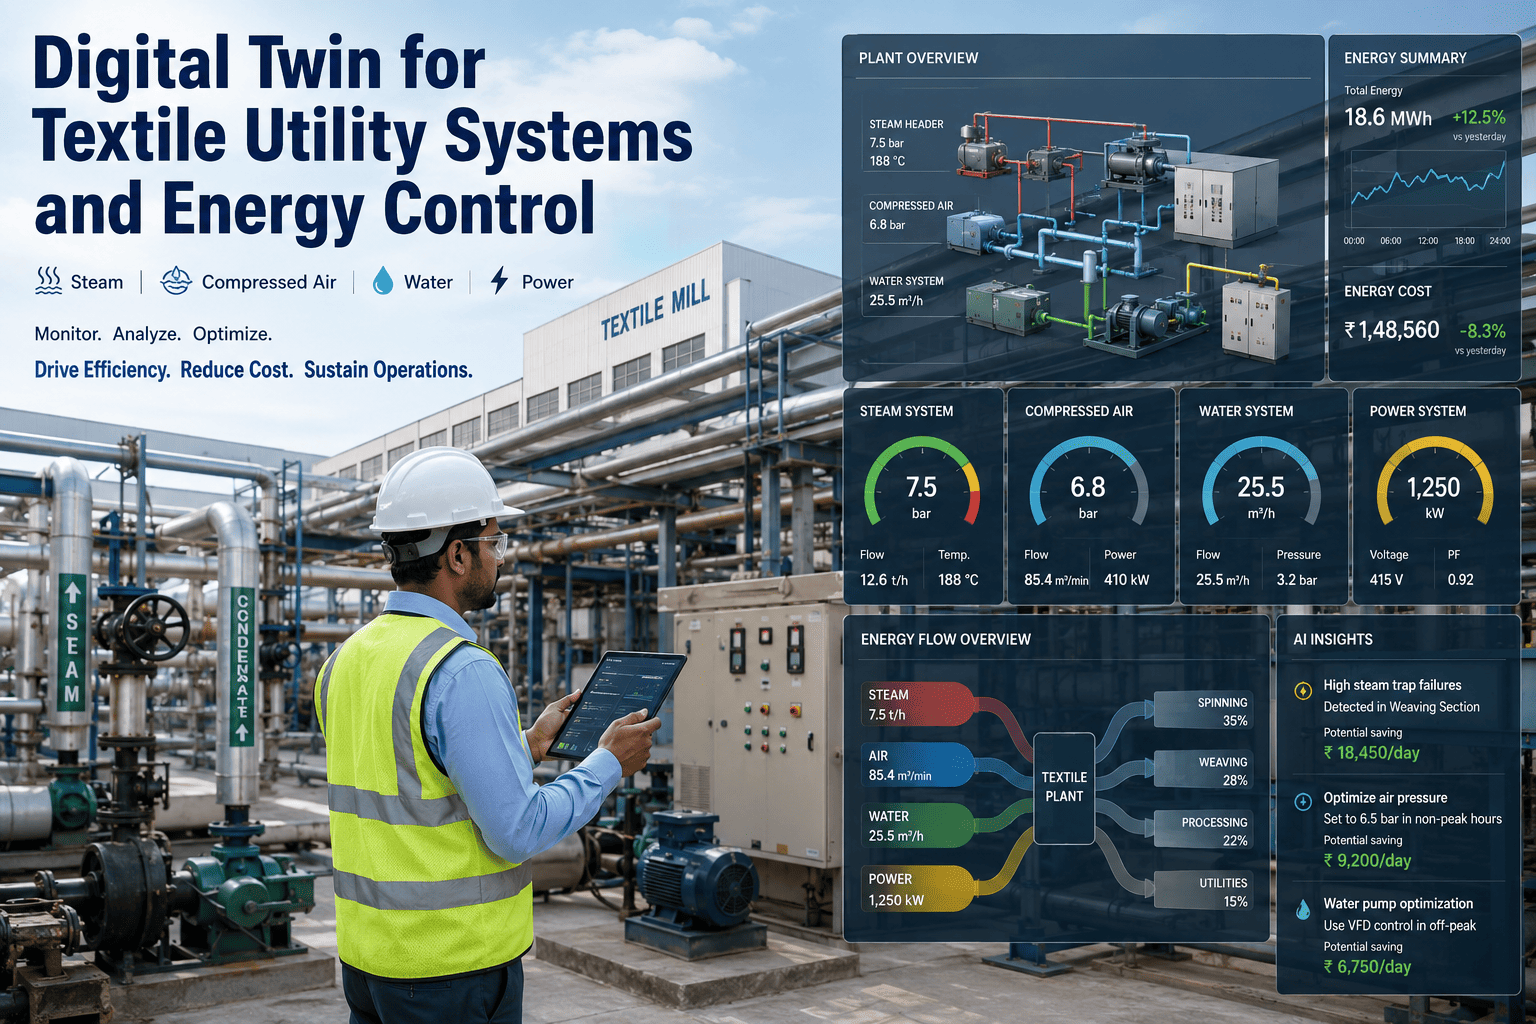
Steam, compressed air, chilled water, and electrical load in a textile mill are rarely managed as one connected system, even though a boiler running harder to cover a steam leak, a compressor over-pressurizing to compensate for a distribution loss, and a chiller cycling against a badly tuned setpoint are all draining the same energy budget at the same time. Utility teams typically watch each system through its own gauge or panel, with no shared view of how a change in one ripples through the others. iFactory's digital twin models your entire utility network as one connected system, so a change to steam pressure shows its effect on compressor load before you make it, and you can book a demo to see your own utility layout modeled this way.
Your Boiler, Compressors, and Chillers Are Already Connected — Most Mills Just Can't See the Connections
iFactory's digital twin links every utility system in your mill into one live model, so energy teams can simulate a change in one system and see its downstream effect across the whole network before touching a single setpoint.
Five Utility Systems, One Live Digital Twin
Each system below feeds or depends on at least one other, which is exactly why isolated monitoring misses the interactions that actually drive your energy bill.
Metering Tells You What Happened. A Digital Twin Tells You What Will Happen Next
Submetering every utility system is a necessary first step, but meters only report history. A digital twin adds a simulated model of how the systems interact, so an energy manager can test a change before committing plant equipment to it.
- Shows consumption after the fact
- Each system reported in isolation
- Changes tested live on real equipment
- Simulates outcomes before you act
- Models cross-system dependencies
- Tests setpoint changes risk-free first
A Setpoint Change You Cannot Simulate Is a Setpoint Change You're Guessing On
iFactory's digital twin models your full utility network so energy decisions get tested in simulation first, not on live equipment during production hours.
Three Utility Blind Spots the Digital Twin Surfaces Fastest
Composite mills report finding the largest early savings in the same three areas once a connected view of utilities is in place, because these are exactly the interactions an isolated gauge cannot show.
Compressed Air Over-Pressurization
Air-jet looms consume the majority of a mill's weaving compressed air, and running the system at a higher pressure than required to compensate for distribution losses adds a measurable energy penalty for every unnecessary psi.
Steam Consumption Mismatch Between Machines
Identical dyeing or sizing machines can consume noticeably different steam per kilogram of output, a gap that stays invisible until steam use is tracked machine by machine rather than at the boiler header alone.
Fixed Utility Load During Low Production
Boilers, compressors, and chillers continue drawing energy even when production volume drops, so utility cost per unit of output climbs during slow periods unless the twin flags the mismatch and staging is adjusted.
Building Your Utility Digital Twin in Four Stages
The twin is built progressively, starting with the utility systems generating the largest energy spend, so early value shows up long before every meter in the mill is connected.
Meter and Sensor Mapping
Existing meters are inventoried and gaps identified across boiler, compressor, chiller, and water systems to define what the twin will model first.
Baseline Model Construction
Historical consumption and load data build the initial simulation model, validated against your actual metered readings before anything is trusted.
Cross-System Linking
Dependencies between systems, such as compressor load response to steam demand shifts, are added so the twin reflects real plant behavior, not isolated silos.
Live Simulation and Alerts
Energy teams run what-if scenarios against the live twin and receive alerts when real consumption drifts from the modeled baseline.
What Composite Mills Report After Digital Twin Deployment
The figures below reflect outcomes reported by composite textile mills after deploying plant-wide utility digital twins across spinning, weaving, dyeing, and finishing utility systems.
Questions Utility and Energy Managers Ask About Digital Twins
Stop Managing Five Utility Systems as Five Separate Guesses
iFactory's digital twin connects boiler, compressed air, chiller, water, and electrical systems into one live model you can simulate before you act. Book a demo and see it built around your own utility room.