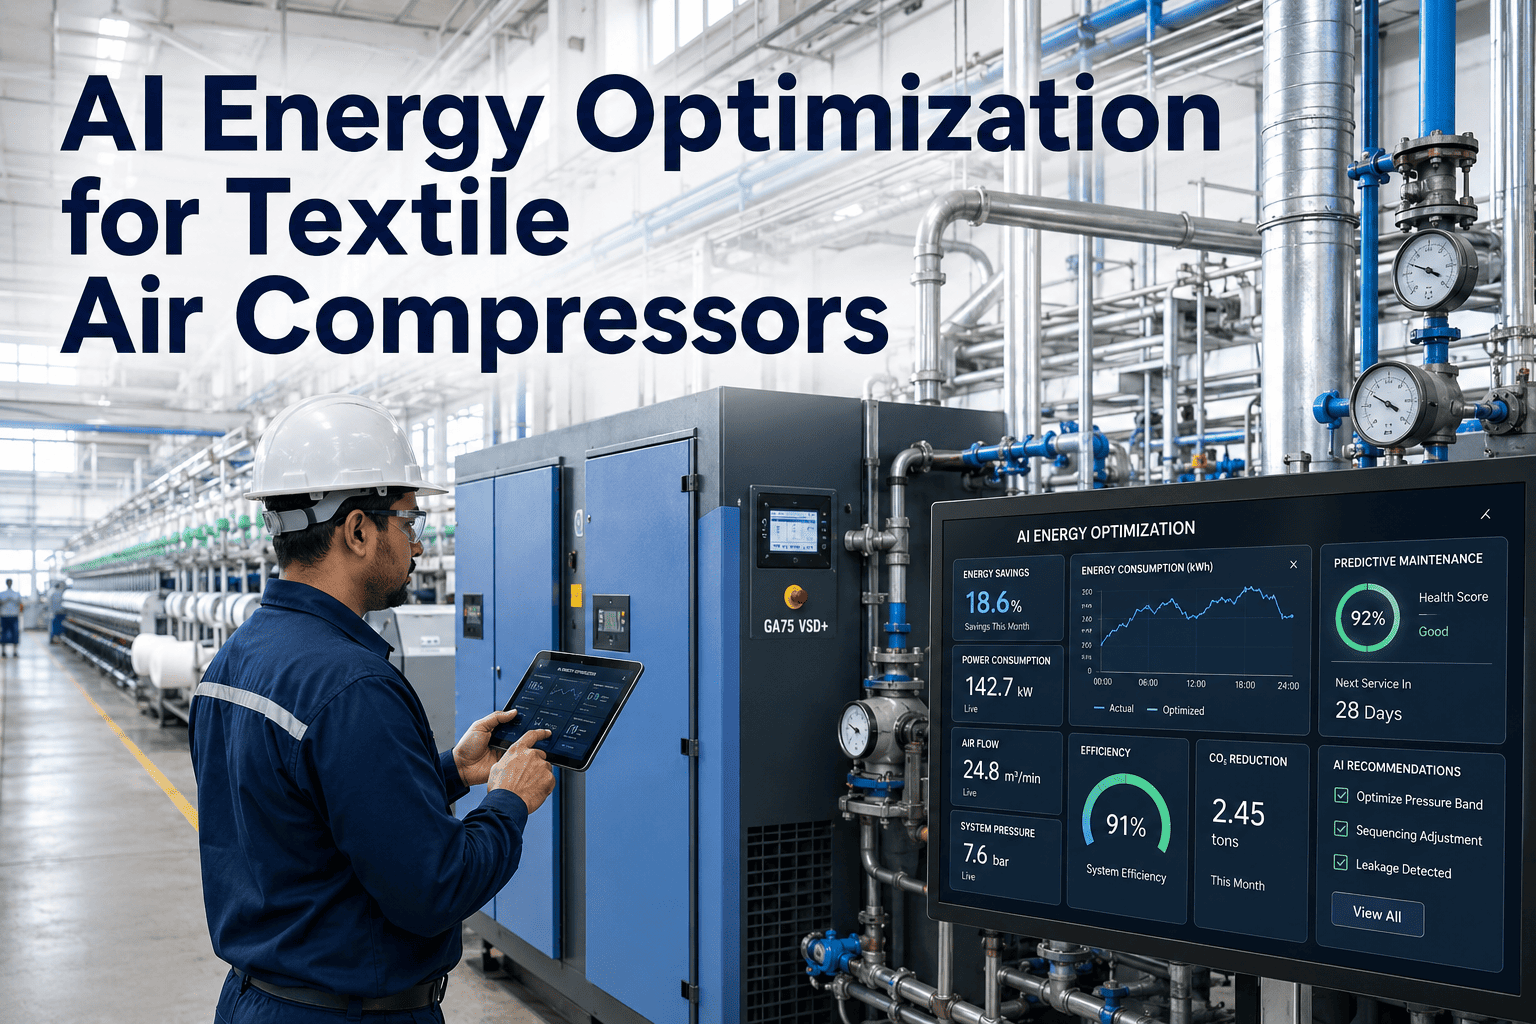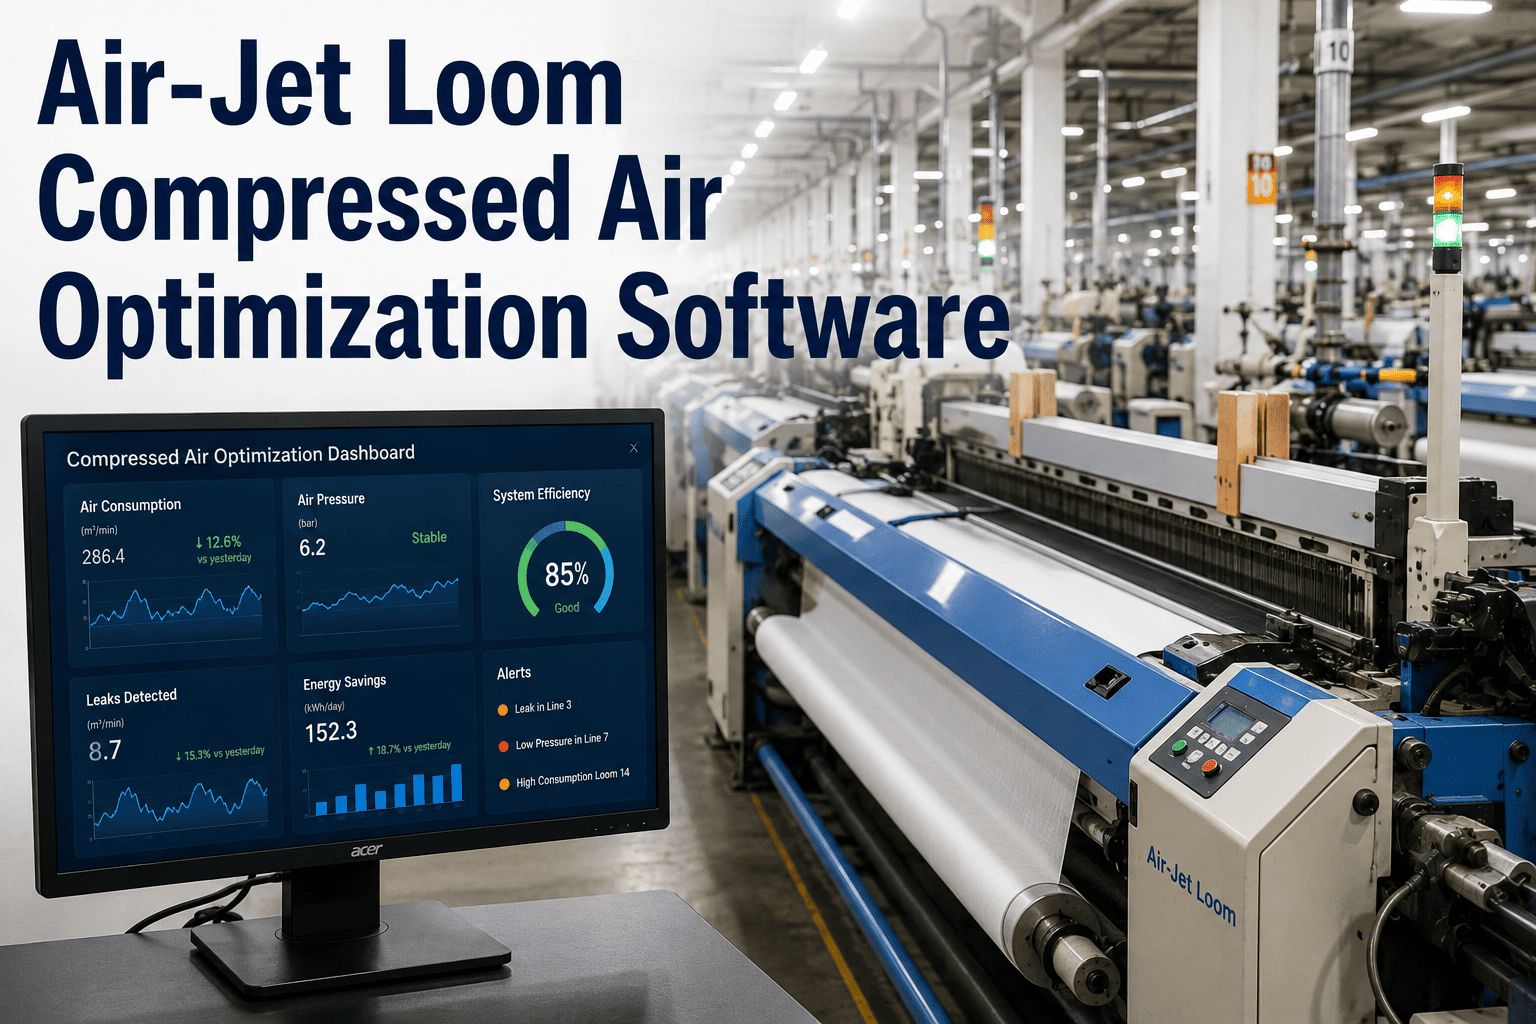
In modern air-jet weaving, compressed air often accounts for 30% to 40% of total energy expenditure, making it the single largest utility cost in the weaving shed. Despite this, most mills still rely on manual spot checks or aggregated monthly bills to gauge consumption, leaving substantial savings untapped. A comprehensive, loom-level compressed air optimization strategy can reduce energy costs by 15% to 25% while improving fabric quality and extending equipment life. This guide provides a technical, data-driven framework for measuring, analyzing, and optimizing compressed air usage per loom, per style, and per shift. From identifying microscopic leaks in distribution lines to dynamically adjusting nozzle pressure based on weft insertion parameters, every aspect is covered with enterprise-grade precision. Plant managers and maintenance directors seeking immediate, verifiable ROI are encouraged to Book a Demo to see how real-time analytics transform air consumption into a controllable variable.
Cut Compressed Air Costs by 20% or More
Deploy loom-level monitoring and AI-driven pressure optimization across your entire weaving shed. Start saving on day one.
Real-Time Consumption Tracking
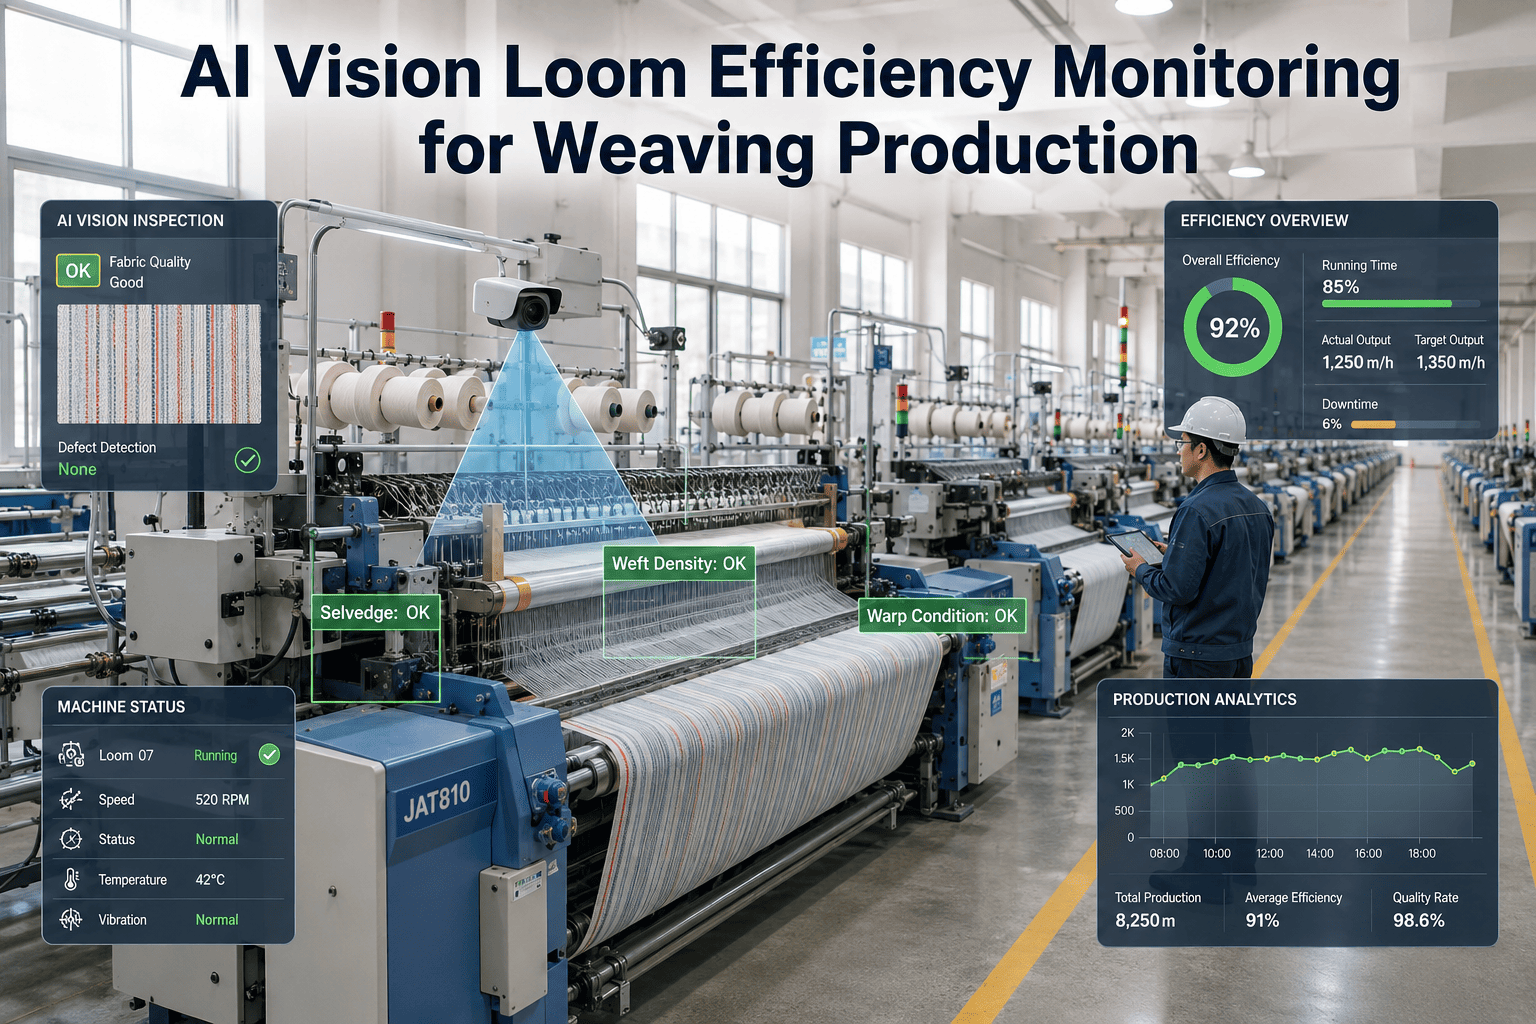
Monitor CFM per loom, per shift, and per style with sub-second granularity. Our edge sensors capture pressure, flow, and temperature at every nozzle bank, feeding a centralized dashboard that highlights anomalies instantly. Historical trend lines reveal seasonal drift, filter clogging, and regulator creep before they cause quality defects. With automated alerts set to your tolerance thresholds, you can respond to a 5% spike in baseline consumption within minutes, not weeks. This precision turns compressed air from a fixed overhead into a measurable, manageable resource.
Leak Detection & Localization
Compressed air leaks in distribution hoses, fittings, and quick disconnects can waste 20% to 30% of total output without any visible sign. Our analytics platform uses acoustic signatures and flow balance algorithms to pinpoint leak locations down to the individual loom manifold. The system generates a prioritized repair list ranked by estimated CFM loss and payback period. A typical mill with 200 looms can recover 15,000 CFM per month just by fixing the top ten leaks identified by the platform. This capability alone delivers a return on investment in under six weeks.
Pressure Optimization by Style
Different fabric styles require distinctly different insertion parameters. A heavy denim may need 6.0 bar main nozzle pressure, while a lightweight filament can run at 4.2 bar without compromising weft insertion. Our software correlates historical quality data with pressure settings to build a style-specific optimization model. When a style change occurs, the system automatically adjusts pressure setpoints across all affected looms, eliminating manual guesswork. Mills using this feature report an average 18% reduction in compressed air consumption per square meter of fabric produced, with zero increase in stops or defects.
Implementation Roadmap for Loom Air Optimization
Audit & Baseline
Install flow meters at compressor room outlets and at each loom group. Collect 30 days of data across all shifts and styles to establish baseline consumption per loom, per style, and per shift. Use this data to identify the top 20% of looms with the highest CFM per pick, which typically represent low-hanging fruit for immediate savings.
Leak Detection Campaign
Run the acoustic leak detection algorithm during scheduled downtime. Generate a prioritized repair list sorted by CFM loss. Assign repair crews to fix the top ten leaks within the first week. Re-measure consumption to verify savings and update the baseline. This step alone often reduces total plant air demand by 8% to 12%.
Pressure Optimization
For each distinct fabric style, run a design of experiments (DOE) varying main nozzle pressure, relay nozzle pressure, and stretch nozzle pressure. Record resulting picks per minute, stops per 100,000 picks, and fabric defects. Use the optimization model to find the pressure set that minimizes air consumption while maintaining quality. Implement these settings as style-specific recipes in the loom control system.
Continuous Monitoring & Alerts
Configure real-time dashboards for shift supervisors with alerts when a loom's CFM per pick deviates more than 3% from its style-specific baseline. Set automated email or SMS notifications for maintenance managers when a leak is suspected. Schedule weekly reviews of top ten wasteful looms and monthly audits of overall system efficiency.
Ready to Optimize Your Weaving Energy?
Join leading textile manufacturers who have reduced compressed air costs by over 20% with iFactory's AI-driven analytics platform.
The Physics of Air-Jet Insertion
Air-jet weaving relies on a precisely controlled stream of compressed air to carry the weft yarn across the shed. The main nozzle accelerates the yarn to speeds exceeding 40 m/s, while relay nozzles maintain tension along the entire width. Any variation in pressure or flow creates turbulence that can cause yarn breaks, fabric defects, or excessive energy consumption. Understanding the relationship between nozzle geometry, yarn properties, and air velocity is critical for optimization. Our software models these interactions using computational fluid dynamics principles, enabling predictive adjustments that maintain insertion quality at the lowest possible air consumption. This deep technical approach ensures that pressure reductions do not compromise weaving performance.
Shift-Level Consumption Variability
Compressed air consumption often varies significantly between shifts due to differences in operator behavior, machine settings, and ambient conditions. Our analytics platform segments consumption data by shift, allowing you to identify which shifts consistently use more air per pick. This insight enables targeted training for operators on best practices for nozzle pressure adjustments during style changes. In one case study, a mill discovered that the night shift was over-pressurizing looms by an average of 0.5 bar, resulting in an extra 12,000 CFM per shift. Corrective training and automated lockouts reduced this variance by 80% within two weeks, saving $4,500 per month in electricity costs.
Predictive Maintenance for Air Systems
Compressed air systems degrade gradually. Filters clog, regulators drift, and seals wear. Our predictive maintenance module uses trend analysis of flow and pressure data to forecast when a component will need service. For example, a gradual increase in pressure drop across a filter indicates impending clogging. The system schedules a filter change during planned downtime, preventing a sudden pressure loss that could cause a massive energy spike or a production stoppage. This proactive approach reduces emergency maintenance calls by 60% and extends the life of valves and actuators by optimizing operating conditions. The result is a more reliable air system with lower total cost of ownership.
Integration with Existing Loom Controls
Our software integrates seamlessly with most major loom control systems, including those from Picanol, Toyota, Dornier, and Tsudakoma. A lightweight edge device connects to the loom's PLC via Modbus or OPC-UA, reading real-time data on picks per minute, weft stops, and pressure setpoints. The edge device also controls analog outputs to adjust pressure regulators automatically based on the optimization model. This closed-loop control ensures that every loom operates at its ideal pressure for the current style, without requiring operator intervention. The integration is non-invasive and typically takes less than two hours per loom, with zero disruption to production.
Before vs. After: Compressed Air Optimization Impact
| Metric | Before Optimization | After Optimization | Improvement |
|---|---|---|---|
| Average CFM per Loom | 85 CFM | 62 CFM | 27% Reduction |
| Leak Loss (% of Total) | 22% | 5% | 77% Reduction |
| Stops per 100,000 Picks | 3.2 | 2.8 | 12.5% Reduction |
| Energy Cost per Loom per Year | $4,200 | $3,100 | 26% Savings |
| Maintenance Downtime (hrs/yr) | 48 | 18 | 62.5% Reduction |
Frequently Asked Questions
How does the software measure compressed air consumption per loom without installing expensive flow meters on every machine?
Our platform uses a combination of a single master flow meter at the compressor room outlet and pressure sensors at each loom group. By time-synchronizing pressure drop events with loom operation cycles, we can infer individual loom consumption using a proprietary algorithm that accounts for pipe diameter, distance, and friction losses. This method achieves accuracy within ±3% of dedicated flow meters at a fraction of the cost. For mills that require absolute precision, we also support direct flow meter integration via pulse or analog inputs. Learn more about our sensor integration options by visiting our support page for detailed technical specifications.
Can the system automatically adjust loom pressure during a style change, or does it require manual approval?
The system offers both automatic and semi-automatic modes. In automatic mode, when the loom control system signals a style change, the edge device immediately loads the optimized pressure recipe and adjusts the regulators within 10 seconds. In semi-automatic mode, the system sends a recommendation to the shift supervisor's dashboard, who can review and approve the change with a single tap. This flexibility allows mills to maintain operator oversight while still capturing the majority of savings. For a demonstration of the style change workflow, Book a Demo with our engineering team.
What kind of ROI can we expect for a mid-size weaving mill with 150 looms?
Based on deployments across 12 mills, the typical ROI is achieved within 4 to 8 weeks. For a 150-loom mill with an average compressed air energy cost of $3,500 per loom per year, a 20% reduction saves $105,000 annually. The hardware and software investment for a 150-loom system is approximately $35,000, including edge devices, sensors, installation, and first-year subscription. Factoring in additional savings from reduced maintenance and fewer stops, the payback period is typically under 6 months. For a detailed ROI calculator tailored to your specific mill parameters, Book a Demo and our team will run the numbers with you.
Does the system work with existing compressor room controls, or do we need to upgrade our compressors?
Our system is designed to work with any compressor brand and control system. It monitors the compressor room's overall output via a master flow meter and pressure transducer, then correlates that with individual loom data. The optimization recommendations are implemented at the loom level, not at the compressor. This means you can achieve significant savings without any changes to your compressor room. In fact, by reducing overall demand, you may be able to run one fewer compressor, further cutting energy and maintenance costs. For mills with variable speed drive compressors, we offer an additional module that adjusts compressor discharge pressure setpoints based on real-time demand, maximizing system efficiency. Contact our support team at ifactoryapp.com/support for a compatibility check.
How long does it take to install and start seeing data, and do we need to shut down production?
Installation is non-invasive and typically completed over a weekend without any production downtime. Our technicians install pressure sensors at each loom group and connect the edge device to the loom's PLC using existing ports. The master flow meter is installed in the compressor room during a scheduled maintenance window. Data begins flowing immediately after installation, and within 24 hours you will have a baseline report showing consumption per loom, per style, and per shift. The optimization model takes about two weeks to train on your specific fabric styles, after which the system can start making automated adjustments. For a turnkey installation plan, Book a Demo and we will design a schedule that fits your production calendar.
Transform Your Weaving Energy Efficiency Today
Stop wasting compressed air and start saving. iFactory's platform delivers measurable results from day one.