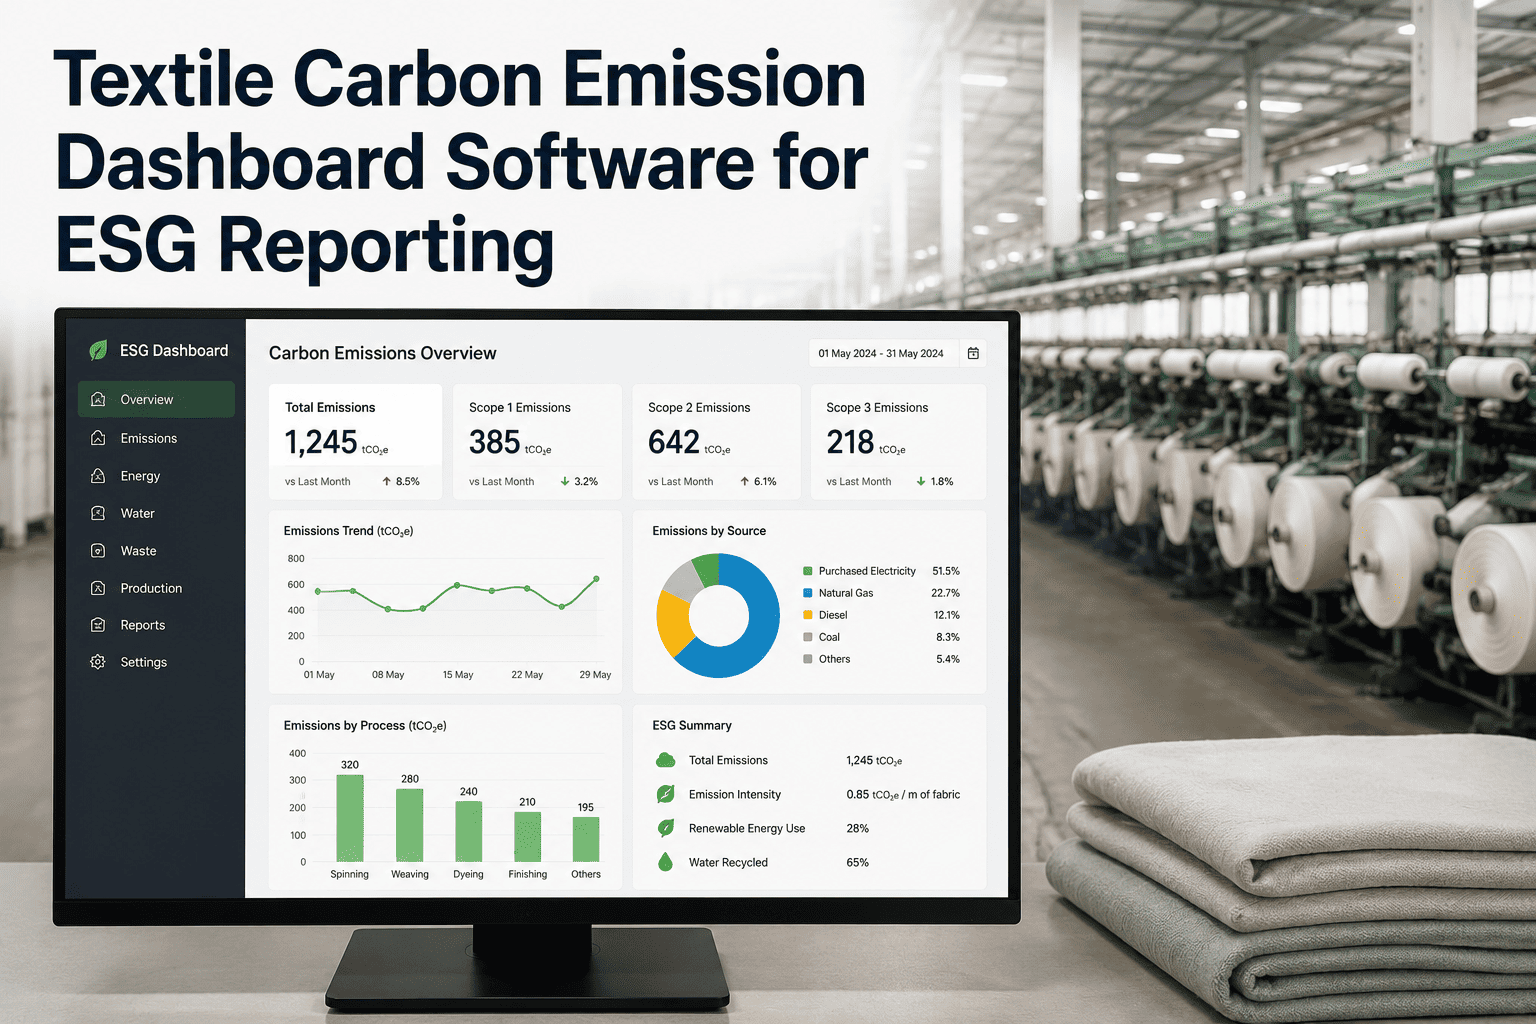
The textile industry is one of the most resource-intensive sectors globally, accounting for nearly 10% of annual carbon emissions. As regulatory bodies tighten environmental standards and consumers demand transparency, textile manufacturers face mounting pressure to track, report, and reduce their carbon footprint. A dedicated carbon emission dashboard software tailored for ESG reporting is no longer a luxury but a necessity for staying compliant and competitive. This comprehensive solution enables factories to monitor energy consumption, water usage, chemical inputs, and waste generation in real time, transforming raw data into actionable insights. By integrating scope 1, 2, and 3 emissions tracking, manufacturers can identify high-impact areas, set reduction targets, and generate audit-ready reports that satisfy global frameworks like the GHG Protocol, GRI, and SASB. Contact to see iFactory's carbon dashboard empowers textile businesses to achieve sustainability goals while optimizing operational efficiency.
Real-Time Carbon Monitoring for Textile Factories
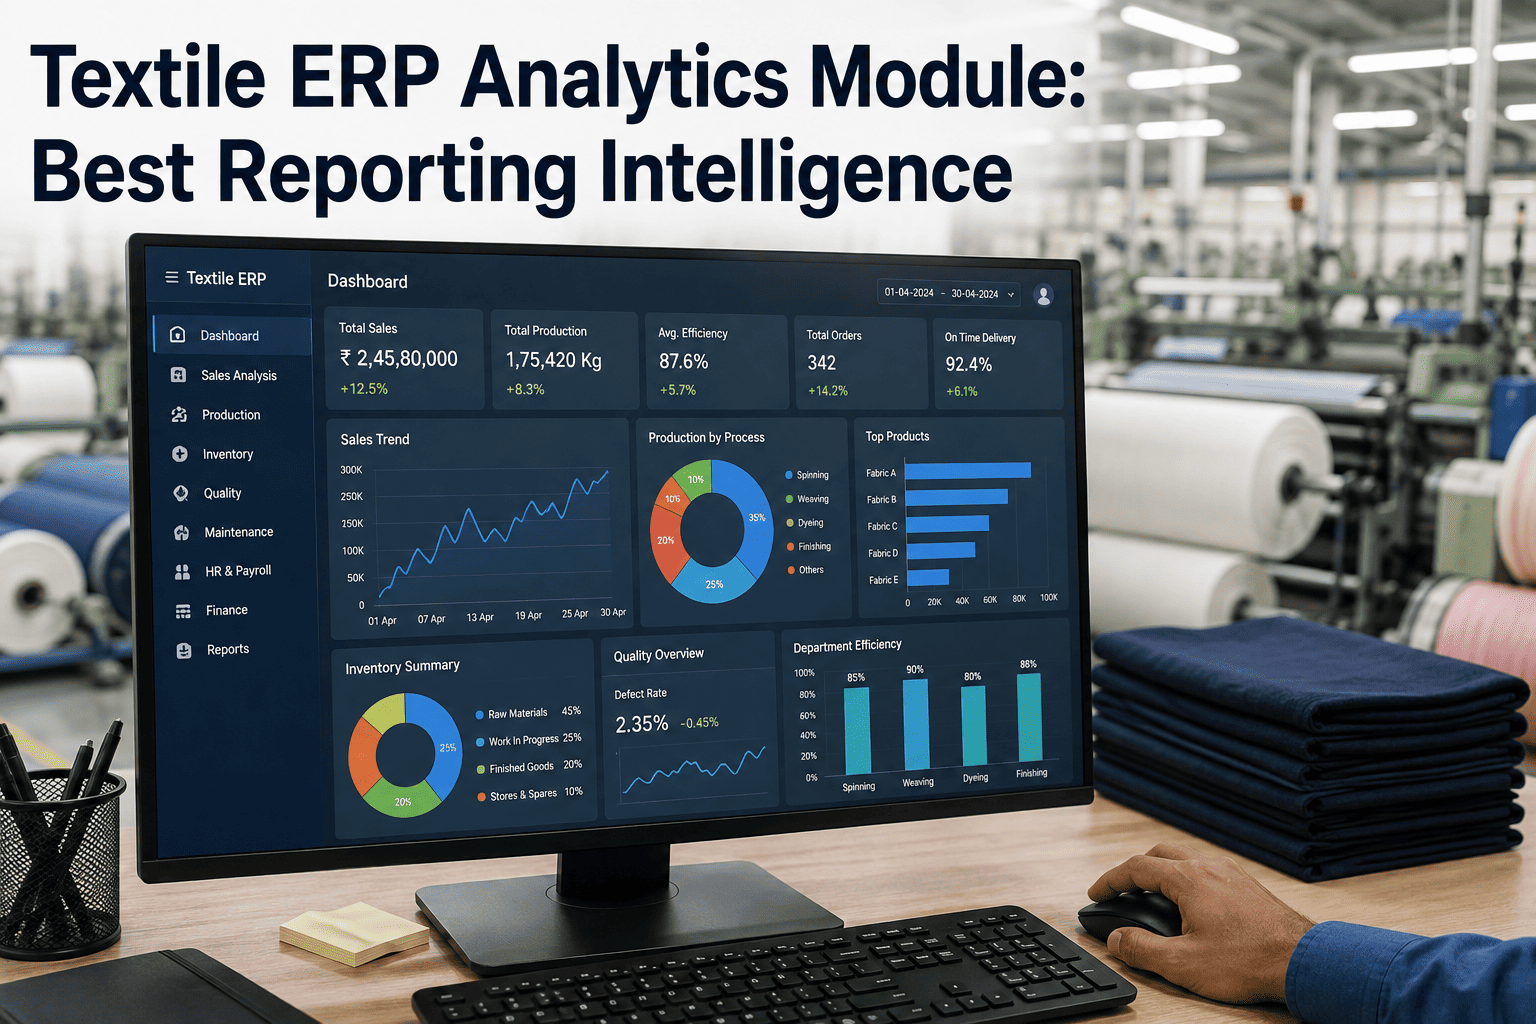
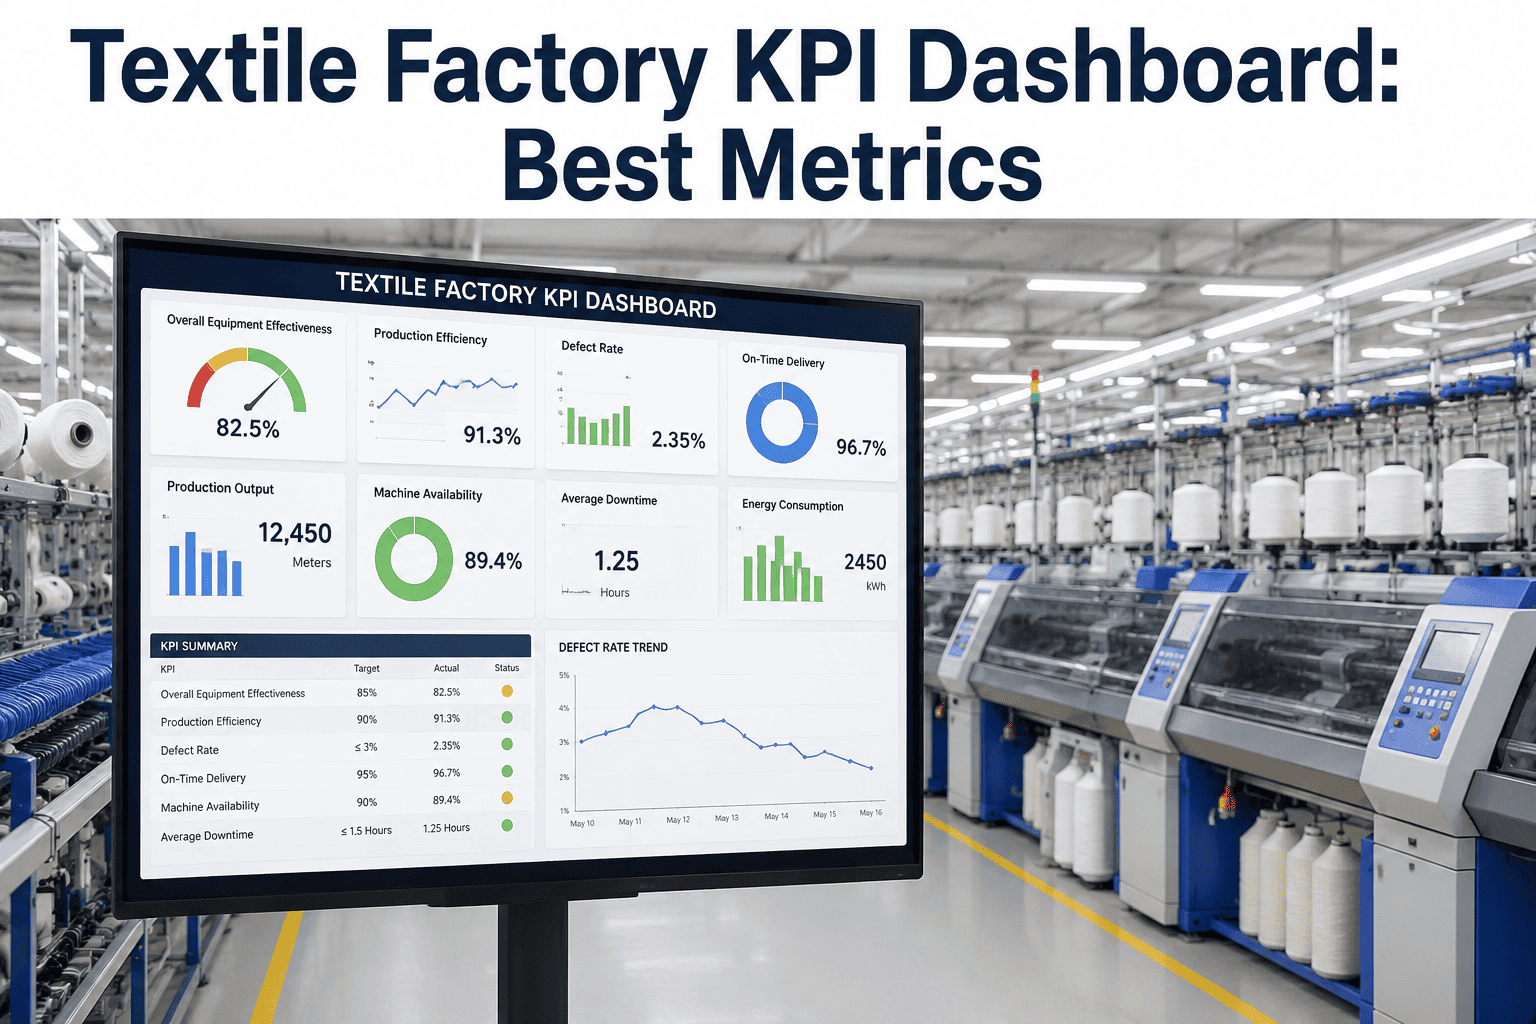
Our dashboard provides live visibility into your factory's carbon emissions, energy intensity, and utility consumption. With automated data collection from IoT sensors and production systems, you can track environmental performance down to the machine level. This real-time approach eliminates manual data entry errors and ensures that your ESG reports are always accurate and up to date.
Start Your Sustainability Journey Today
Book a demo to see how our textile carbon dashboard can transform your ESG reporting.
Key Environmental Metrics at a Glance
Reduction target: 35% by 2030
Across all production lines
Since implementing efficiency measures
All data traceable and verifiable
Comprehensive Scope Emissions Tracking
Understanding the full carbon impact of textile production requires tracking emissions across all three scopes. Our dashboard simplifies this complexity by automatically categorizing data from energy bills, fuel consumption, purchased materials, and logistics. This ensures that your ESG reports meet the strictest verification standards.
Scope 1
Direct emissions from owned sources: natural gas for boilers, diesel for generators, and process emissions from dyeing and finishing. Real-time monitoring helps identify leakages and inefficiencies.
Scope 2
Indirect emissions from purchased electricity, steam, heating, and cooling. Our dashboard integrates with utility meters to provide hourly granularity and cost allocation.
Scope 3
Supply chain emissions from raw material extraction, transportation, and product use. Track cotton, polyester, and other fiber footprints with supplier-specific data.
Energy Intensity and Utility Analytics
Energy consumption is the largest contributor to textile carbon emissions. Our software provides deep analytics on energy intensity per unit of production, helping you pinpoint waste and optimize usage. The dashboard breaks down energy use by department, machine, and shift, enabling targeted efficiency programs.
| Production Area | Energy Use (kWh) | Carbon (kg CO2e) | Intensity (kWh/kg) |
|---|---|---|---|
| Spinning | 450,000 | 198,000 | 2.1 |
| Weaving | 320,000 | 140,800 | 1.8 |
| Dyeing | 670,000 | 294,800 | 4.5 |
| Finishing | 210,000 | 92,400 | 1.2 |
By analyzing these metrics, manufacturers can set science-based targets and track progress monthly. Our dashboard also benchmarks your performance against industry averages, highlighting areas for improvement.
Audit-Ready ESG Compliance Reporting
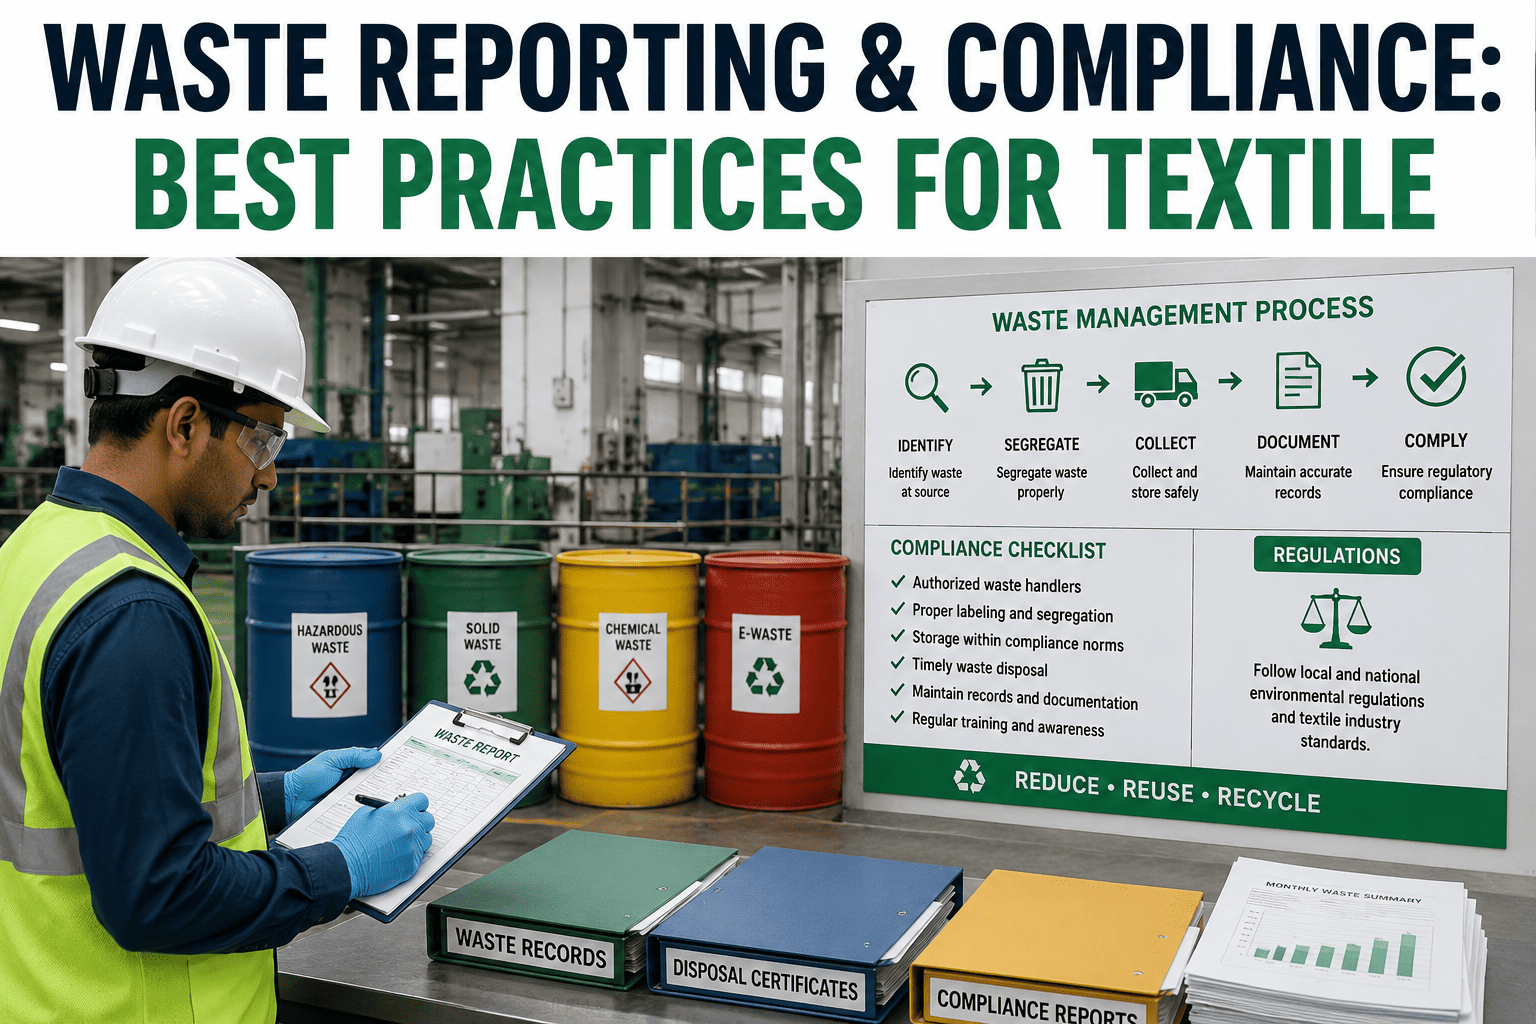
Preparing for sustainability audits can be time-consuming and stressful. Our dashboard automates the generation of reports aligned with leading frameworks such as the GHG Protocol, GRI, SASB, and TCFD. All data is stored with a complete audit trail, including timestamps, source documents, and calculation methodologies. This ensures that auditors can verify every number without manual intervention.
GHG Protocol
Complete scope 1, 2, and 3 reporting with biogenic emissions and removals.
GRI 305
Emissions disclosure with intensity ratios and reduction targets.
SASB
Textile-specific metrics including water and chemical management.
TCFD
Climate-related risk assessment and scenario analysis.
Simplify Your ESG Reporting Process
Let our dashboard handle the data so you can focus on reducing emissions and growing your business sustainably.
Carbon Reduction Strategies Powered by Data
Data alone is not enough; actionable insights drive real change. Our dashboard uses machine learning to recommend specific reduction measures based on your factory's unique profile. Whether it's optimizing boiler efficiency, switching to renewable energy, or redesigning processes, the system quantifies potential savings and payback periods.
Audit Current Baseline
Establish a comprehensive carbon footprint using 12 months of historical data.
Identify Hotspots
Pinpoint areas with highest emissions and cost inefficiencies.
Implement Measures
Deploy targeted interventions like LED lighting, heat recovery, or solar panels.
Monitor & Report
Track reduction progress in real time and generate compliance reports.
Frequently Asked Questions
How does the dashboard collect data from different sources?
Our software integrates seamlessly with existing IoT sensors, utility meters, ERP systems, and manual data entry forms. We use standard protocols like Modbus, MQTT, and REST APIs to pull data from machines, energy meters, and water flow meters. For facilities without digital infrastructure, we provide mobile forms and barcode scanning to capture data on the go. All data is validated and normalized before being stored in a centralized database. This ensures consistency and accuracy across all reporting periods. Learn more about data integration options.
Can the dashboard handle multi-site textile operations?
Yes, our platform is designed for enterprises with multiple factories, warehouses, and distribution centers. You can view consolidated emissions across all sites or drill down into individual facilities for granular analysis. Each site can have its own set of emission factors, energy tariffs, and production metrics. The dashboard supports role-based access so that corporate sustainability managers see the big picture while plant managers focus on their specific operations. Contact support for multi-site setup details.
Is the software compliant with international ESG reporting standards?
Absolutely. Our dashboard generates reports that comply with the GHG Protocol (Scope 1, 2, and 3), GRI 305, SASB (Textiles, Apparel & Footwear), and TCFD recommendations. We also support regional regulations such as the EU's Corporate Sustainability Reporting Directive (CSRD) and the UK's Streamlined Energy and Carbon Reporting (SECR). All calculation methodologies are transparent and can be audited by third parties. View our compliance matrix.
How do you ensure data security and confidentiality?
We take data security seriously. Our platform uses end-to-end encryption for data in transit and at rest, and we are SOC 2 Type II certified. Access controls are granular, allowing you to define who can view, edit, or export data. We also offer on-premise deployment options for clients with strict data residency requirements. All data is backed up daily and stored in redundant servers. Read our security whitepaper.
What kind of support and training do you provide?
We offer comprehensive onboarding, including data integration workshops, user training sessions, and custom dashboard configuration. Our support team is available 24/7 via chat, email, and phone. Additionally, we provide a knowledge base with video tutorials, user guides, and best practices. For advanced analytics, we offer consulting services to help you set reduction targets and track progress. Explore support plans.
Ready to Transform Your ESG Reporting?
Join hundreds of textile manufacturers who trust iFactory for accurate, audit-ready carbon data. Book a demo or contact support today.