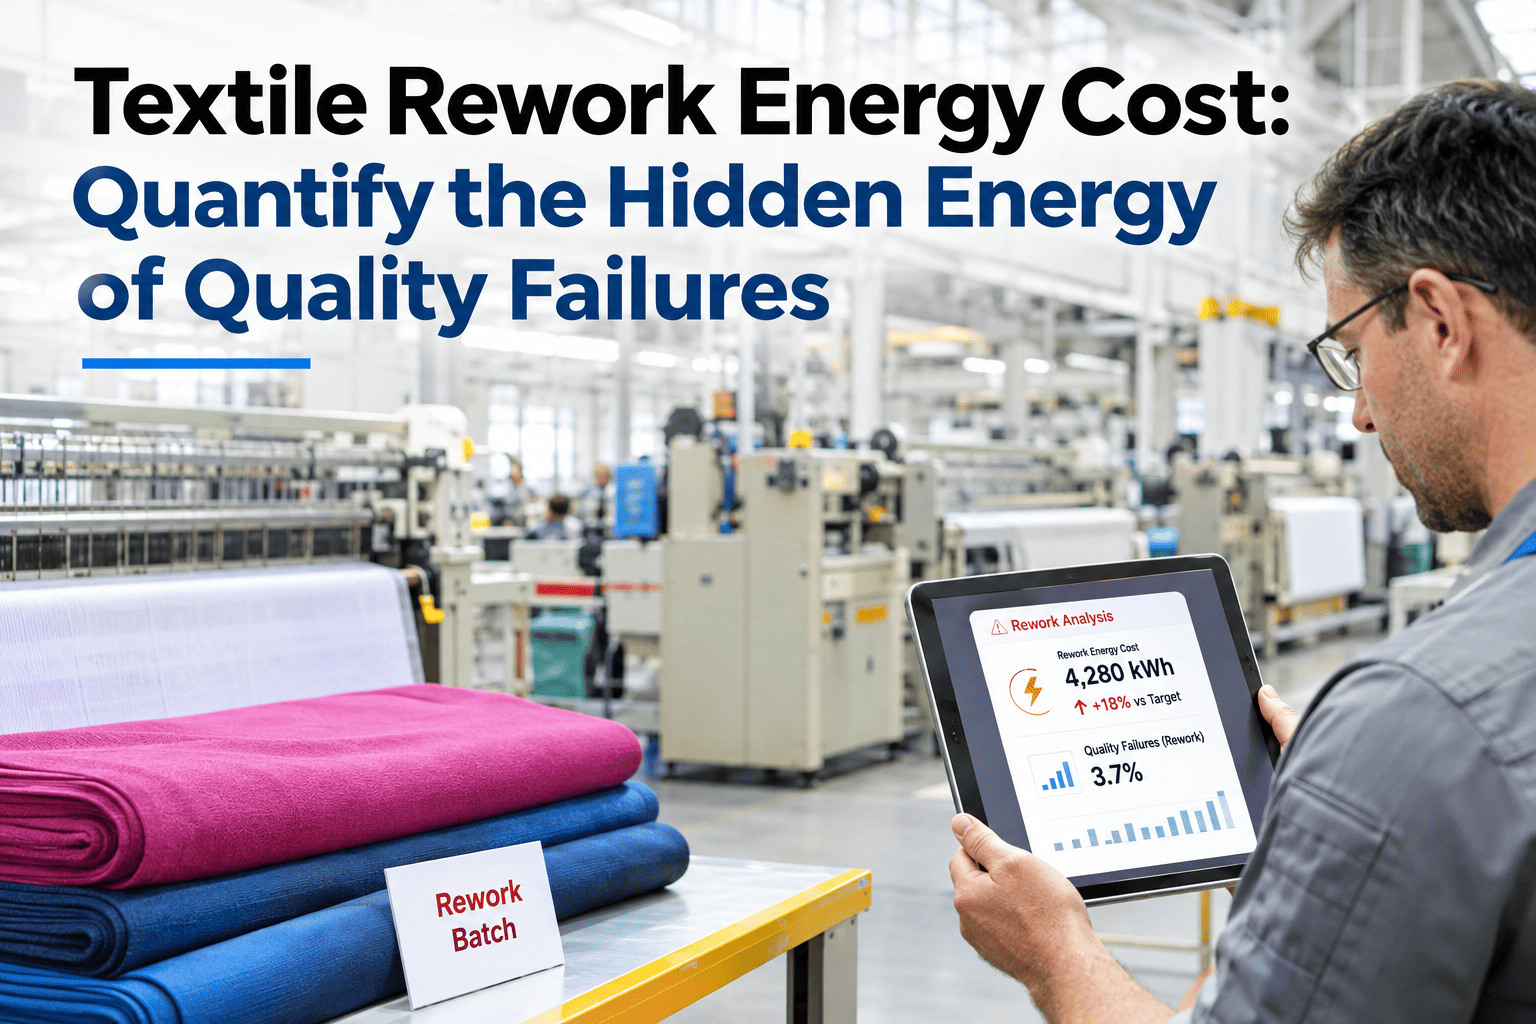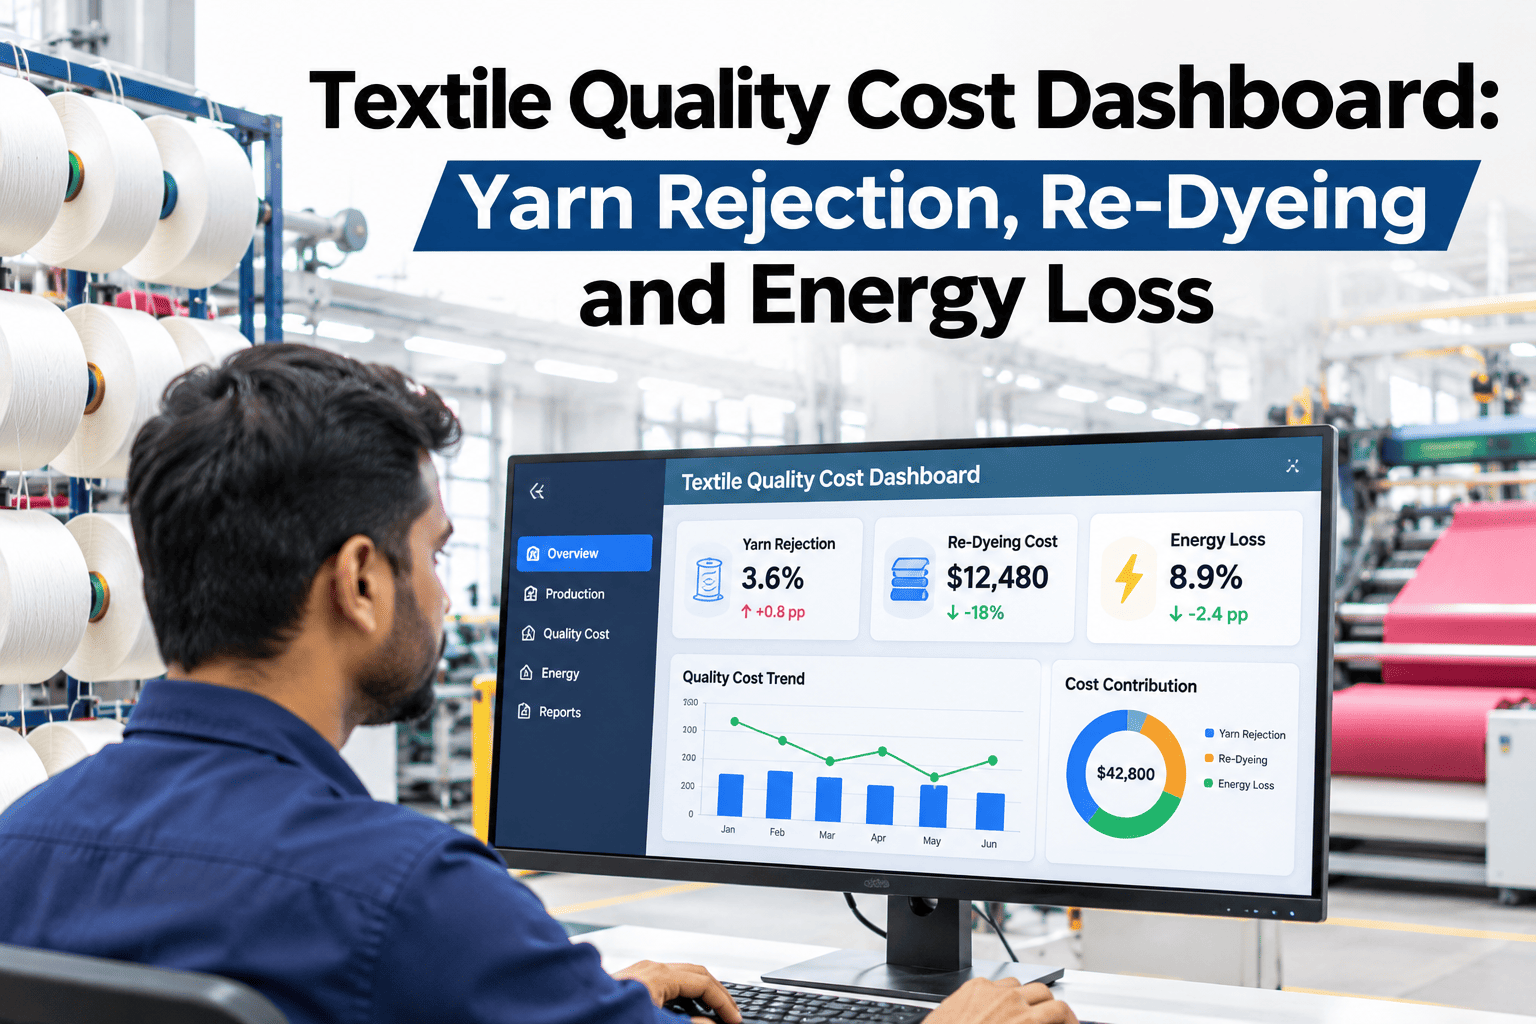
Most textile factories track yarn rejection, re-dyeing, and energy separately — which means nobody ever sees the real cost of a quality failure. A rejected yarn lot does not just lose the material value; it carries wasted dyeing chemicals, excess steam, idle machine time, delayed deliveries, and emergency overtime. When these streams are combined into a single cost-of-quality dashboard, the number is usually two to four times larger than what the quality team reports. iFactory AI consolidates every cost stream into one live view so operations leaders can see the true cost of textile quality failures and act on the biggest drivers first.
Stop Measuring Rejection Rates. Start Measuring What Quality Failures Actually Cost
iFactory AI brings yarn rejection, re-dyeing, rework, energy loss, water, chemicals and machine downtime into one live cost-of-quality dashboard — so your biggest savings opportunity is always visible.
What Is Cost of Poor Quality (COPQ) in a Textile Mill?
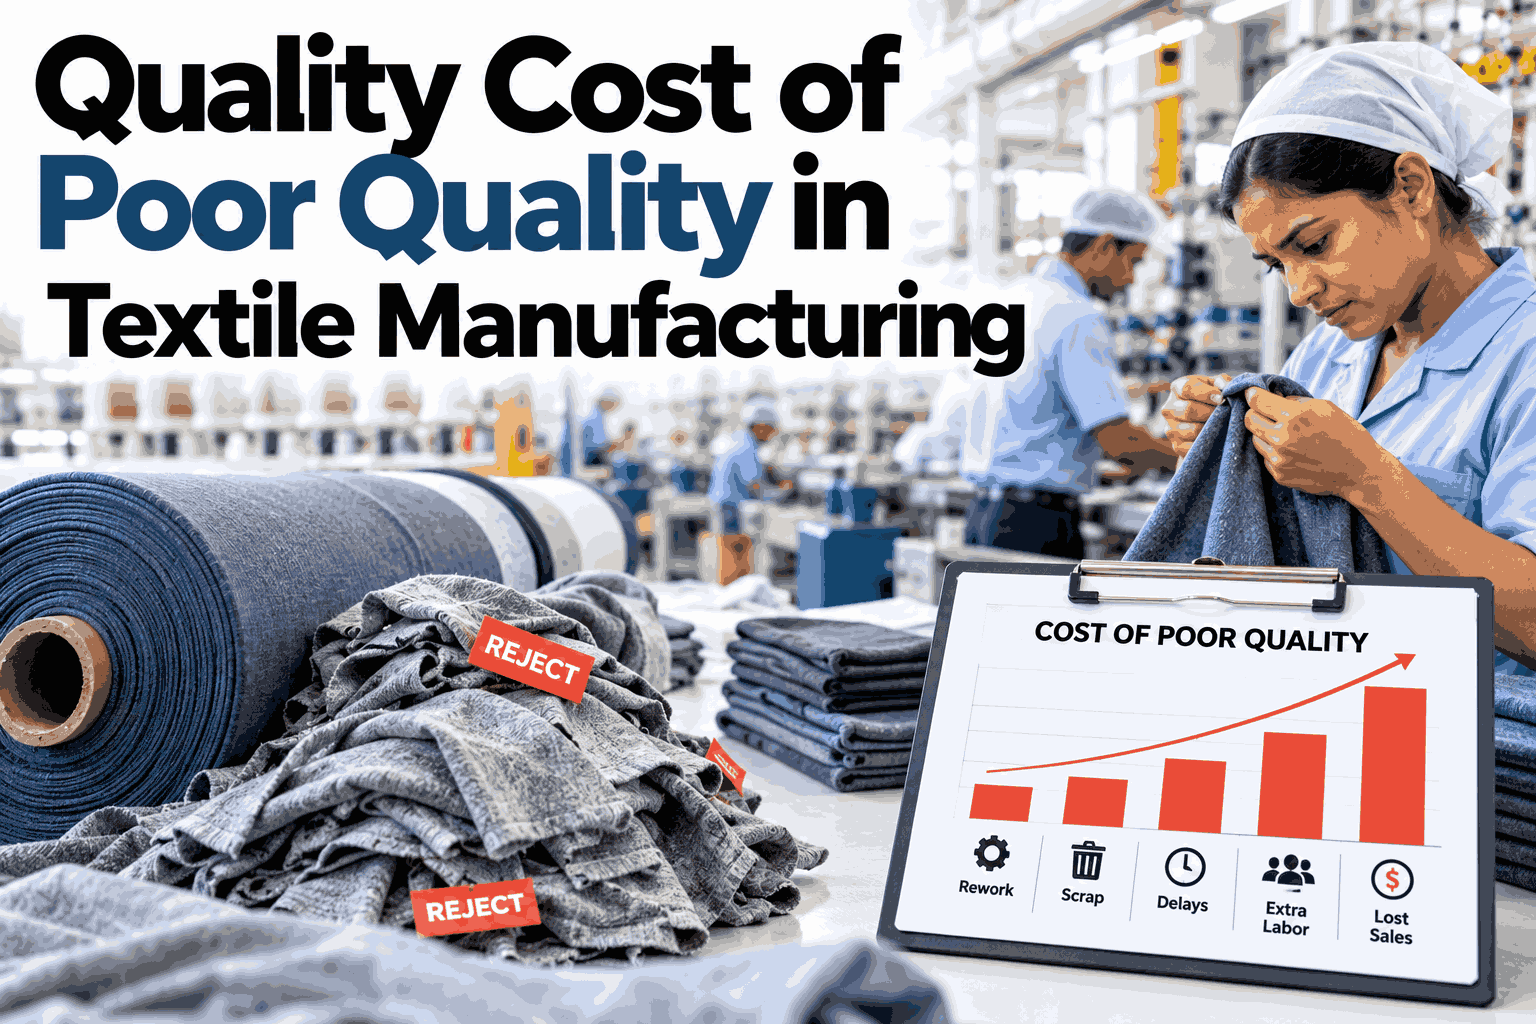
Cost of Poor Quality (COPQ) in textile manufacturing is the total financial loss caused by defects, failures, rework, and waste — including costs that never appear on a traditional quality report. COPQ covers four categories: internal failure (rejection, rework, re-dyeing before delivery), external failure (customer returns, claims, retailer chargebacks), appraisal (inspection labor, testing), and prevention (quality training, process controls).
Industry studies suggest COPQ in textile manufacturing typically runs at 5–15% of annual turnover (Quality Council of Indiana, 2025). For a mill producing $20M annually, that is $1M–$3M in avoidable loss — most of it invisible in standard reports.
Why Textile Quality Cost Is Always Underreported
A standard quality report shows rejection percentage and defect counts. It rarely captures what the rejection actually cost. The gap happens because quality, production, maintenance, and energy teams each record their own slice — and nobody adds them up.
The Seven Cost Streams to Capture in a Textile COPQ Dashboard
A complete textile quality cost model requires seven input streams. Each stream has a data source that iFactory AI can connect to automatically — PLC signals, MES records, ERP transactions, lab systems, and energy meters.
Connect All Seven Cost Streams Into One Live Dashboard
iFactory AI integrates with your MES, ERP, energy meters and lab systems to calculate COPQ per lot, per machine, and per defect type — updated in real time.
How to Calculate Re-Dyeing Cost Per Batch
Re-dyeing cost calculation is more complex than it appears because a failed batch carries both the original dyeing cost and the cost of correction. Getting this right is essential for accurate COPQ reporting.
A mill that re-dyes 3% of its monthly output absorbs a re-dyeing cost burden of approximately 4.5–7.5% of its total dyeing cost — not the 3% the rejection rate implies. Teams that want to run this calculation against their own batch data can review the model in a 30-minute session.
Linking Quality Cost to Specific Machines and Processes
A mill-level COPQ number tells you the size of the problem. A machine-level or process-level breakdown tells you where to fix it. iFactory AI attributes quality cost to its source — spinning frame, draw frame, ring frame, stenter, jigger, autoclave — so maintenance and process engineers can prioritize.
| Process | Typical quality failure | Primary cost stream | Secondary cost stream |
|---|---|---|---|
| Ring spinning | High yarn breaks, U% deviation | Rejection + rework | Energy waste |
| Draw frame | CV% out of spec | Yarn rejection | Downstream rework |
| Dyeing machine | Shade variation, unlevel dyeing | Re-dyeing chemicals/steam | Delivery delay |
| Stenter | Shrinkage, GSM deviation | Rework or rejection | Energy on failed runs |
| Autoclave | Yarn set failure | Re-processing cost | Steam & water waste |
Textile COPQ Dashboard: What to Display and Why
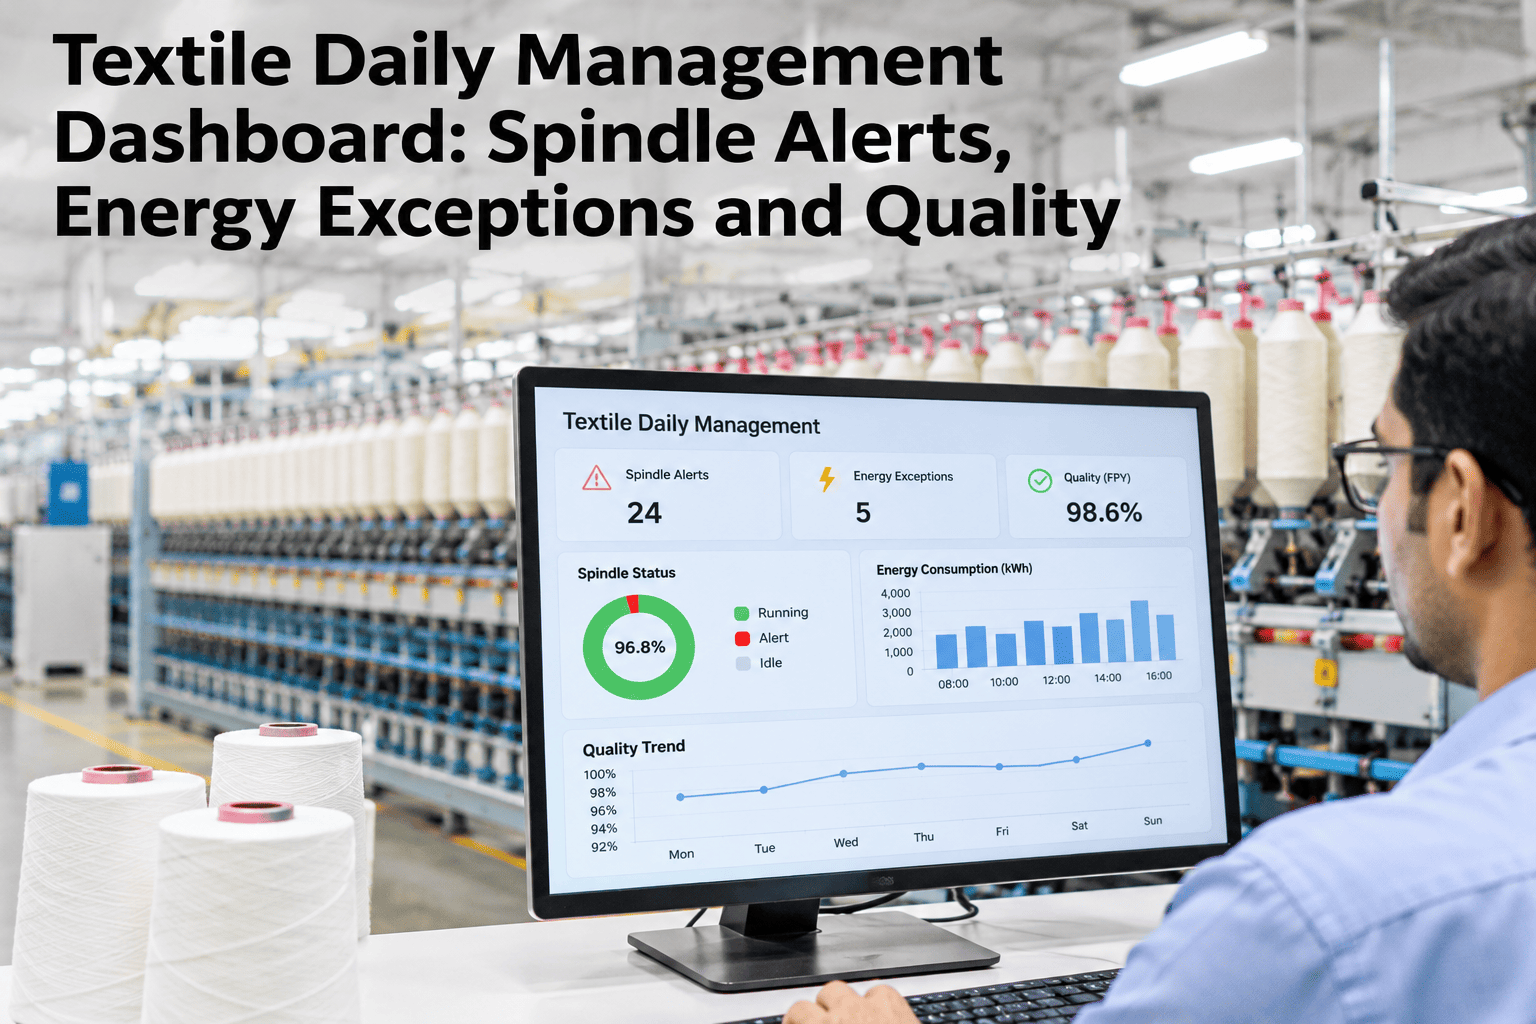
A well-designed textile quality cost dashboard has three layers: a mill-level summary for management, a department-level breakdown for supervisors, and a lot-level drill-down for quality engineers. Each layer answers a different question.
Connecting COPQ to Sustainability and ESG Reporting
Quality failures are also waste events. Every rejected yarn lot and every re-dyeing run consumes water, chemicals, and energy that contribute to a mill's carbon and effluent footprint. As buyers increasingly request Scope 3 emissions data and water-use disclosures, a textile COPQ dashboard doubles as a sustainability data source.
Teams preparing for buyer sustainability audits or GRS/OEKO-TEX reporting can ask the iFactory AI support team how COPQ data maps to common ESG frameworks.
Implementation: Getting a COPQ Dashboard Live in Your Mill
The biggest barrier to a textile COPQ dashboard is not technology — it is data fragmentation. Quality, production, energy, and finance data live in different systems and formats. iFactory AI connects these sources and applies a standard cost model so the dashboard is live within the deployment window.
Frequently Asked Questions
How is textile COPQ different from a standard quality rejection report?
A rejection report counts defects. COPQ assigns a financial value to every failure — including material, labor, energy, water, chemicals, machine time, and delivery impact. The result is an order-of-magnitude larger number that makes the business case for quality investment undeniable. See how iFactory AI calculates COPQ for your mill in a 30-minute walkthrough.
What data does the COPQ dashboard need to work?
At minimum: rejection records with quantities and reasons, re-dyeing batch records, an energy meter or manual energy records, and standard cost rates for yarn, chemicals, labor, and machine time. iFactory AI can begin with partial data and add streams as more sources are connected. Ask the support team what data your mill already has available before the first session.
Which cost stream typically delivers the fastest COPQ reduction?
In most textile mills, re-dyeing is the fastest-impact target because it is discrete, well-documented, and directly linked to specific machines and parameters. Reducing re-dyeing RFT failure from 8% to 4% typically cuts total COPQ by 15–25% depending on dye costs. Review your mill's re-dyeing cost breakdown with our textile quality team.
Can the dashboard separate avoidable from unavoidable quality costs?
Yes. iFactory AI classifies quality costs by root cause — process deviation, machine condition, raw material variation, or operator error. Costs linked to process deviation and machine condition are classified as avoidable; costs tied to inherent raw material variation may be partially unavoidable. This distinction is essential for setting realistic reduction targets. Ask how root cause tagging works in the iFactory AI quality module.
How does COPQ tracking connect to ESG and sustainability reporting?
Because every quality failure consumes extra energy, water, and chemicals, COPQ data maps directly to Scope 1 emissions, water intensity, and chemical waste metrics. iFactory AI exports COPQ streams in formats compatible with GRS, OEKO-TEX, and common buyer sustainability templates. Book a session to see how quality cost and ESG reporting connect in the platform.
Know the Real Cost of Every Yarn Failure, Before the Next Shipment
iFactory AI builds your textile COPQ dashboard on-premise — connecting quality, energy, re-dyeing, rework, and delivery data into one financial view. Book a session to see it on your own mill data.