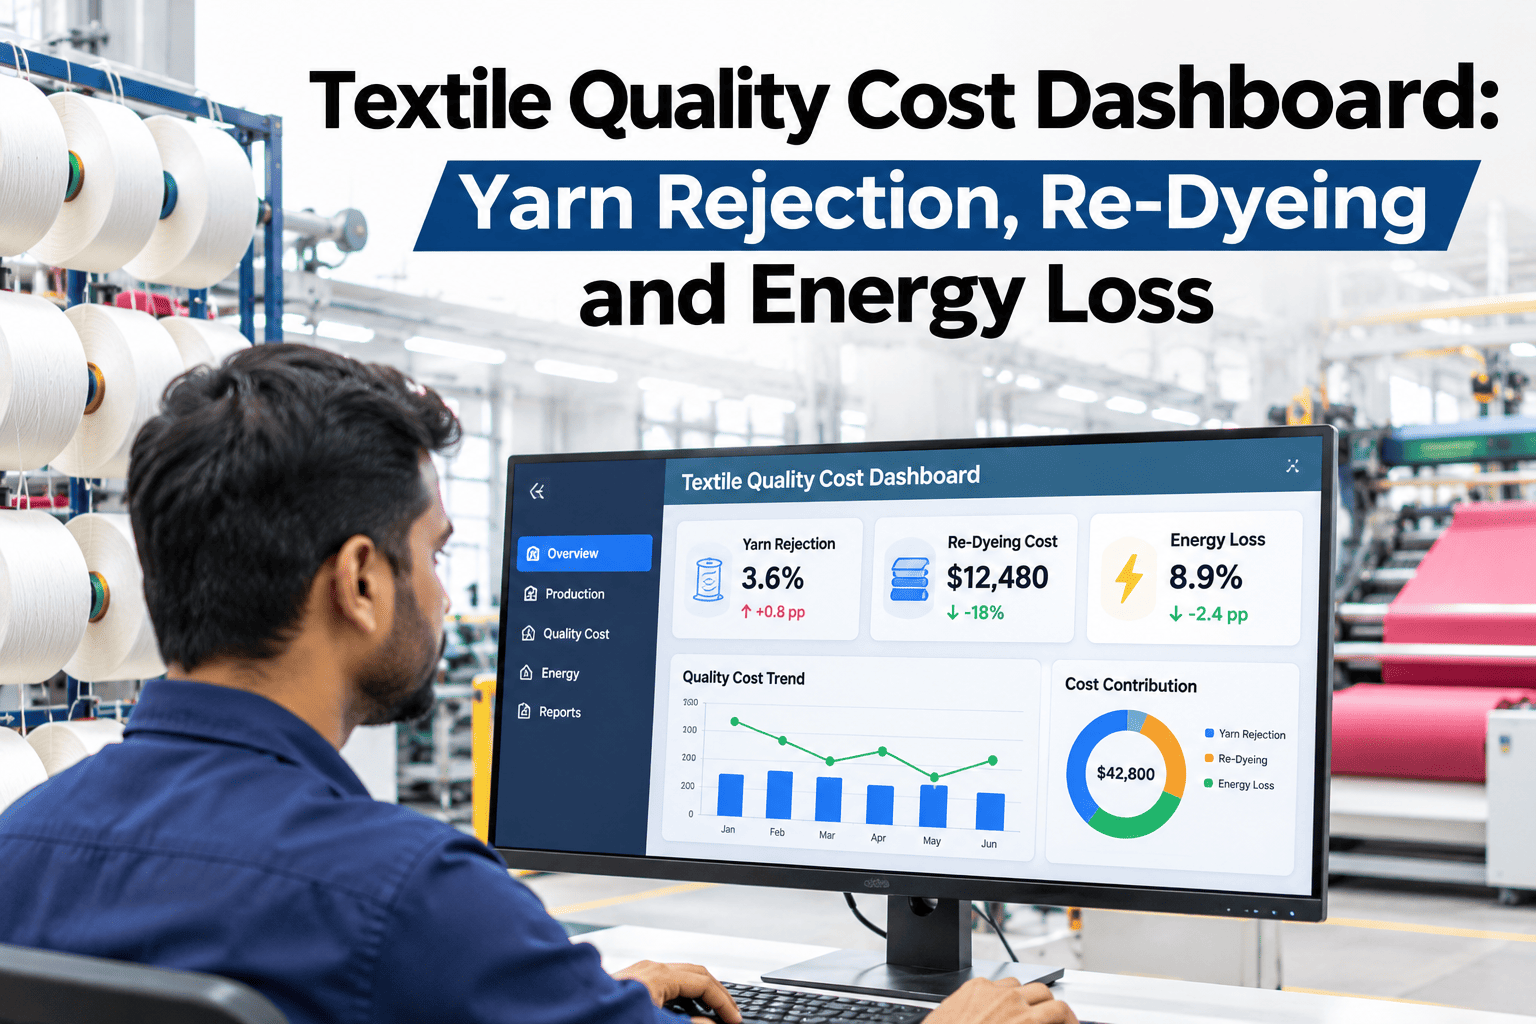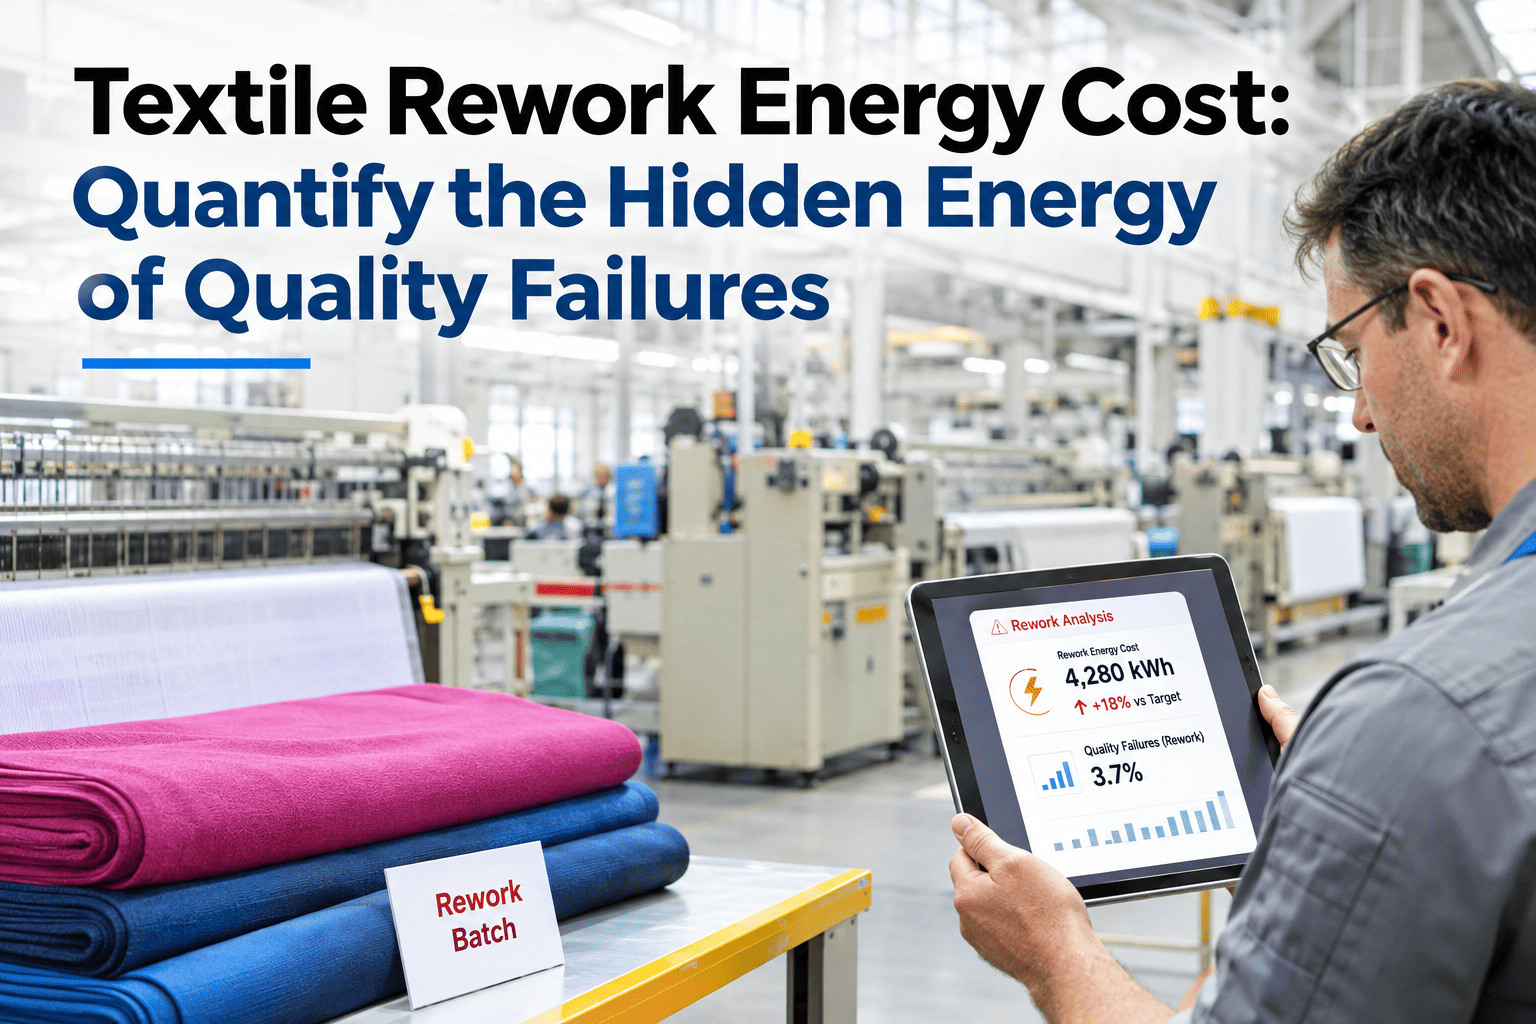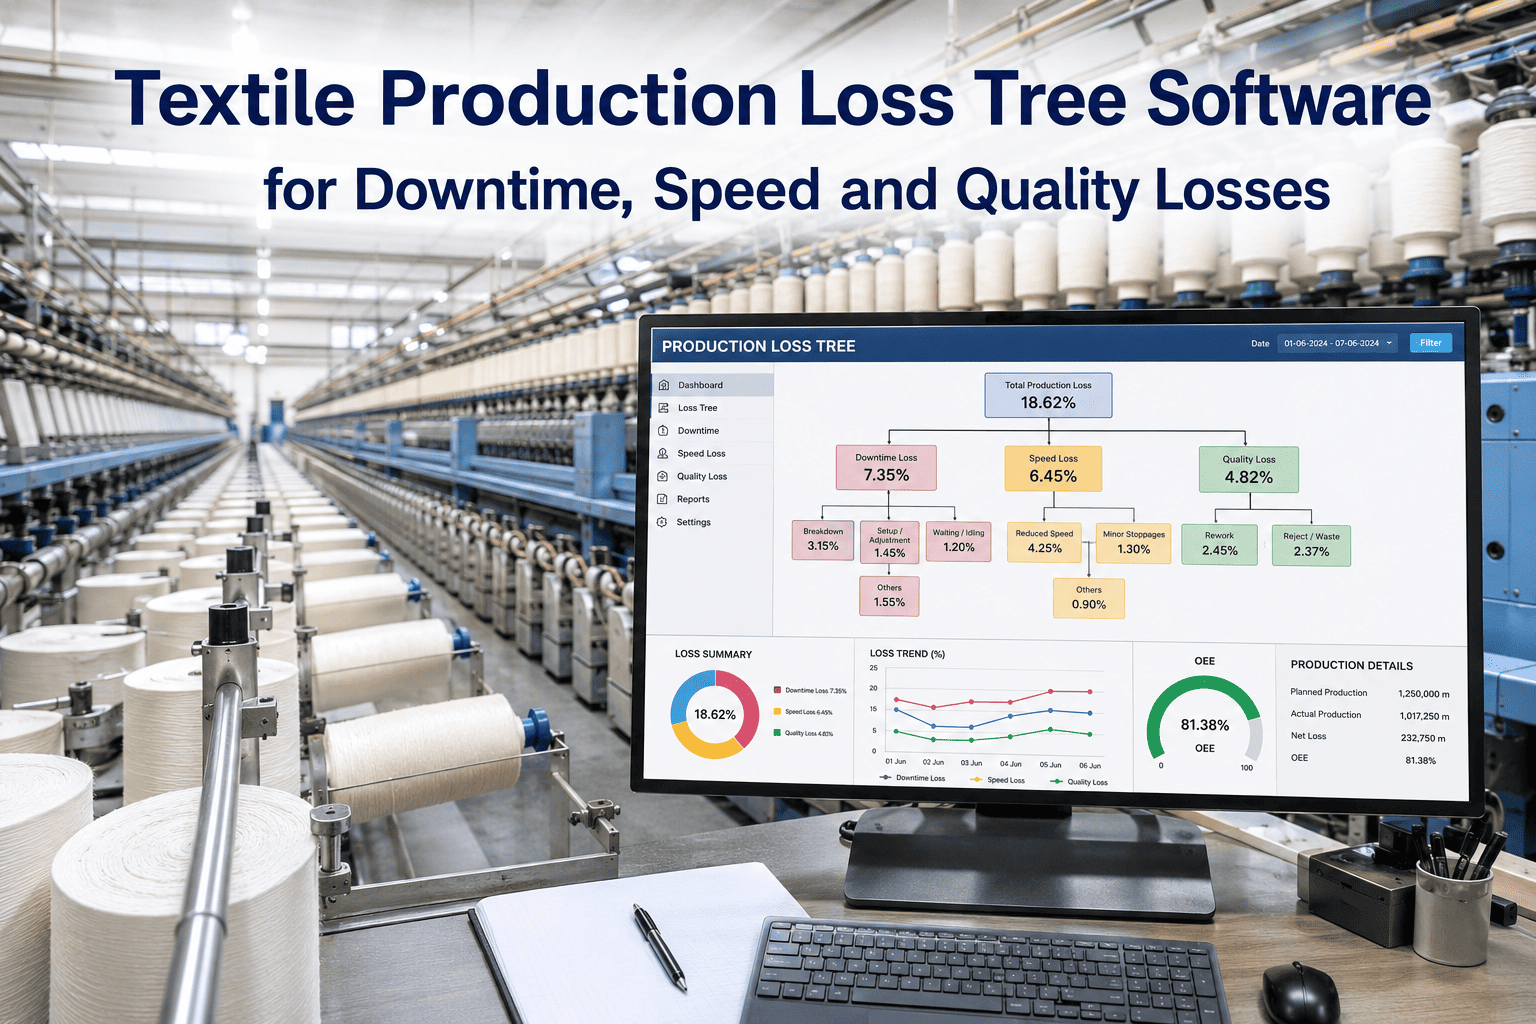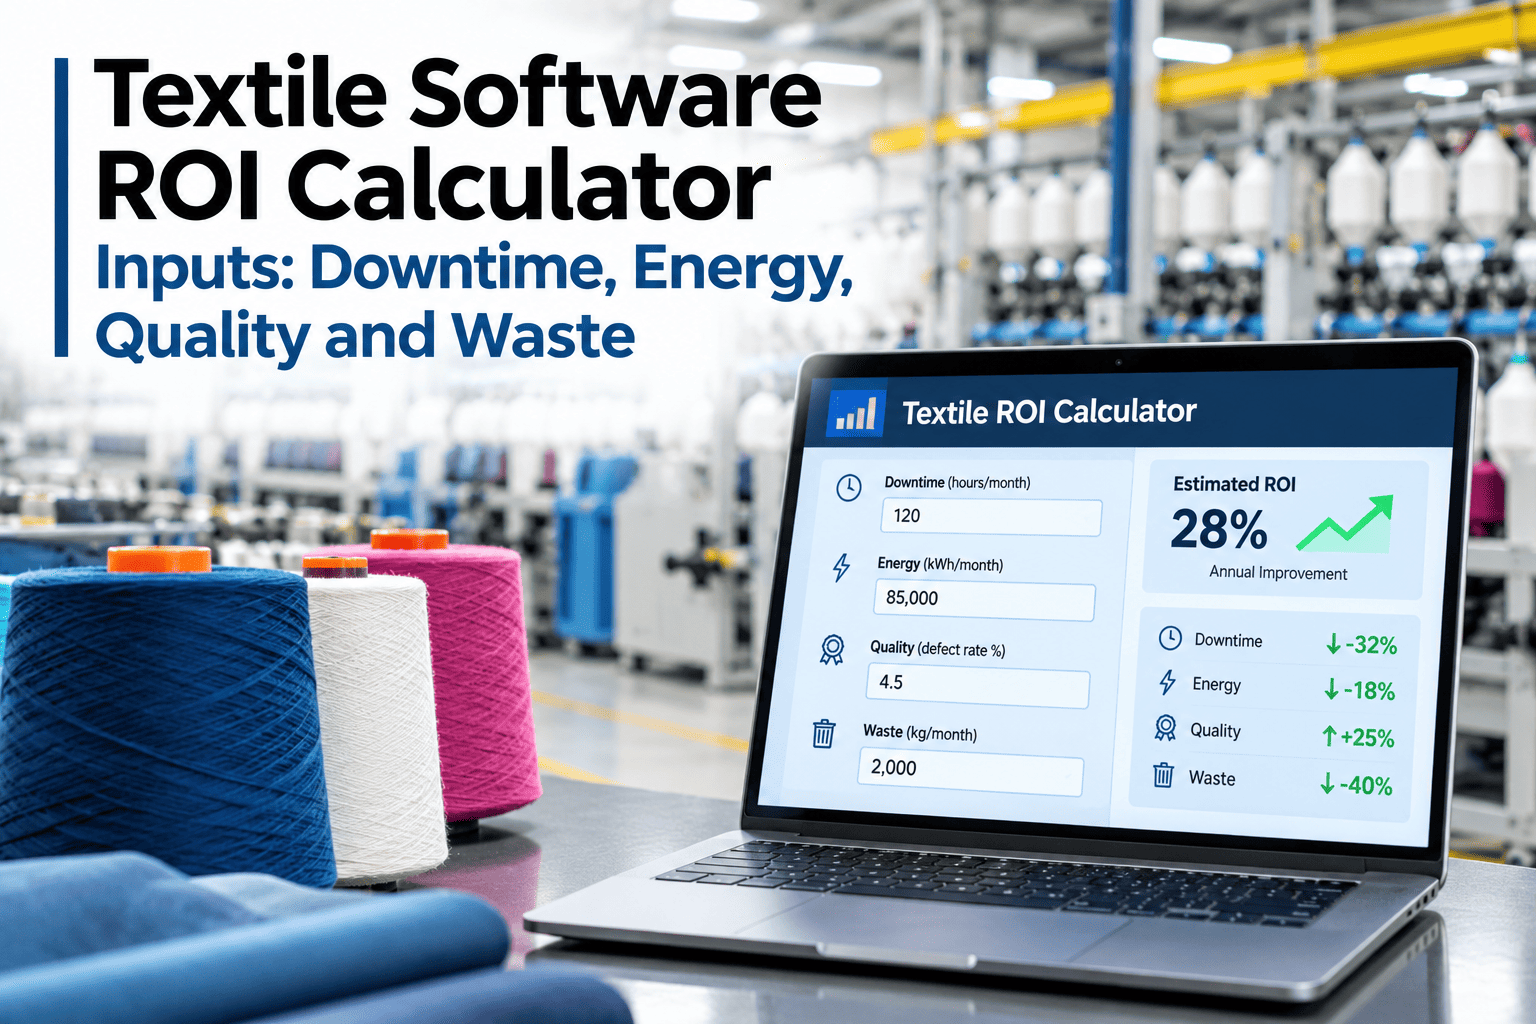
A textile software ROI conversation fails before it starts when the numbers on the table are too thin. "We expect 10% downtime reduction" is not a business case — it is a hope. A credible ROI model for a textile mill names the specific cost streams being addressed (downtime by department, re-dyeing cost per month, yarn rejection value, energy waste per machine group), applies realistic improvement percentages derived from comparable deployments, and shows the resulting cash flow against the investment. Getting these inputs right is what separates an ROI model a CFO will sign off on from one that gets sent back for revision. Teams that want to build this model for their specific mill can review an ROI framework with iFactory AI's textile team using real mill data.
Build a Textile Software ROI Model That Your CFO Will Believe
iFactory AI's ROI framework covers downtime cost, yarn rejection losses, energy waste, re-dyeing, maintenance cost, quality rejection, and recovered production capacity — with input ranges and improvement benchmarks grounded in textile mill deployments.
Why Textile Software ROI Models Get Rejected — and What to Fix
Most textile software ROI presentations fail at the financial review stage because they make the same structural errors. Understanding these errors is the first step to building a model that holds up.
Input 1: Downtime Cost — How to Calculate It for Your Mill
Unplanned machine downtime is typically the largest addressable cost in a spinning or dyeing operation. The calculation must capture both the direct production loss and the downstream recovery cost.
For a 20,000-spindle mill producing at 400kg/hr with a net margin of ₹80/kg, 50 hours of monthly unplanned downtime costs approximately ₹16 lakh per month in lost production — before recovery costs. Ask the iFactory AI team to review your downtime cost calculation before entering it in the ROI model.
Use Your Actual Downtime Data in the ROI Model
Share your average monthly downtime hours and production rate and iFactory AI's textile team will calculate the downtime cost input for your ROI model in a 30-minute session.
Input 2: Yarn Rejection and Material Loss
Yarn rejection cost in a spinning mill is not simply the rejected kilogram value. It carries the full processing cost — fiber, blending, carding, draw frame, ring frame labor and energy — up to the point of rejection. The correct rejection cost is the total absorbed cost per kg, not just the raw fiber price.
A mill rejecting 300kg per month at an absorbed cost of ₹120/kg loses ₹36,000/month minimum from yarn quality failures — before rework labor or customer complaint costs are added.
Input 3: Re-Dyeing Cost — The Most Underestimated ROI Stream
Re-dyeing cost is consistently the most underestimated ROI input in textile software evaluations because most mills only count the direct chemical cost of the correction batch. The full re-dyeing cost multiplier is 1.5–2.5× the original dyeing cost once all streams are included.
Input 4: Energy Waste — Calculating the Addressable Portion
Not all energy cost is addressable — some is inherent to the process. The ROI-relevant energy cost is the gap between current consumption and the best-performing period in the last 12 months on the same count and machine, adjusted for production volume. This gap is the addressable waste.
Input 5: Maintenance Cost Reduction
Maintenance cost reduction from predictive maintenance software comes from three sources: avoided emergency repair costs (which carry labour premium, spare part rush delivery, and production downtime), extended component life from optimised maintenance intervals, and reduced inventory carrying cost from better spare part planning.
| Saving source | How to quantify it | Typical improvement range |
|---|---|---|
| Emergency repair avoidance | Emergency work orders per month × (emergency cost − planned cost per event) | 30–50% of emergency events converted to planned |
| Component life extension | Traveller, apron, cot change intervals extended by condition-based trigger vs time-based | 10–20% extension in component change interval |
| Spare parts inventory | Reduction in emergency spare parts held as buffer; improved order lead time | 5–15% reduction in inventory value |
Building the Full ROI Model: Structure and Payback Period
Once all five input streams are quantified, the ROI model structures them against the investment cost and expected deployment timeline to produce a payback period and 3-year net benefit. The model should be conservative in improvement assumptions — use the low end of the improvement range, not the high end.
Teams that want iFactory AI's team to run this model using their specific mill parameters can book an ROI modelling session and walk through the full 3-year cash flow.
Frequently Asked Questions
What is the most important ROI input to get right in a textile mill?
Re-dyeing cost is the most important and most commonly underestimated input. Because most mills record only the chemical cost of a re-dyeing event, they systematically undervalue the saving — often by a factor of two. Getting the full re-dyeing cost right (chemicals + water + steam + machine time + delay impact) makes the dyeing AI use case the fastest-payback investment in most textile software ROI models. Book a session to calculate your mill's full re-dyeing cost.
How do we account for the ramp-up period in the ROI model?
Structure the cash flow in three phases: Phase 1 (Months 1–3) generates minimal saving as connectivity and data collection are established. Phase 2 (Months 4–6) generates 30–40% of full annual saving as the first models go live. Phase 3 (Month 7+) generates the full annual saving rate. The payback period should be calculated from the investment date against this phased cash flow — not from Month 1 at full saving rate. iFactory AI provides historical deployment data to calibrate these ramp rates for your specific use case mix. Ask the support team for typical ramp-up cash flows from comparable textile deployments.
Should we include energy savings in the primary ROI case or treat them as secondary?
Include energy savings in the primary ROI case only if your mill has machine-level energy meters that allow the saving to be measured and attributed. If energy data is only available at the main meter level, energy savings are difficult to prove and should be treated as a secondary (upside) benefit in the ROI model. For mills with sub-metering, energy saving typically represents 15–25% of total software ROI — significant enough to include but not the primary driver. Review your mill's energy metering readiness in an ROI planning session.
What payback period is typical for textile AI software like iFactory AI?
Payback periods vary by mill size, number of use cases deployed, and the magnitude of the addressable cost streams. Mills with high re-dyeing rates and significant unplanned downtime typically achieve payback within 9–15 months. Mills deploying primarily for energy monitoring or compliance may see longer payback periods of 18–24 months but with lower risk profiles. The iFactory AI ROI framework is designed to calculate a mill-specific payback period rather than apply an industry average. Ask the team about typical payback periods for mills similar to yours.
Can the ROI model be used to compare different software options?
Yes — and this is one of the most valuable applications of a rigorous ROI model. When evaluating multiple textile software platforms, the same input assumptions applied consistently across options reveal which platform addresses the highest-value cost streams and at what deployment cost. The comparison should include not only the licence cost but the full deployment cost (hardware, integration, training) and the annual running cost (subscription, support, maintenance). iFactory AI provides a structured vendor comparison framework as part of the ROI planning session. Book a comparison framework session with iFactory AI's textile team.
Build a Textile Software ROI Model Your Board Will Act On
iFactory AI's textile team will run the full ROI model for your mill using your actual downtime, re-dyeing, rejection, and energy data — producing a phased 3-year cash flow with payback period.