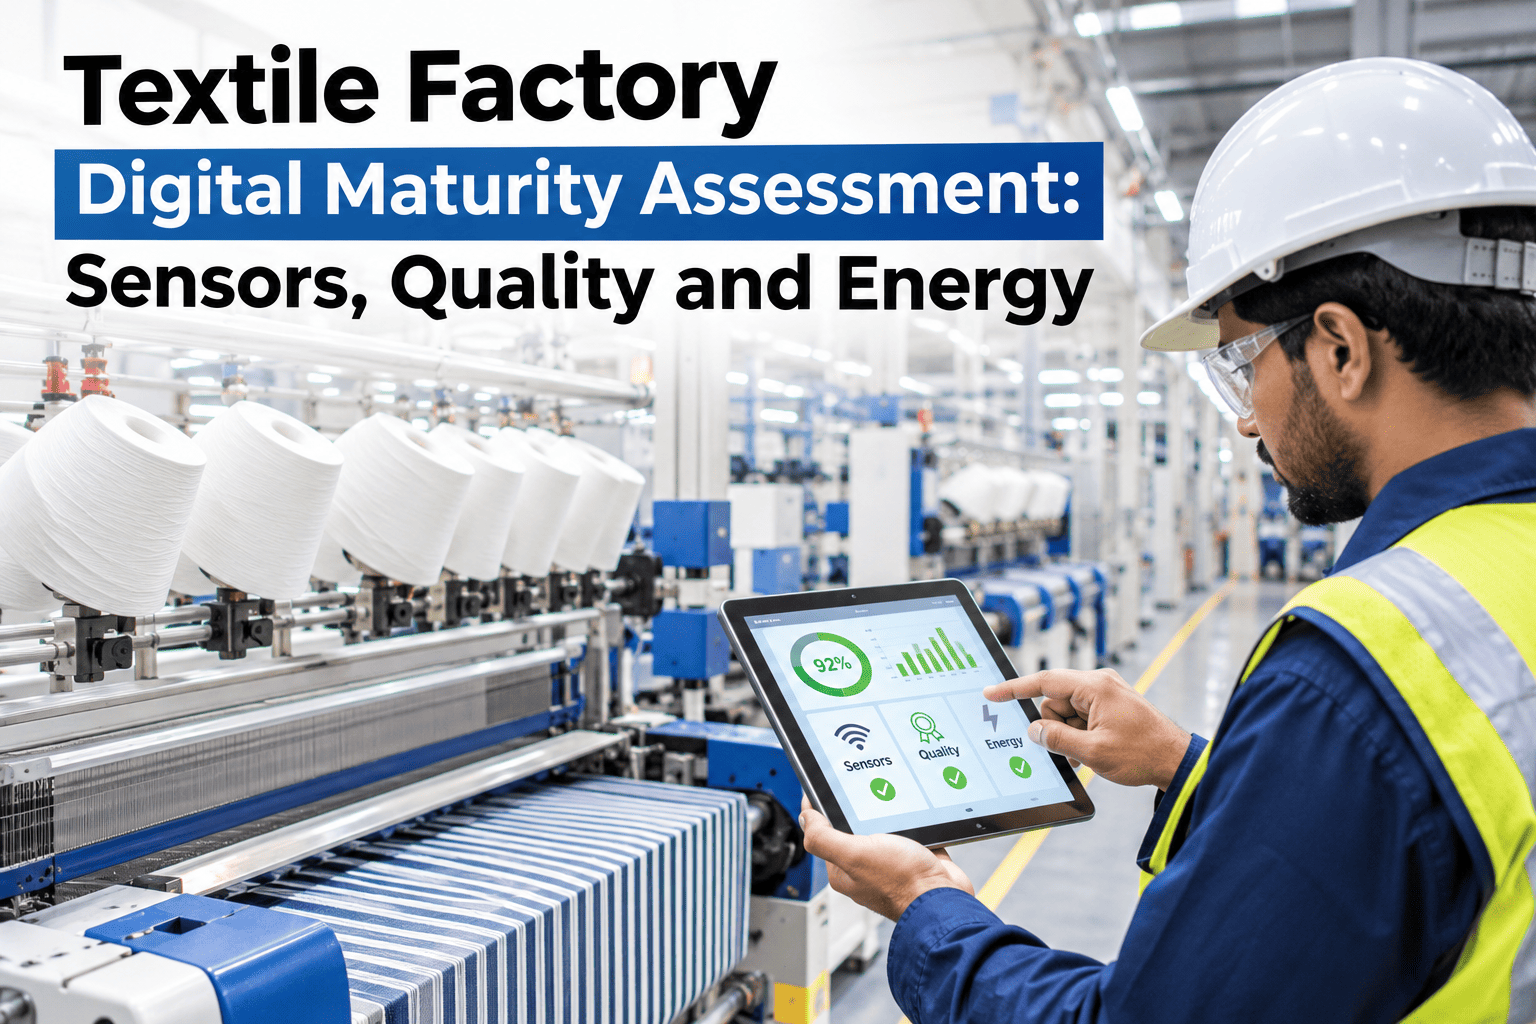
Digital transformation in textile manufacturing has no universal starting line. Some mills already stream PLC data from every ring frame; others still record production on paper shift cards. A digital maturity assessment does not judge where a mill is — it maps exactly what is connected, what is monitored, and what decisions are still made without data, so improvement investment goes to the gaps that cause the most operational loss. iFactory AI runs this assessment for textile mills as a structured process, and teams that want to understand where their operation stands can book a digital maturity review session with iFactory AI's textile team.
Know Exactly Where Your Textile Mill Stands on the Digital Transformation Map
iFactory AI's textile maturity assessment covers machine sensors, predictive maintenance, yarn quality data, energy monitoring, dyeing controls, dashboards and connected workflows — with a scored gap analysis and prioritised roadmap.
What Is a Textile Factory Digital Maturity Assessment?
A textile factory digital maturity assessment is a structured evaluation of how thoroughly a mill has connected its machines, processes, quality systems, and energy infrastructure to digital data collection, analysis, and decision support. It covers five domains: machine connectivity, maintenance practices, quality data systems, energy monitoring, and management reporting. The result is a score for each domain, a gap analysis against best-practice benchmarks, and a prioritised implementation roadmap.
The Five Maturity Levels for Each Domain
Every domain in the assessment is scored on a five-level scale. Level 1 represents manual, paper-based operation; Level 5 represents AI-driven autonomous optimisation. Most textile mills score unevenly across domains — advanced in one area and manual in another.
| Level | Machine connectivity | Maintenance | Quality data | Energy |
|---|---|---|---|---|
| 1 — Paper | No sensors; counts recorded manually | Fully reactive; no PM schedule | Uster tests filed on paper; no trends | Main meter only; manual monthly read |
| 2 — Digital records | Counts logged in spreadsheet; no live feed | PM schedule in CMMS; compliance not tracked | Uster data in spreadsheet; not linked to machines | Sub-meters; daily manual readings in log |
| 3 — Connected | Ring frame PLC streaming breaks + efficiency | CMMS work orders with PM compliance tracking | Uster data feed to QMS; trended by machine | Automatic sub-meter data; kWh/kg calculated |
| 4 — Analytics | Live OEE + downtime analysis; shift alerts | Vibration / temperature sensors; condition triggers | Uster percentile alerts; defect-to-machine mapping | Energy KPIs on dashboard; anomaly alerts |
| 5 — AI-driven | AI predicts quality deviation before it occurs | AI predicts failures; auto-generates work orders | AI links Uster faults to drafting parameters live | AI optimises energy use in real time by count |
Find Out Which Level Your Mill Scores Across All Five Domains
iFactory AI's textile team runs a structured maturity assessment and delivers a scored gap analysis with a prioritised implementation roadmap.
Sensor Readiness Checklist for Textile Machines
Machine sensor readiness is typically the first barrier to digital transformation in a textile mill. A ring frame built in 2010 may have a PLC but no data export capability; a draw frame may have an autoleveller with its own controller that does not share data with any external system. The checklist below maps sensor readiness for key textile machines.
iFactory AI includes a Greenfield Consulting service that designs the sensor architecture for mills moving from Level 2 to Level 3+, covering network, cabling, PLC integration, and sensor selection. Ask the support team about sensor readiness for your specific machines.
Common Maturity Gaps in Textile Mills and Their Impact
Across textile mill assessments, the same gaps appear repeatedly. Each gap has a measurable operational impact — which makes it possible to quantify the value of closing it before investing in a solution.
Textile Digital Transformation Roadmap: From Assessment to AI
A maturity assessment is not useful unless it produces a roadmap. The phases below represent a typical textile mill progression from paper-based operation to AI-assisted production — each phase building on the data infrastructure of the one before.
Frequently Asked Questions
How long does a textile digital maturity assessment take?
A structured assessment covering all five domains typically takes 2–3 days on-site for a mill of 20,000–50,000 spindles with a single dyeing department. Smaller mills with simpler operations can complete it in a day. The output — a scored domain assessment, gap analysis, and prioritised roadmap — is delivered within one week. Book an assessment session with iFactory AI's textile team to understand what the process looks like for your mill size.
What is the most important domain to improve first in a typical textile mill?
In most textile mills, machine connectivity is the highest-priority first step because it is the data foundation for every other domain. Without live machine data, quality analytics, energy monitoring, and predictive maintenance are all limited to manual inputs. Ring frame PLC integration typically delivers visible results within the first month because yarn break data alone identifies the top-performing and worst-performing machines and shifts. Ask the iFactory AI support team what a PLC integration project looks like for your machine type.
Our mill has mixed machines — some with PLCs, some without. How does the assessment handle this?
A mixed-connectivity environment is the most common situation in textile mills, particularly those with machines from different generations and manufacturers. The assessment scores connectivity at machine type level, not mill level, so the gap is mapped specifically — which machines need a PLC retrofit, which need a gateway device, and which can connect directly. iFactory AI's Greenfield Consulting team designs the architecture for mixed environments as part of the deployment scope. See how iFactory AI handles a mixed-connectivity textile mill in a walkthrough.
What is the difference between Industry 4.0 and AI in a textile mill context?
Industry 4.0 describes the connectivity layer — sensors, PLCs, networks, and data collection that make a machine digitally visible. AI is what happens with that data once it is collected — predicting failures before they occur, detecting quality deviations from parameter patterns, and optimising energy use by count and shift. Industry 4.0 without AI produces dashboards. AI without Industry 4.0 connectivity has no data to work with. iFactory AI deploys both together on a single on-premise NVIDIA server. Ask the team how the connectivity and AI layers work together in a textile deployment.
How is iFactory AI different from a standard MES for textile mills?
A standard MES records production data and tracks job orders. iFactory AI goes further by applying machine learning to the data to predict quality deviations, estimate failure risk, and recommend process adjustments — all running on-premise on NVIDIA GPU hardware with no cloud dependency. For mills with data sovereignty requirements or in locations with unreliable internet, the on-premise deployment is a critical differentiator. Book a demo to see the textile AI capabilities beyond standard MES.
Start Your Digital Transformation With a Clear Map of Where You Are
iFactory AI's textile maturity assessment gives you a scored baseline, a gap analysis, and a phased roadmap — all grounded in your mill's actual machines, data, and operating conditions.