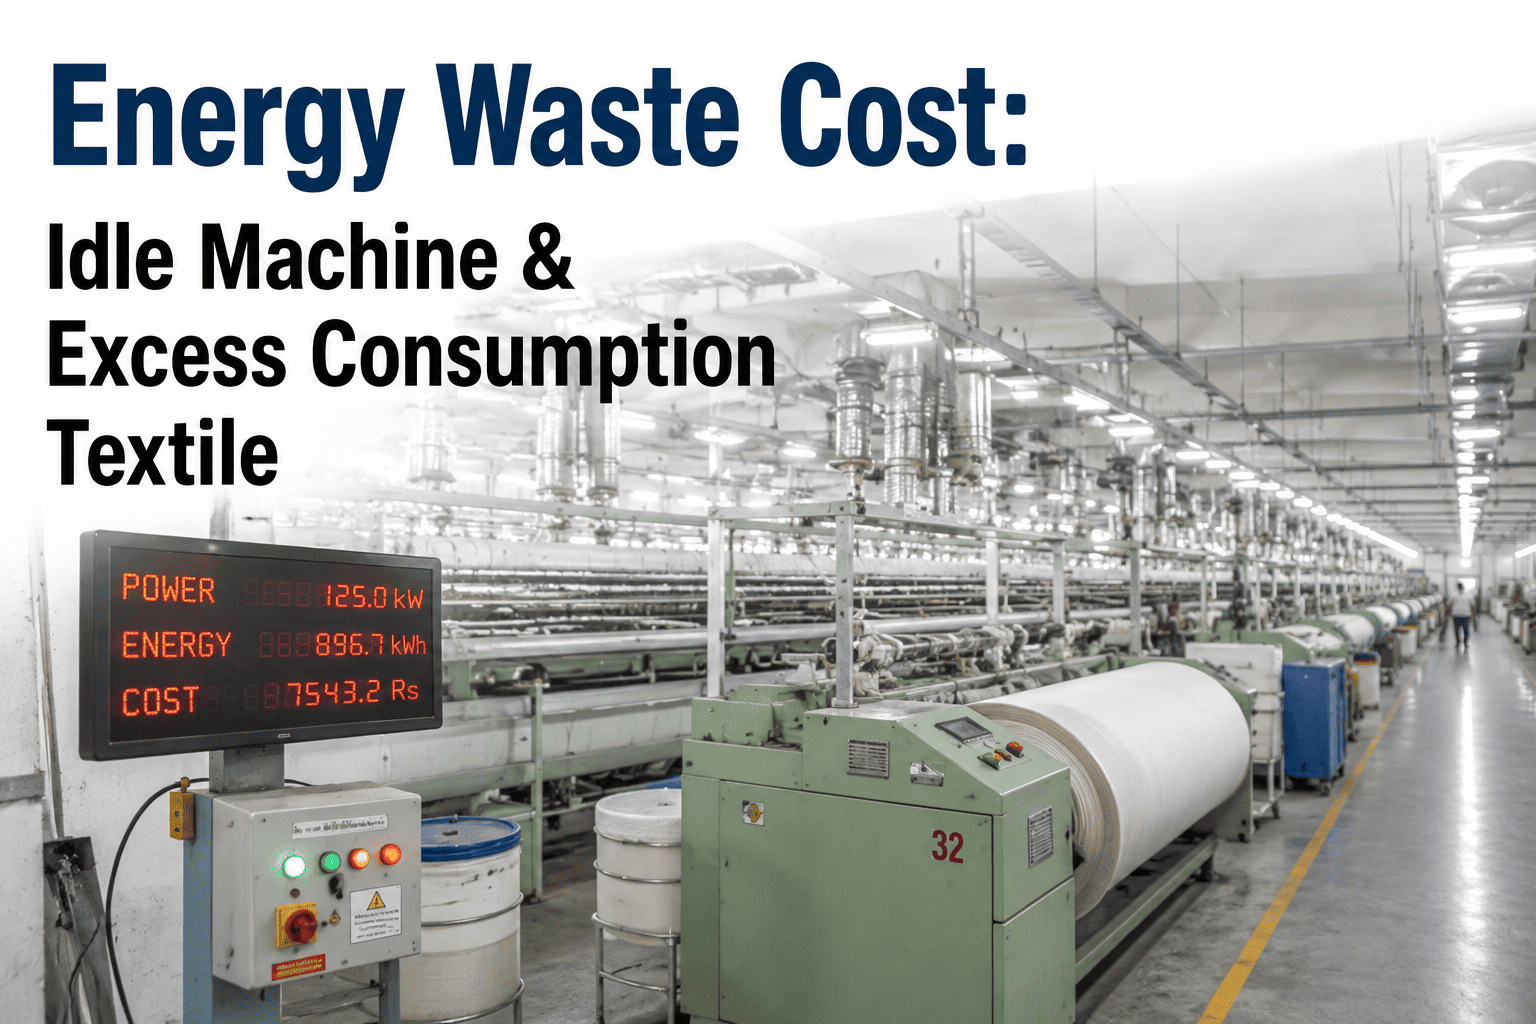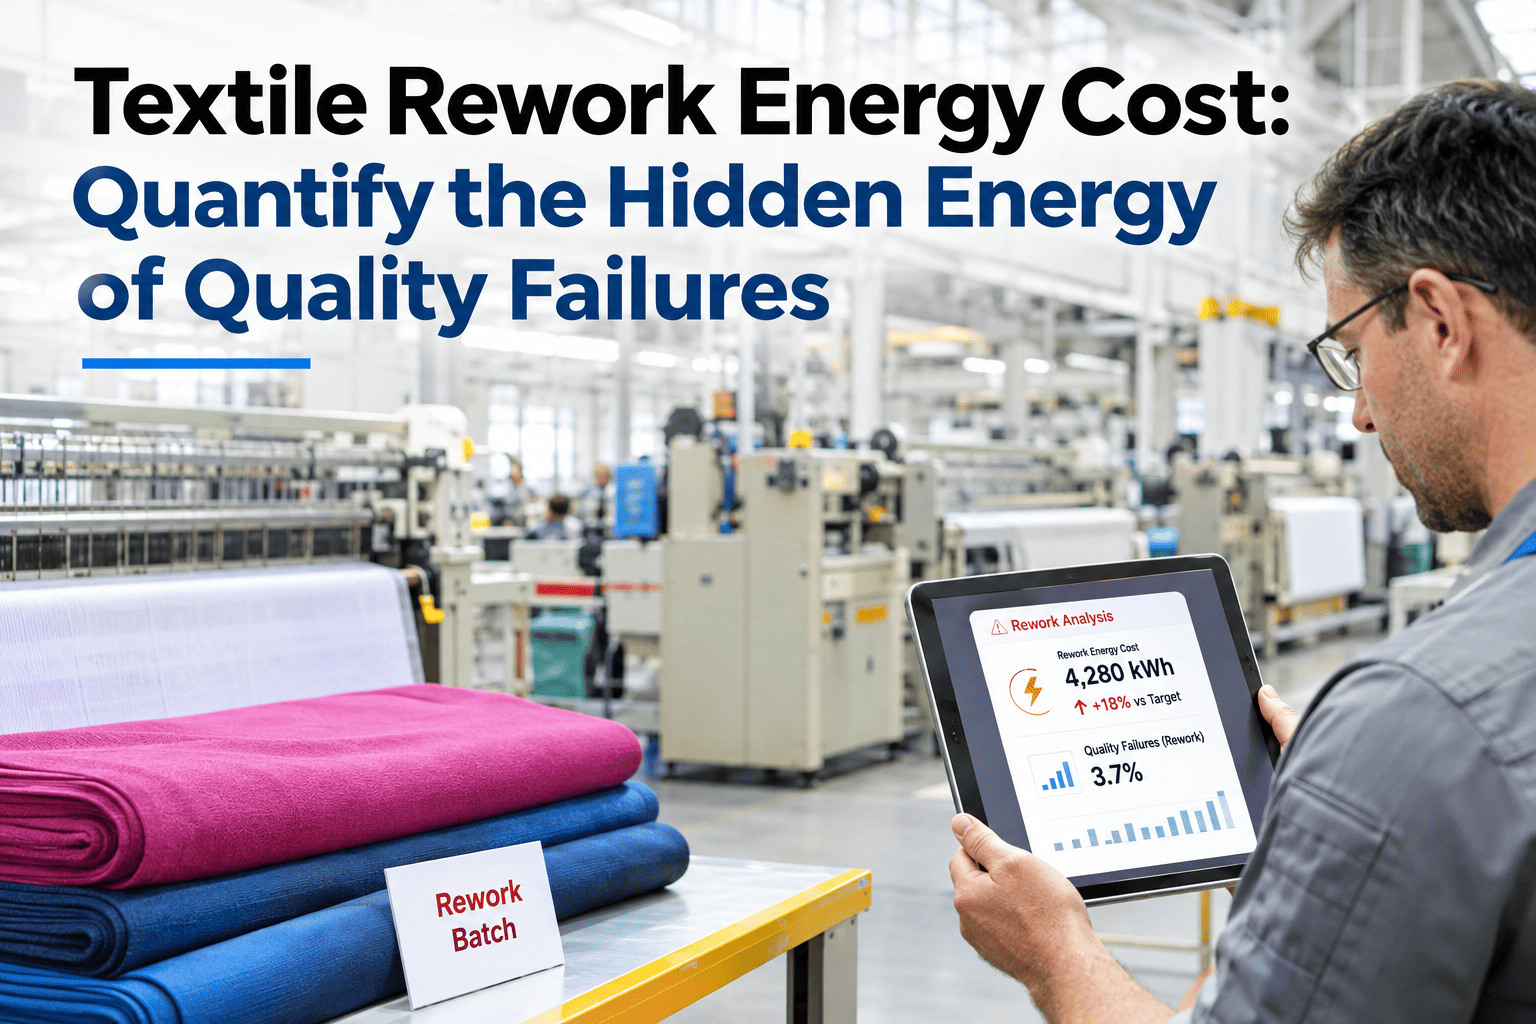
When a dyeing batch fails a shade assessment, the conversation in most mills goes straight to the chemistry: adjust the recipe, re-run the batch, pass on the second attempt. What almost never enters that conversation is the energy the rework just consumed — the full boiler load for a second heating cycle, the compressed air for the corrective wash, the chemical heating for the auxiliary bath, the machine time that could have been used for a fresh batch. Rework is not just a quality failure; it is a hidden energy and cost event that sits off the main energy monitoring dashboard. iFactory AI quantifies that hidden cost per rework event and surfaces it alongside the quality record so engineers can see the full resource bill of every quality failure, not just the shade deviation.
Your Re-Dye Log Is Also an Energy Waste Log. Have You Ever Calculated It?
iFactory AI quantifies the electricity, steam, water, chemicals, and machine time consumed by every rework event — making the total cost of quality failure visible for the first time.
What Is the Hidden Energy Cost of Textile Rework?
The hidden energy cost of textile rework is the electricity, steam, water, and chemical energy consumed during reprocessing activities — re-dyeing, corrective washing, shade adjustment, fabric stripping — that do not appear on any production energy KPI because they are recorded under quality, not production. In most mills, the energy consumed on rework is counted in the same batch total as productive consumption, so the rework cost is permanently buried in the per-kg efficiency figure.
What Resources Does Each Rework Event Actually Consume?
The full resource picture of a rework event goes well beyond the obvious chemical cost. Five resource streams are consumed on every re-dye or corrective processing run, and all five carry a measurable cost.
When these five resource streams are summed at today's utility and chemical prices, the per-event cost of a re-dye is typically 1.8–2.5 times the cost of the original batch — not 1.0 as most quality cost models assume. Teams who want to run this calculation on their own substrate and batch data can get a rework cost per batch estimate from our textile quality team.
Know the Real Cost of Every Re-Dye Before the Next Management Meeting
iFactory AI links your quality failure records to your energy and resource meters — so the total cost of rework is calculated automatically, by batch and by substrate. Book a session to see this on your own data.
Why Rework Energy Is Invisible on Most Textile Dashboards
The core problem is that energy monitoring and quality management systems in most mills are separate. The energy dashboard shows kWh and steam per shift or per kg — but it has no concept of whether a batch was first-pass or a re-run. The quality system records the shade assessment outcome — but it has no concept of the energy that outcome cost. Without a data layer that joins the two systems on a shared batch ID, the rework energy cost is structurally invisible.
iFactory AI, an on-premise AI platform for textile manufacturing, closes this gap by using the batch ID as a join key across the energy, production, and quality data streams — so every re-dye or corrective batch carries a complete resource cost tag, not just a quality disposition.
How to Calculate Textile Rework Energy Cost — The Method
The calculation requires four data inputs joined at the batch level. Once the join is in place, the rework cost is calculated automatically for every event going forward.
Textile Rework Energy Cost — A Reference Comparison
The table shows illustrative rework energy and resource costs for common textile processes. Actual figures depend on machine size, substrate, and utility rates.
| Process | Rework type | Additional steam (kg) | Additional electricity | Water (litres/kg) | Total cost multiplier vs original |
|---|---|---|---|---|---|
| Exhaust dyeing — cotton | Full re-dye | 1,200–2,000 | Full cycle | 80–120 | 1.8×–2.4× |
| Exhaust dyeing — polyester | Shade correction | 600–1,200 | Partial cycle | 40–80 | 1.4×–1.8× |
| Stenter finishing | Re-pass | Minimal (gas) | Full pass energy | Minimal | 1.6×–2.0× |
| Continuous washing | Re-wash | 400–800 | Full pass energy | 60–100 | 1.5×–1.9× |
The dyeing process has the highest rework multiplier because it requires the most energy-intensive thermal cycle — the re-dye is effectively a second batch with all associated inputs. This is why reducing first-pass rate failure in dyeing delivers a disproportionately large energy saving relative to the volume of batches saved.
Where iFactory AI Fits in Rework Cost Visibility
iFactory AI connects the quality, energy, and production data streams that normally sit in separate systems — batch management, quality lab, energy meters, chemical dosing — using the batch ID as the shared key across all systems. The rework energy cost is calculated per event, aggregated by substrate and failure mode, and presented in a weekly cost-of-quality dashboard that operations and quality teams can act on without building their own data joins.
Frequently Asked Questions
How large is the energy cost of rework relative to total dyeing energy?
In a dye house with a 6–8% re-dye rate — which is not uncommon for a mill processing a wide shade range — rework steam consumption can represent 10–14% of total dyeing steam, because each re-dye consumes a full or near-full heating cycle. At a re-dye rate above 10%, the energy cost becomes a material sustainability and cost issue in its own right. iFactory AI's steam classification layer calculates this share accurately from your own batch data. Get a rework steam share estimate for your current re-dye rate.
Can rework energy cost data be used to build a business case for quality improvement?
Yes — and this is precisely the most valuable application of the analysis. A quality improvement programme targeting a specific failure mode (shade deviation on deep shades, for example) can be justified by the avoided rework energy and resource cost per percentage point of improvement in first-pass rate. This converts a quality metric into a financial one that is legible to operations and finance leadership. Ask our team how to structure a rework cost business case.
Does the rework energy calculation account for shade adjustments, or only full re-dyes?
iFactory AI classifies rework events by type — full re-dye, shade correction, top-up addition, corrective wash — and calculates the energy cost appropriate to each type. A shade correction that runs a 90-minute addition cycle does not consume the same steam as a full 5-hour re-dye, and the system reflects this. Each event type has its own energy allocation based on the actual machine timestamps and meter readings. See how different rework event types are classified and costed.
What is the relationship between rework energy cost and sustainability reporting?
Rework energy is real Scope 1 and Scope 2 emissions — the steam boiler burns fuel, the motors draw grid electricity — regardless of whether the batch that consumed it passes quality. Including rework energy in sustainability reporting gives a more accurate picture of the emission intensity of production. More importantly, reducing first-pass failure rate is one of the highest-return decarbonization levers available to a dye house because it eliminates whole thermal cycles rather than incrementally improving them. Ask how rework emissions are tracked in iFactory's ESG module.
How does iFactory AI connect quality records to energy meters when they are in separate systems?
The connection uses the batch ID as the shared key. iFactory AI integrates with the batch management or ERP system to retrieve quality disposition by batch, and with machine PLCs or batch controllers to retrieve start and end timestamps. These timestamps are then used to window the energy meter data to that batch's operational period. If the batch management system does not use a consistent batch ID, iFactory AI's integration team maps the available identifiers during the deployment scoping phase. Review the integration approach for your quality and production systems.
The Re-Dye Register Is a Cost Statement. Start Reading It as One.
iFactory AI attaches a full resource cost — steam, electricity, water, chemicals, machine time — to every rework event in your dye house. Book a demo to see your own quality failure records converted into a cost-of-quality statement.