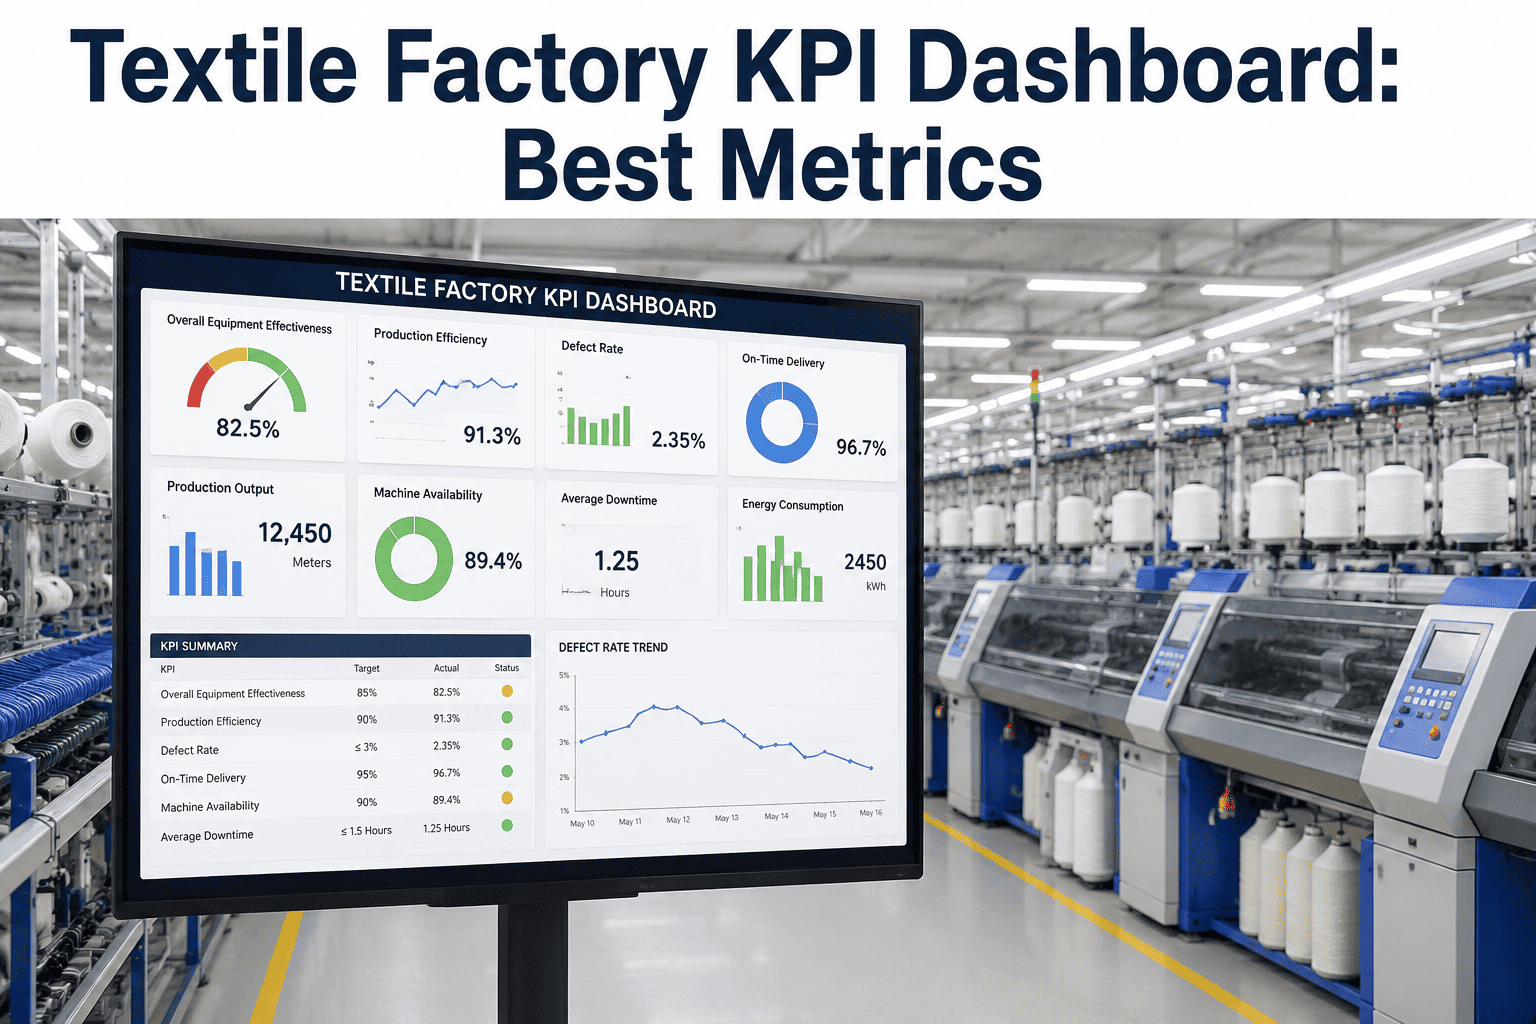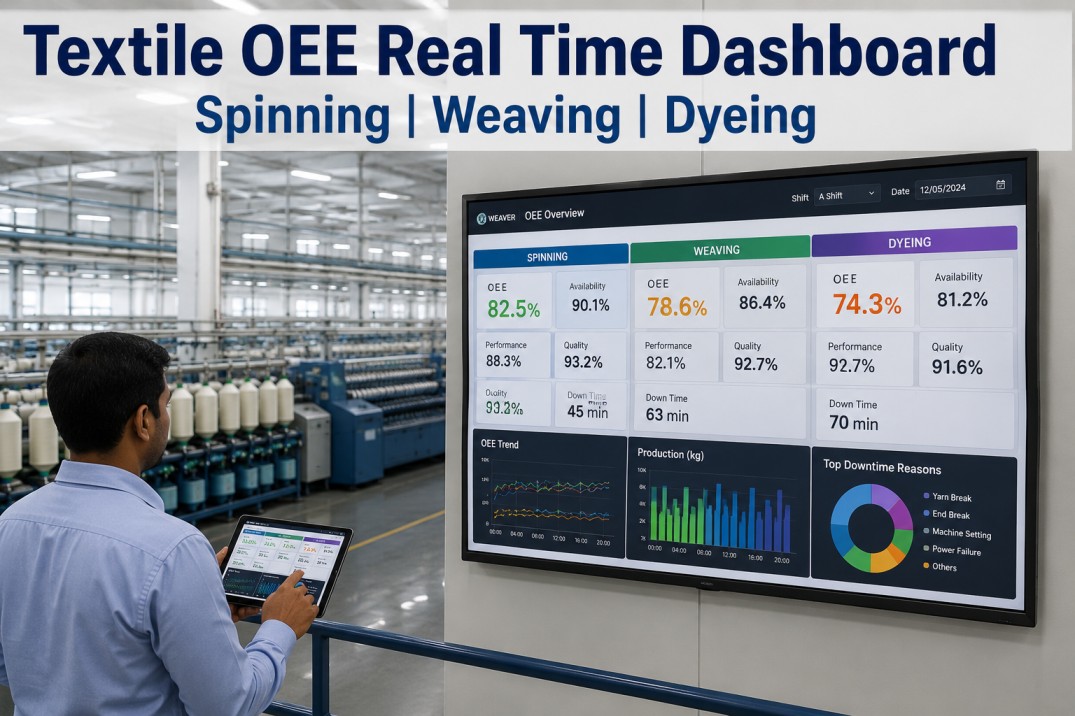
Textile manufacturing KPIs have one defining problem: the same metric name means different things in a spinning mill, a dyeing house, and a finishing plant. When a plant manager asks for "machine efficiency" and the spinning supervisor, dyeing supervisor, and energy manager each send a different number, decisions get made on the wrong data. A shared KPI dictionary — with precise definitions, units, calculation methods, and data sources for each metric — is the foundation that makes performance reporting reliable. Teams that want to build this for their own mill can review a KPI dictionary setup with iFactory AI's textile team.
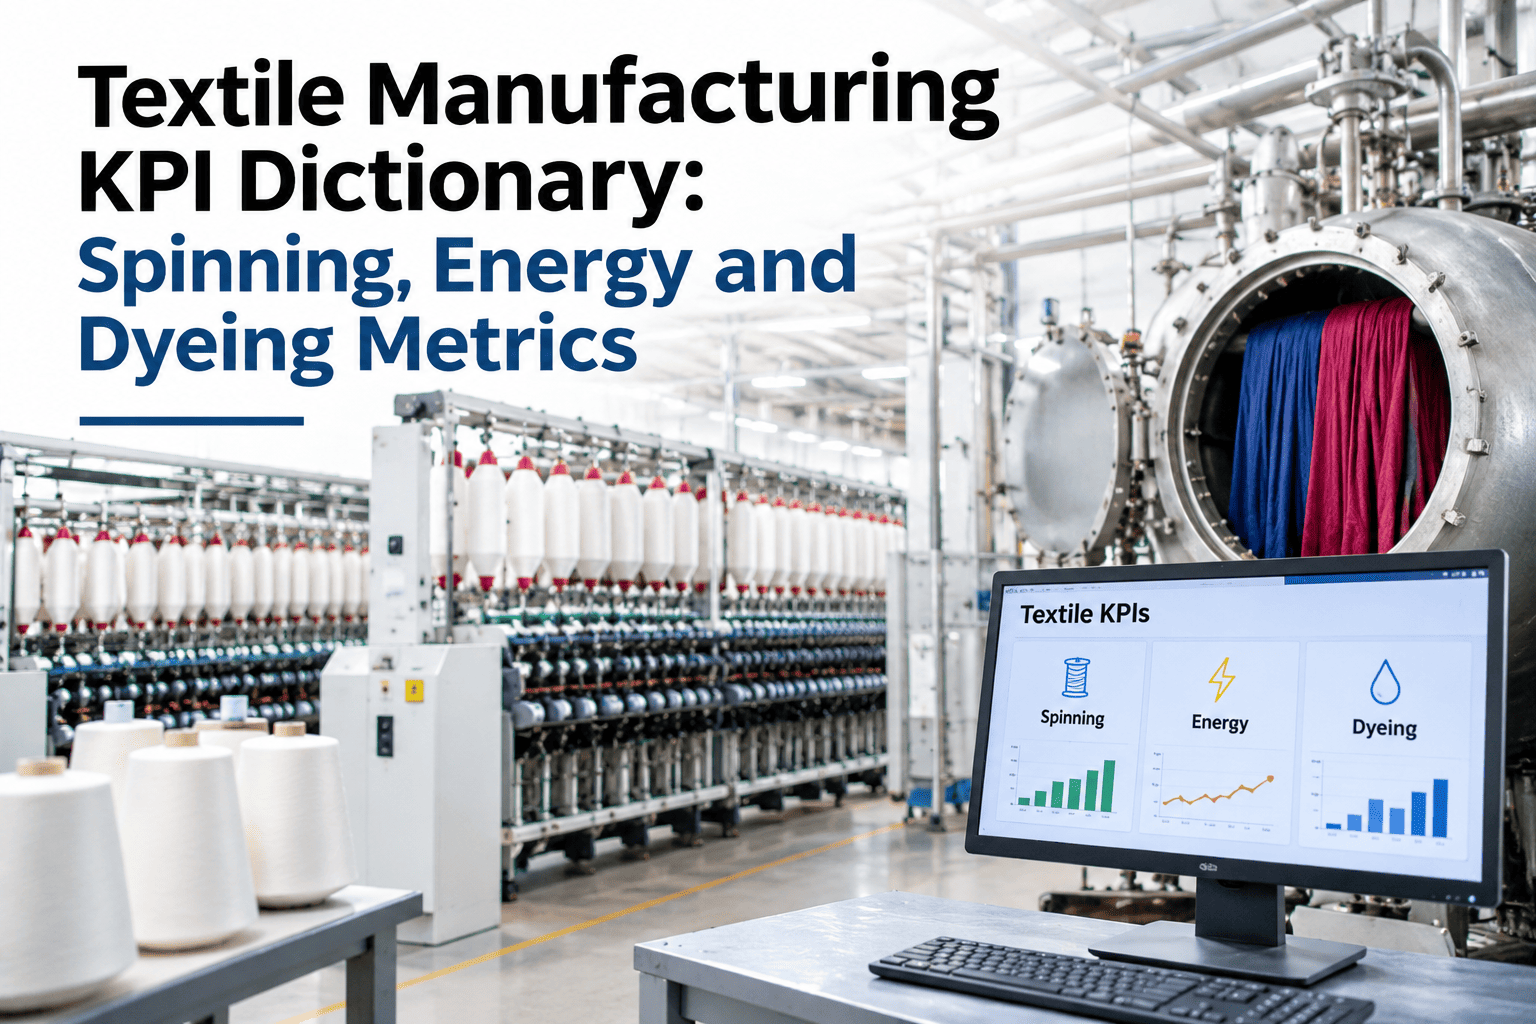
The Textile KPI Dictionary: Spinning, Energy and Dyeing Metrics Defined for Your Mill
Precise definitions, units, formulas and data sources for spindle health, yarn breaks, Uster quality, kWh per kg, stenter energy, boiler efficiency, dyeing RFT and shade rejection.
Why Textile KPI Definitions Must Be Precise
A textile mill can run on dozens of KPIs, but without agreed definitions each one is a source of disagreement rather than alignment. The same "efficiency" figure reported differently by production, quality, and energy teams makes benchmarking across shifts, machines, or months impossible.
Spinning KPIs: Definitions, Units and Calculation Methods
Spinning KPIs cover machine reliability, yarn quality, and production efficiency. Each metric below is defined with its calculation formula, standard unit, and recommended data source for iFactory AI integration.
| KPI | Definition | Unit | Formula | Data source |
|---|---|---|---|---|
| Yarn break rate | Number of end breaks on ring or open-end machines per unit of machine running time | Breaks / 1,000 spindle hours | Total breaks ÷ (spindles × running hours) × 1,000 | Ring frame PLC / break counters |
| Spindle efficiency | Percentage of spindles producing acceptable yarn vs total installed spindles over a shift | % | (Running spindles ÷ total spindles) × 100 | Ring frame PLC spindle status |
| Production rate per spindle | Actual yarn output per spindle per hour under real operating conditions | g / spindle / hour | Total kg produced × 1,000 ÷ (running spindles × hours) | MES production records |
| Traveller change interval | Actual hours between traveller changes vs standard interval for that count and speed | Hours | Actual interval vs planned interval | Maintenance logbook / CMMS work orders |
| Draw frame CV% | Coefficient of variation of sliver linear density measured at draw frame output | % | Standard deviation ÷ mean count × 100 | Online sliver monitor / Uster autoleveller |
| Machine utilization | Percentage of available shift time a spinning machine runs at intended speed | % | (Running time ÷ available time) × 100 | Ring frame PLC / MES downtime records |
Configure These KPIs in iFactory AI — Live From Your Spinning Machines
iFactory AI connects to ring frame PLCs, draw frame monitors, and MES records to calculate and display these spinning KPIs automatically — no manual data entry.
Yarn Quality KPIs: Uster Metrics Defined
Uster quality metrics are the textile industry standard for yarn evenness and fault characterization. Each metric has a precise meaning and a standard reporting format. Understanding what each measures — and what it does not — is essential for using Uster data to drive process decisions.
Teams using iFactory AI can configure Uster data feed integration to trigger alerts when any metric exceeds its percentile threshold, linking quality deviations to the specific machine and shift that produced the failing yarn. Ask the support team how Uster data integrates with the quality analytics module.
Energy KPIs for Textile Manufacturing: kWh/kg, Steam, and Stenter
Energy is typically the second-largest cost in a textile mill after raw material. Accurate energy KPIs require agreed denominators (gross vs net production), declared meter points, and consistent shift boundaries. The metrics below are the minimum set for meaningful energy tracking.
| KPI | Unit | Formula | Denominator note | Typical range |
|---|---|---|---|---|
| Spinning kWh per kg | kWh / kg | Ring frame kWh ÷ kg produced | Use net saleable output, not gross | 1.5–3.5 kWh/kg (varies by count) |
| Stenter kWh per kg | kWh / kg | Stenter total kWh ÷ kg fabric processed | Include idle heating time | 0.3–1.2 kWh/kg (varies by width, speed) |
| Stenter gas GJ per kg | GJ / kg | Gas consumed (GJ) ÷ kg fabric processed | Include oven pre-heat period | Benchmark vs Uster/BTRA norms by fabric type |
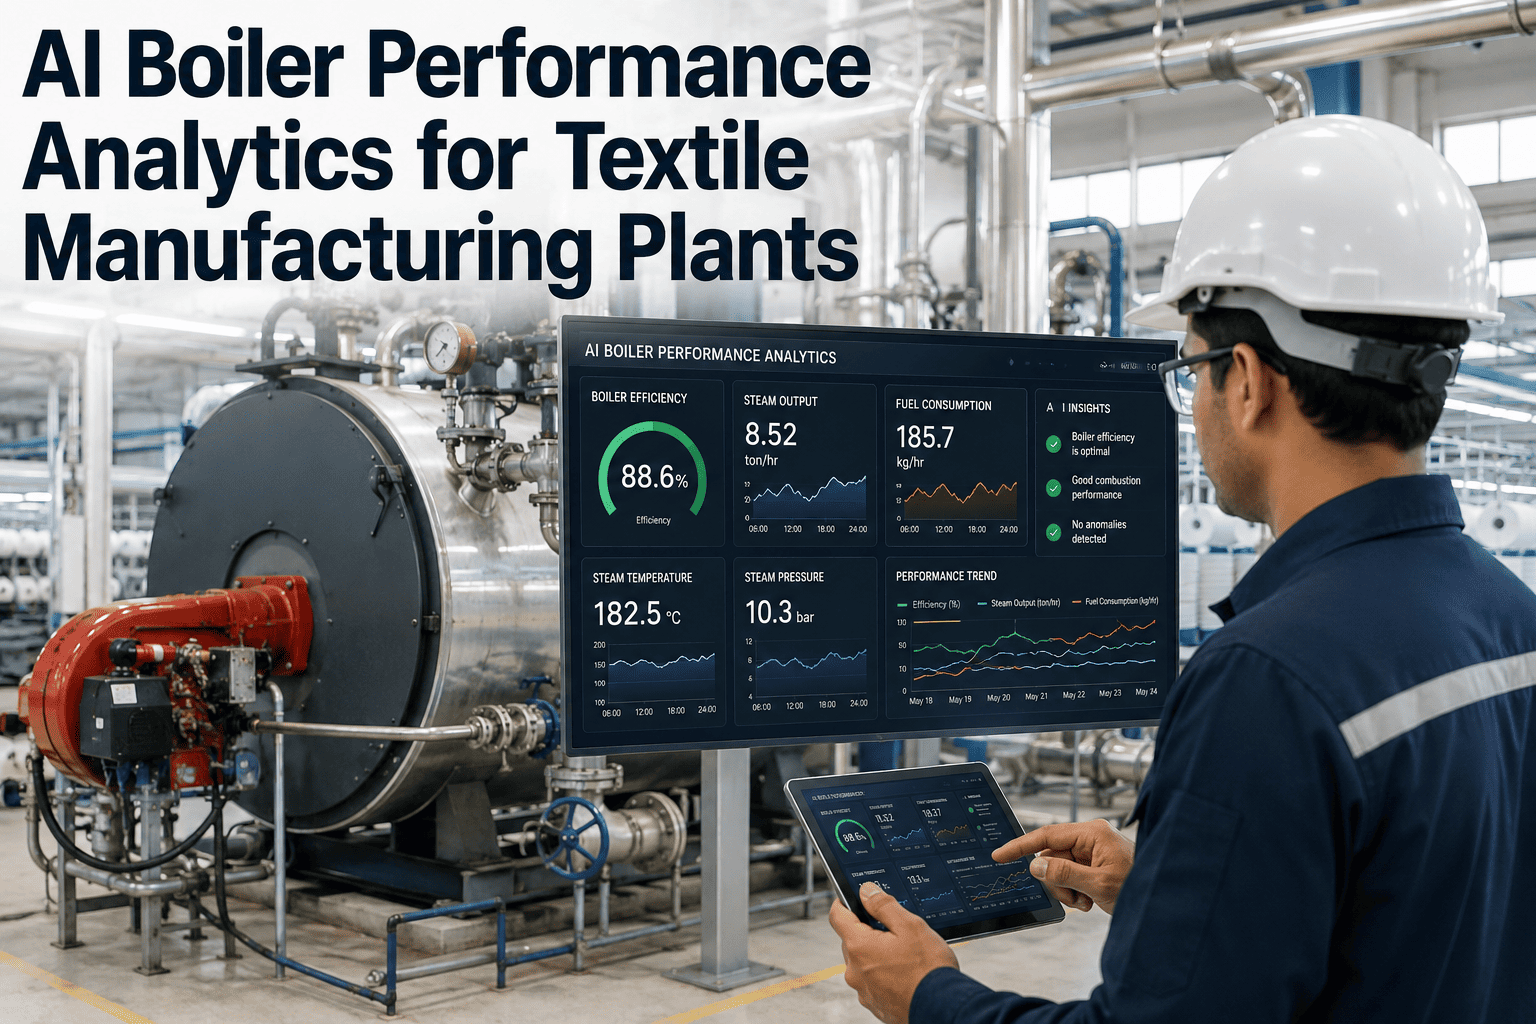
| Boiler thermal efficiency | % | (Steam output GJ ÷ fuel input GJ) × 100 | Use NCV for fuel; include blowdown losses | 75–88% (fire tube / water tube) |
| Steam GJ per kg (dyeing) | GJ / kg | Steam consumed per dyeing batch ÷ kg dyed | Include heating and holding periods | Benchmark varies by fibre and process type |
| Specific energy consumption | kWh / USD revenue | Total mill kWh ÷ monthly revenue | Use net revenue; track vs rolling 12-month average | Benchmark vs regional textile norms (IEA, 2025) |
Dyeing KPIs: RFT, Shade Rejection, and Batch Efficiency
Dyeing KPIs have direct financial implications because a single re-dyeing event can cost 1.5–2.5× the original process cost. The metrics below are the minimum set for a dyeing management system.
Teams running iFactory AI can automate dyeing KPI calculation from batch management system records and machine sensor data, eliminating manual Excel-based tracking and enabling shift-by-shift trend analysis. Book a session to see the dyeing analytics dashboard in action.
KPI Checklist: What Every Textile Mill Should Track by Department
The following checklist groups essential KPIs by department. Each item represents a metric that, if not tracked, creates a monitoring blind spot in that area.
Frequently Asked Questions
What is the difference between Uster CV% and Uster CVm?
These refer to the same metric: CVm is the mass coefficient of variation of yarn evenness, and CV% is the common shorthand for the same measurement. Both describe the percentage variation in yarn mass per unit length measured by a Uster Tester. When comparing results, always check the instrument type and speed settings — different settings produce different values for the same yarn. Ask iFactory AI's textile quality team how CVm results are stored and trended in the quality analytics module.
How should kWh per kg be calculated in a spinning mill that produces multiple counts?
In a multi-count mill, kWh per kg must be tracked separately by count range because finer counts consume significantly more energy per kg. The correct approach is to allocate ring frame energy to the count group running during each period using machine-level energy meters and production records. A blended mill average is useful for year-on-year trend tracking but masks count-specific efficiency opportunities. See how iFactory AI calculates count-segmented energy KPIs in a 30-minute walkthrough.
What is a good RFT target for reactive dyeing on cotton?
For reactive dyeing on cotton, an RFT rate of 90–93% is typical in mills without real-time process monitoring. Mills using predictive dyeing controls and inline spectrophotometry can achieve 95–97% RFT. The key variables driving RFT in reactive dyeing are bath temperature profile, liquor ratio stability, and water hardness consistency. Book a session to review your dyeing RFT data and identify the leading factors for your machines.
Should boiler thermal efficiency be calculated on gross calorific value (GCV) or net calorific value (NCV)?
NCV is the correct denominator for boiler efficiency calculations in operating plants because it excludes the latent heat of water vapour in flue gases, which is not recoverable in standard boiler designs. Using GCV understates efficiency by approximately 5–10% depending on fuel hydrogen content. The British Standards BS EN 15502 and ISO 15502 both specify NCV as the reference. Always declare which value is used when reporting efficiency to buyers or auditors. Ask about boiler efficiency monitoring setup in iFactory AI.
How does iFactory AI handle KPIs when data comes from multiple systems?
iFactory AI integrates data from ring frame PLCs, Uster testers, energy meters, boiler controllers, dyeing machine BMS systems, and ERP/MES records through its 50+ connector library. Each KPI is defined once in the platform with its formula, denominator, and data source — so the same calculation runs automatically on data from any connected source. This eliminates the spreadsheet reconciliation that causes most KPI discrepancies in textile mills. Book a demo to see the textile KPI dashboard configured for your mill.
Stop Arguing About KPI Numbers. Define Them Once, Automate Them Always
iFactory AI deploys on-premise in your textile mill and calculates spinning, energy, and dyeing KPIs automatically from live machine and system data — consistent, shared, and always current.