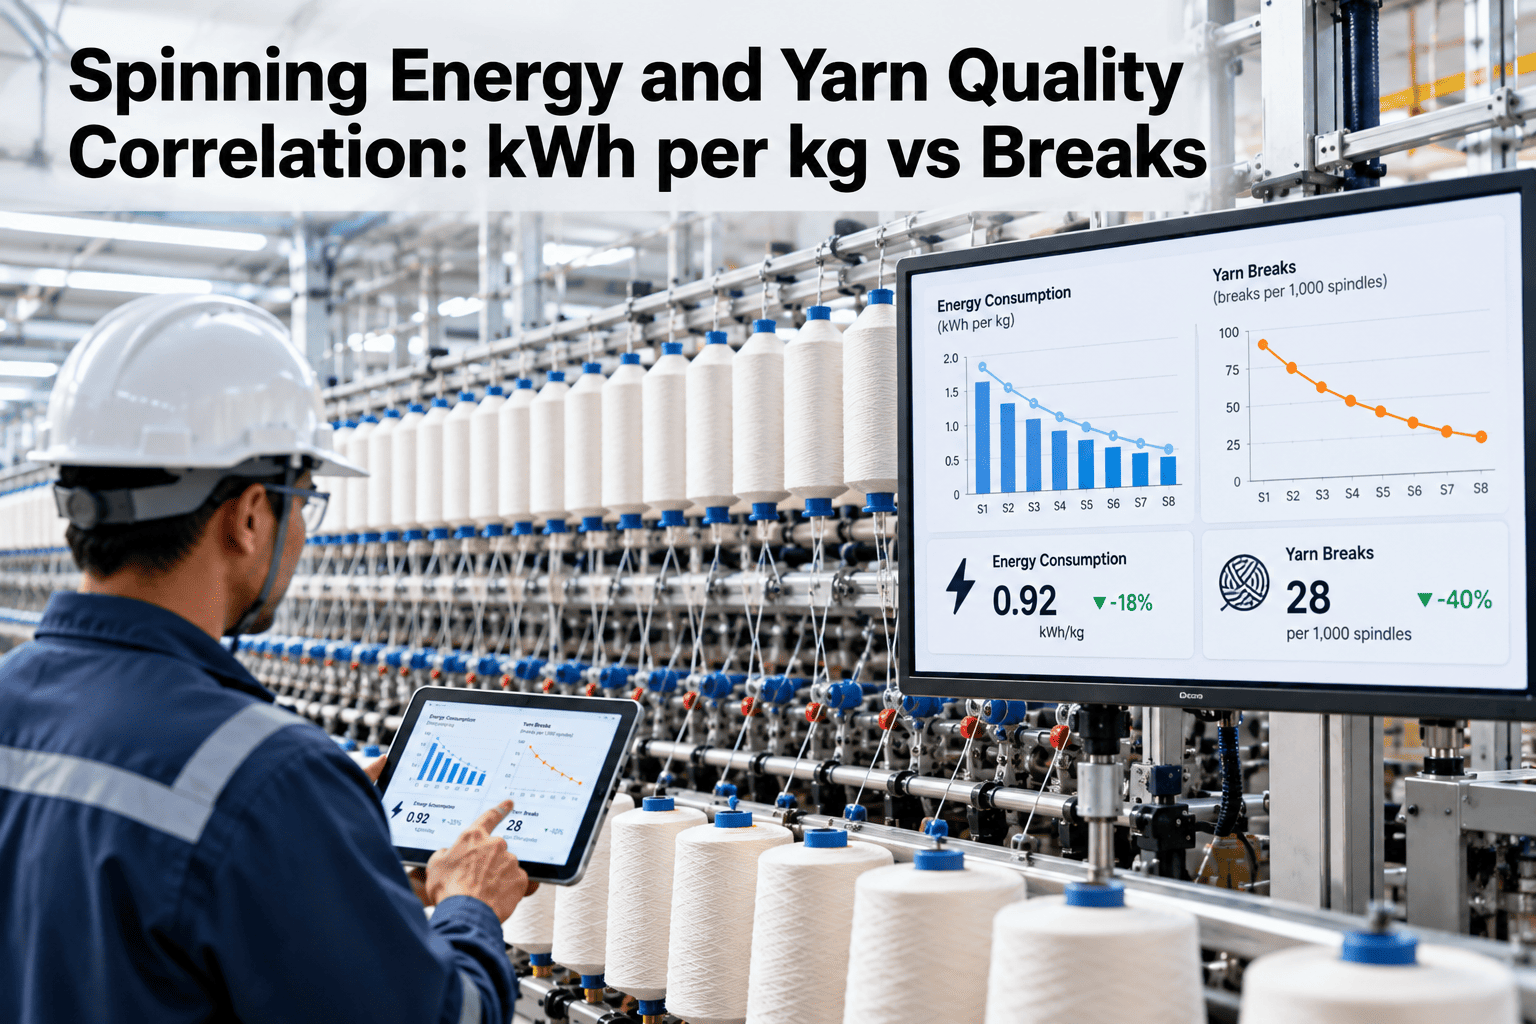
Slow down a ring frame's spindle speed and energy consumption per kilogram of yarn drops, which looks like a straightforward win until the slower speed also changes twist insertion and the break rate starts climbing on the next shift's report. Energy and yarn quality aren't independent levers on a spinning line, they're coupled through the same machine settings, which means an energy optimization made without checking its quality effect can easily trade a small kWh saving for a much larger cost in waste, rework, and machine stops. Finding the setting where both actually hold is what correlating energy and quality data on your own spinning line looks like.
The Energy Saving and the Break Rate Move Together
iFactory AI correlates kWh per kg with yarn breaks, speed, and output so an energy change is evaluated against its quality effect, not in isolation.
Why Energy and Quality Can't Be Optimized Separately
Spindle speed, draft ratio, and twist all affect both energy consumption and yarn integrity at the same time, which means a change made to improve one metric almost always moves the other.
Speed Changes Twist Insertion
Slowing spindle speed to save energy also changes twist per unit length, which directly affects yarn strength and break susceptibility.
Draft Ratio Affects Both Metrics
An adjustment to draft ratio aimed at improving throughput efficiency also changes fiber alignment, which influences both energy use and break rate.
A Break Costs More Than the Energy It Saved
A single yarn break interrupts production, requires a piecing stop, and can produce waste, costs that typically outweigh a marginal kWh per kg improvement.
What a Setting Change Actually Moves
Understanding how a specific setting affects both metrics together is what makes it possible to find a genuine improvement instead of a trade-off disguised as one.
| Setting | Typical Energy Effect | Typical Quality Effect |
|---|---|---|
| Lower spindle speed | Reduces kWh per kg | Changes twist insertion, can affect break rate either way |
| Higher draft ratio | Can improve throughput efficiency | Risk of uneven fiber alignment and increased breaks |
| Humidity control adjustment | Energy cost from conditioning equipment | Fiber moisture content directly affects break susceptibility |
None of these effects are fixed rules, since the actual direction and magnitude depend on fiber type, yarn count, and the specific machine, which is exactly why the correlation has to be measured on your own line rather than assumed from a general principle.
See Your Own Energy and Quality Trade-Off
Bring recent speed and quality data from one frame to a 30-minute session and see where your actual balance point sits.
Finding the Balance Point, Step by Step
The goal isn't to maximize either metric alone, it's to find the setting range where both stay within an acceptable combined cost.
Tracking Both KPIs Together Going Forward
A one-time analysis finds the current balance point. Ongoing tracking catches when fiber lots or seasonal humidity shift that balance over time.
An Illustrative Comparison: Three Speed Settings
The figures below are a labeled illustrative composite, not a reported customer result, showing kWh per kg and break rate across three spindle speed settings, both indexed to the current setting.
The mistake we see most often is an energy project that reports success purely on kWh per kg, with the break rate tracked by a completely different team on a completely different schedule. By the time the two numbers get compared, if they ever do, months of production have already run at a setting that looked efficient on one dashboard and expensive on the other. Correlating the two from the start is what keeps an energy initiative from quietly becoming a quality problem.
Frequently Asked Questions
Does lowering speed always reduce energy use?
Generally yes, since energy consumption typically scales with spindle speed, but the relationship isn't perfectly linear and the quality effect of a given speed change depends heavily on fiber type and yarn count, which is why the actual trade-off needs to be measured rather than assumed. Measure the actual relationship on your own frames in a short session.
How do we separate a true setting effect from normal fiber lot variation?
Comparing a setting change's effect against a consistent fiber lot, or at minimum logging fiber lot alongside every setting change, is what allows a true setting effect to be distinguished from natural variation in raw material. Ask the iFactory AI team how to control for fiber lot variation.
What other settings besides speed affect this trade-off?
Draft ratio and humidity control both interact with energy and quality in similar ways to spindle speed, and a complete correlation analysis typically needs to account for all three together, since changing one in isolation can mask or exaggerate the effect of another. Review additional settings worth correlating in a demo.
How often should the balance point be reassessed?
The balance point can shift with a new fiber supplier, a seasonal humidity change, or equipment wear, so a periodic reassessment, rather than a one-time analysis treated as permanent, keeps the target setting current with actual operating conditions. Set a reassessment schedule for your line on a call.
Can this connect to our existing energy management and quality systems?
Correlation analysis is built to pull from the energy monitoring and quality inspection systems you already use, combining their data on a shared timeline rather than requiring a separate parallel data collection effort. Discuss integration with your current systems with the support team.
Find the Setting Where Energy and Quality Both Hold
iFactory AI correlates kWh per kg with yarn breaks so an energy gain never quietly becomes a quality cost. Book a walkthrough on your own spinning line.