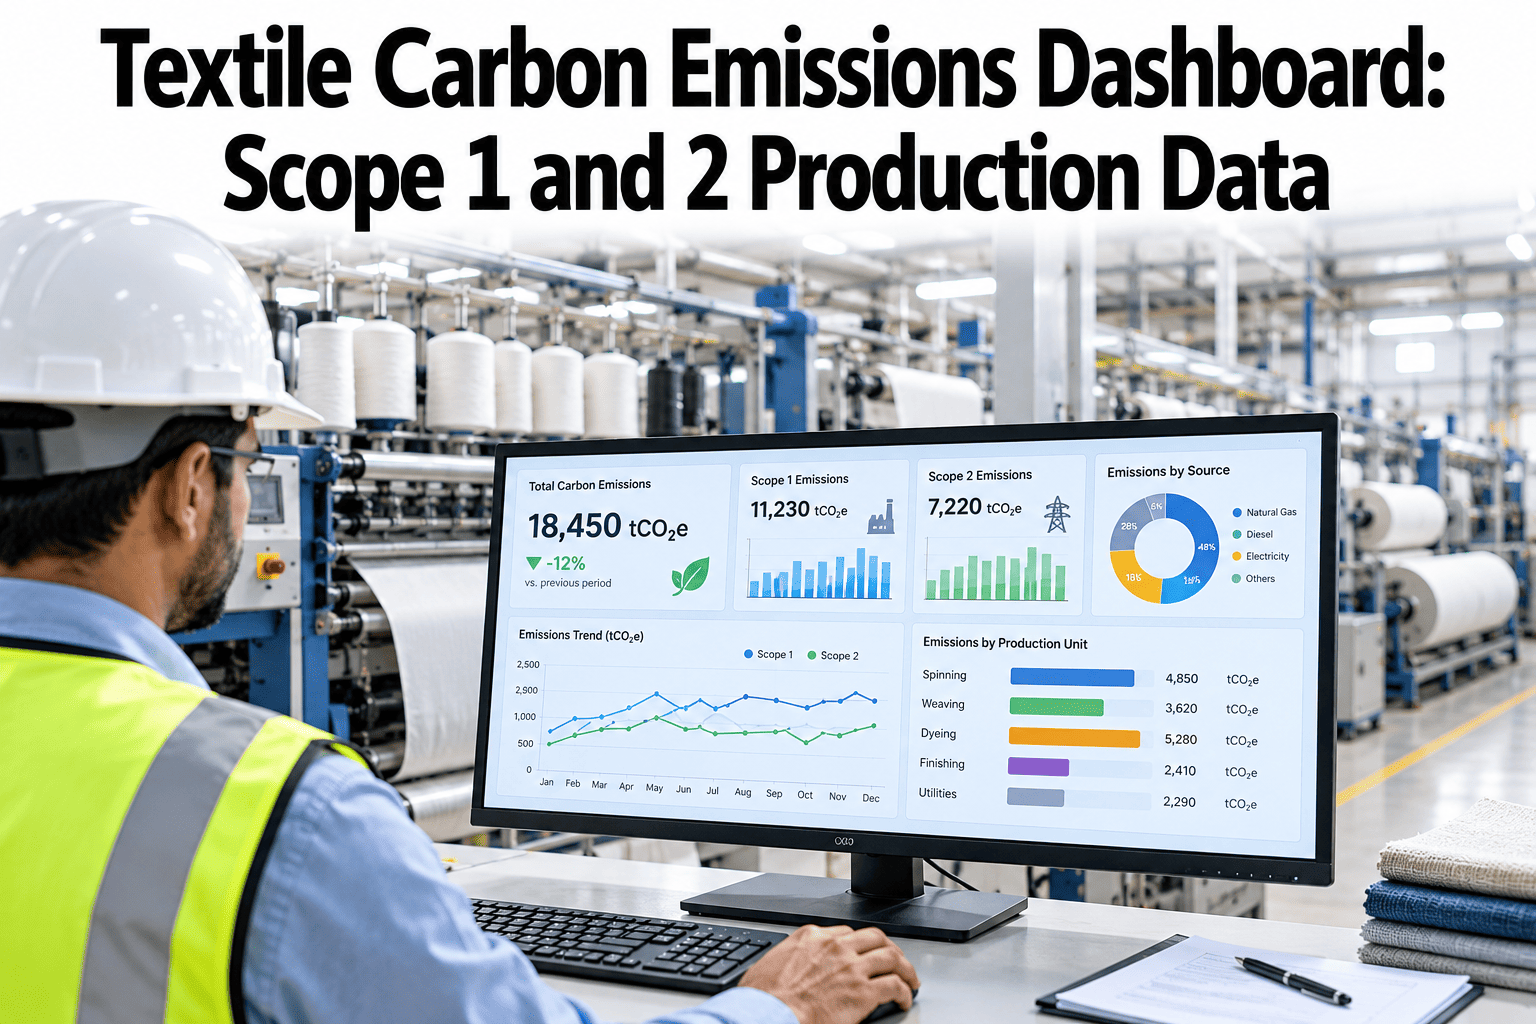
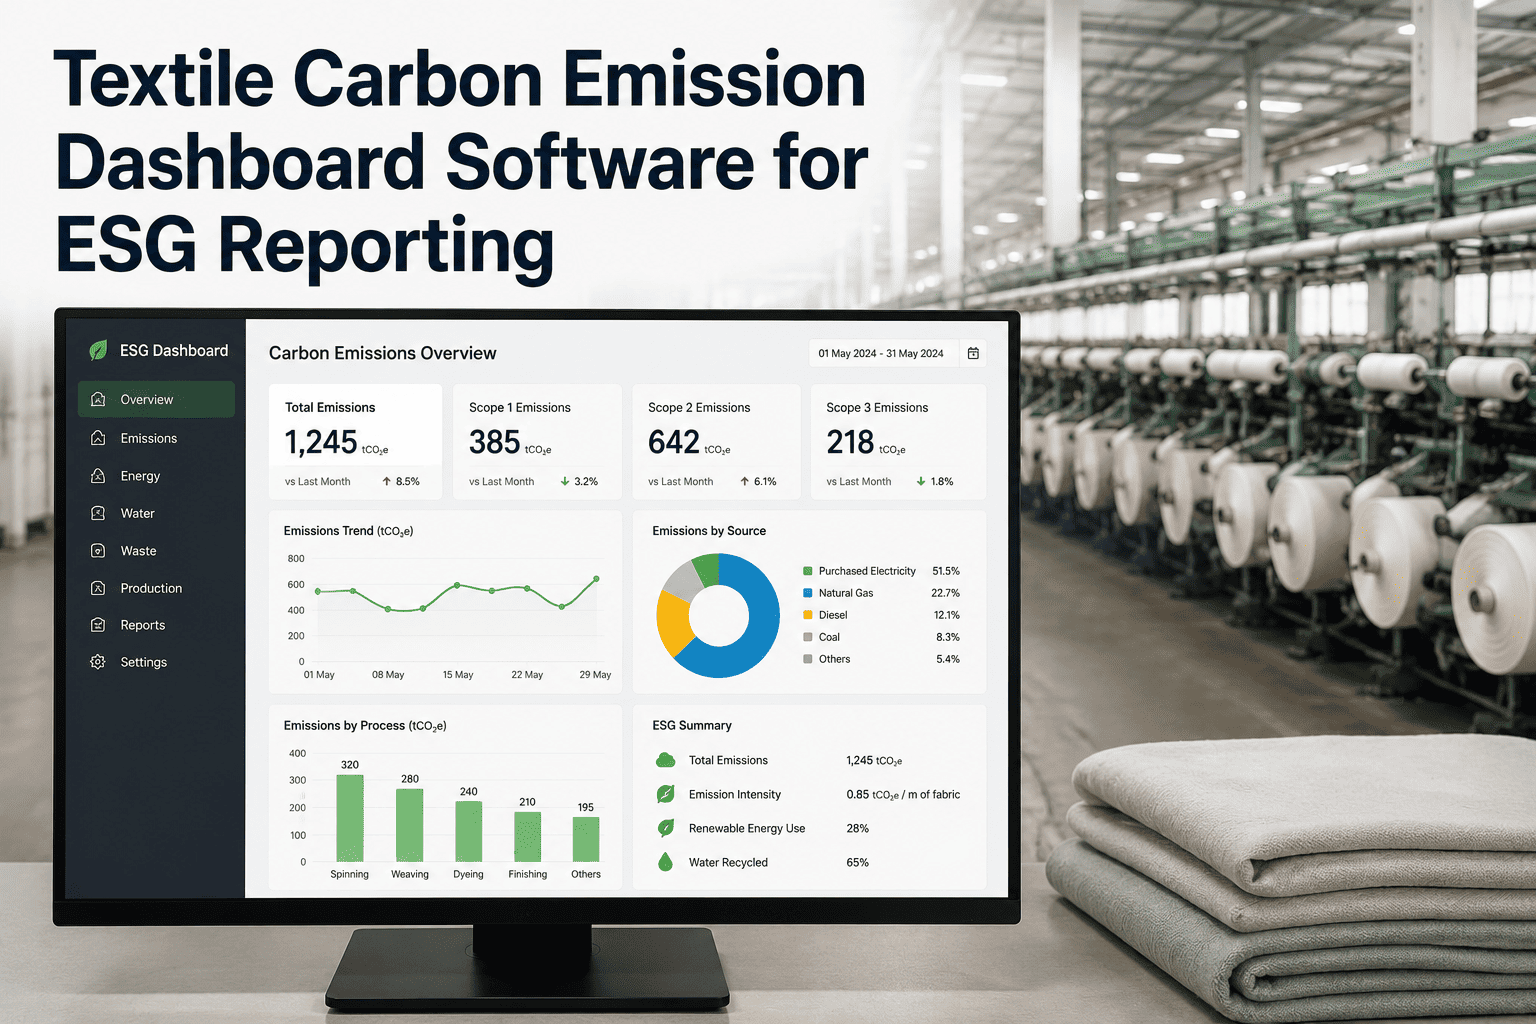
Carbon measurement in textile mills has shifted from voluntary reporting to a commercial requirement in the last 24 months. Buyers including H&M, Inditex, Nike, and PVH now mandate scope 1 and scope 2 emissions data at the mill level as a condition of supplier qualification, and the European Union's Carbon Border Adjustment Mechanism phased into partial enforcement in January 2026, requiring importers to purchase CBAM certificates for embedded emissions in textiles, apparel, and leather goods. A medium-size composite mill with coal-fired boilers and grid electricity typically reports 25,000 to 50,000 metric tons of CO2 equivalent per year — 20 to 30 percent from scope 1 (fuel combustion on-site) and 70 to 80 percent from scope 2 (purchased electricity). Mills that have not yet measured their baseline cannot negotiate from a position of data when buyers allocate volume, and mills that can demonstrate year-over-year reduction of 5 to 8 percent annually command a measurable premium in order allocation from sustainability-committed brands.
Automate Your Carbon Reporting Before Your Buyers Ask for It
iFactory Carbon Module calculates scope 1 and 2 emissions automatically from your existing utility meters, boiler sensors, and fuel logs — generating GHG Protocol-compliant reports in the format each buyer requires.
Scope 1, 2, and 3 Emissions for a Typical Textile Mill
Understanding which emissions belong to which scope is the prerequisite to reporting and reduction. The breakdown below represents a composite mill with coal boilers, grid electricity, and natural gas for stenters.
Direct Emissions — Owned Sources
Fuel combustion in boilers, generators, stenters, thermic fluid heaters, and process driers owned and operated by the mill.
- Coal for steam boilers6,800 tCO2e/yr
- Natural gas for stenters1,200 tCO2e/yr
- Diesel for DG sets800 tCO2e/yr
- Furnace oil for thermic fluid600 tCO2e/yr
Indirect Emissions — Purchased Energy
Emissions from grid-generated electricity and purchased steam consumed by the mill. This is typically the largest scope for textile operations.
- Grid electricity — spinning14,200 tCO2e/yr
- Grid electricity — weaving8,600 tCO2e/yr
- Grid electricity — processing5,800 tCO2e/yr
- Grid electricity — utilities1,200 tCO2e/yr
Value Chain Emissions — Upstream & Downstream
Raw material extraction, chemical production, yarn sourcing, logistics, product use, and end-of-life. Scope 3 is 5 to 20 times larger than scope 1+2 at the brand level, but mills typically report limited upstream categories.
- Cotton / fiber productionNot measured onsite
- Chemical & dye manufacturingNot measured onsite
- Inbound logistics340 tCO2e/yr
- Waste treatment210 tCO2e/yr
Annual Emissions Inventory by Source
The ledger below provides a line-item view of every emission source in a composite textile mill. This level of granularity is required for GHG Protocol scope 1 and 2 reporting under the operational control approach.
| Emission Source | Scope | Fuel / Energy Type | Activity Data | Emission Factor | tCO2e / Year | % of Total |
|---|---|---|---|---|---|---|
| Coal boilers (steam) | 1 | Indian bituminous coal | 12,400 tons | 2.94 kg/kg | 36,456 | 32.3% |
| Grid electricity | 2 | Indian grid mix | 18,500 MWh | 0.72 kg/kWh | 13,320 | 11.8% |
| Captive power (DG sets) | 1 | HSD | 620 kL | 2.68 kg/L | 1,662 | 1.5% |
| Natural gas stenters | 1 | PNG | 1,850 SCM | 2.02 kg/SCM | 3,737 | 3.3% |
| Thermic fluid heater | 1 | Furnace oil | 450 kL | 2.94 kg/L | 1,323 | 1.2% |
| Solar generation (offset) | — | Renewable | 1,250 MWh | 0.72 kg/kWh | -900 | -0.8% |
Generate a GHG Protocol-Compliant Ledger From Live Data
iFactory reads fuel consumption from boiler PLCs, electricity from utility meters, and generation from solar inverters — then calculates emissions by source and scope automatically. No manual spreadsheets, no annual audit scramble.
What Major Brands Require From Their Mill Suppliers
Each brand publishes its own sustainability requirements, but the underlying data demanded is converging. The matrix below maps what five major buyers currently require from textile mills for the 2026 procurement cycle.
| Requirement | H&M | Inditex | Nike | PVH | Adidas |
|---|---|---|---|---|---|
| Scope 1 & 2 reporting | Mandatory annually | Mandatory annually | Mandatory annually | Mandatory annually | Mandatory annually |
| Scope 3 upstream | Preferred | Mandatory 2027 | Preferred | Preferred | Mandatory 2027 |
| Third-party verification | Required | Required | Required | Required | Required |
| Science-based target | Required 2027 | Preferred | Required | Required | Required |
| Renewable energy % | Report | Report | 50% by 2027 | Report | 70% by 2027 |
| Water & chemical data | ZDHC gateway | ZDHC gateway | Bluesign | ZDHC gateway | Bluesign |
EU CBAM Timeline and What It Means for Textile Mills
The EU Carbon Border Adjustment Mechanism extended to textiles in the 2025 regulatory update. Mills exporting fabric, yarn, or apparel to the EU must now account for embedded emissions and purchase CBAM certificates for the carbon content above the EU benchmark.
Transitional Reporting Phase
Importers reported embedded emissions quarterly with no financial liability. Mills were asked to provide emission data for exported products on a voluntary basis. Penalty-free learning period.
Partial CBAM Certificate Obligation
Importers must purchase CBAM certificates covering 10% of embedded emissions above benchmark. Certificate price linked to EU ETS. Mills without verified scope 1+2 data risk losing EU buyer contracts to competitors who can provide audited figures.
Phased Certificate Increase
Certificate obligation rises to 25% in 2027 and 50% in 2028. Free allocation for textile imports begins phasing out. Mills must reduce embedded carbon by 15-25% from 2025 baseline to avoid cost disadvantage vs EU domestic producers.
Full CBAM Implementation
100% certificate obligation. Free allocation eliminated. Full border adjustment for textile imports. Mills with coal-dominant energy and no abatement will face CBAM cost of 15-25% of product value — enough to shift buyer sourcing.
Emission Reduction Levers Available to Textile Mills
Each lever targets a specific emission source and has a documented reduction potential in textile applications. The sequence that maximizes ROI starts with energy efficiency (negative cost), moves to fuel switching, then renewable energy, and finally offsets for residual emissions.
Energy Efficiency & Leak Elimination
Negative costCompressed air leak repair, steam trap replacement, condensate recovery, and HVAC optimization typically reduce scope 1 and 2 emissions 15 to 25 percent at zero or negative net cost. Payback averages 6 to 14 months across interventions.
Fuel Switching — Coal to Gas or Biomass
Moderate capexReplacing coal boilers with natural gas reduces scope 1 emissions 30 to 40 percent per unit of steam. Biomass conversion (rice husk, briquettes) is carbon-neutral if sourced sustainably but requires boiler modification and consistent fuel quality.
Renewable Energy — Solar & Open Access
Capital investmentRooftop and open access solar displace 30 to 55 percent of grid electricity consumption. Scope 2 emissions decrease proportionally. Combined with battery storage for peak shaving, net grid dependency drops to 40 to 50 percent of total demand.
Carbon Offsets & Insetting
Residual onlyAfter all abatement measures are exhausted, certified carbon credits (Verra, Gold Standard) or insetting investments — forestry, community biogas — address the remaining 10 to 20 percent. Buyers increasingly prefer inset over offset.
Frequently Asked Questions
What is the difference between scope 1, 2, and 3 emissions for a textile mill?
Scope 1 covers direct emissions from sources owned or controlled by the mill — coal and gas combustion in boilers, diesel in generators, and fuel in thermic fluid heaters. Scope 2 covers indirect emissions from purchased electricity, steam, and compressed air generated offsite. Scope 3 covers all other value chain emissions — raw material extraction, chemical production, inbound and outbound logistics, product use, and end-of-life disposal. For a typical textile mill, scope 2 is the largest category at 50 to 70 percent of the combined scope 1 and 2 footprint, but scope 3 upstream (fiber and chemicals) is typically 5 to 15 times larger than scope 1 and 2 combined at the product level.
Which emission factors should Indian textile mills use for scope 2 reporting?
Indian textile mills should use the Central Electricity Authority grid emission factor published annually. For the 2025-26 reporting year, the national average is approximately 0.72 kg CO2 per kWh. However, mills can use a lower utility-specific or state-level factor if their electricity supplier provides a verified emission rate — this is particularly relevant in states with high renewable penetration such as Gujarat, Tamil Nadu, and Karnataka. Mills that have purchased renewable energy certificates or are under an open access PPA must apply the market-based method alongside the location-based method in accordance with the GHG Protocol scope 2 guidance.
How does iFactory automate scope 1 and 2 carbon calculation?
iFactory connects to the mill's existing instrumentation — utility meters, boiler PLCs, flow meters, fuel consumption transmitters, and solar inverter gateways — and collects activity data continuously. The platform applies emission factors from the CEA, IPCC, and GHG Protocol databases based on fuel type, grid region, and year. Scope 1 and 2 emissions are calculated per source, per scope, and per department automatically. Reports can be exported in Higg FEM format, CDP format, or as a custom spreadsheet matching buyer-specific templates. The system also tracks emission intensity per kilogram of fabric produced, allowing mills to report emissions at the product level for CBAM declarations.
Do textile mills need third-party verification of their carbon data?
Every major textile buyer now requires third-party verification of scope 1 and 2 emissions for supplier qualification. Verification must be conducted by an accredited body — SGS, Bureau Veritas, Intertek, or TUV Rheinland are the most common in textile supply chains. The verification process typically reviews source data (fuel purchase records, electricity bills), calculation methodology, emission factors applied, and organizational boundary definition. iFactory's audit trail automatically documents every data input and calculation step, reducing verification time by approximately 60 percent compared to manual compilation.
What is a realistic carbon reduction target for a textile mill?
A well-managed mill can reduce combined scope 1 and 2 emissions 40 to 55 percent from baseline within 36 months using commercially available technology and without compromising production output. The reduction pathway typically includes: compressed air and steam efficiency (10-15 percent reduction in year 1), boiler tuning and condensate recovery (5-8 percent in year 1-2), rooftop solar deployment (20-30 percent of scope 2 in year 2), and open access solar or fuel switching (additional 10-15 percent in year 3). Science-based targets aligned with the 1.5-degree pathway require 4.2 percent annual absolute reduction for scope 1 and 2 combined.
One Platform for All Your Carbon Reporting
iFactory calculates scope 1 and 2 emissions automatically from live meter data, generates buyer-ready reports, tracks reduction against science-based targets, and prepares your mill for EU CBAM compliance — all from a single dashboard.