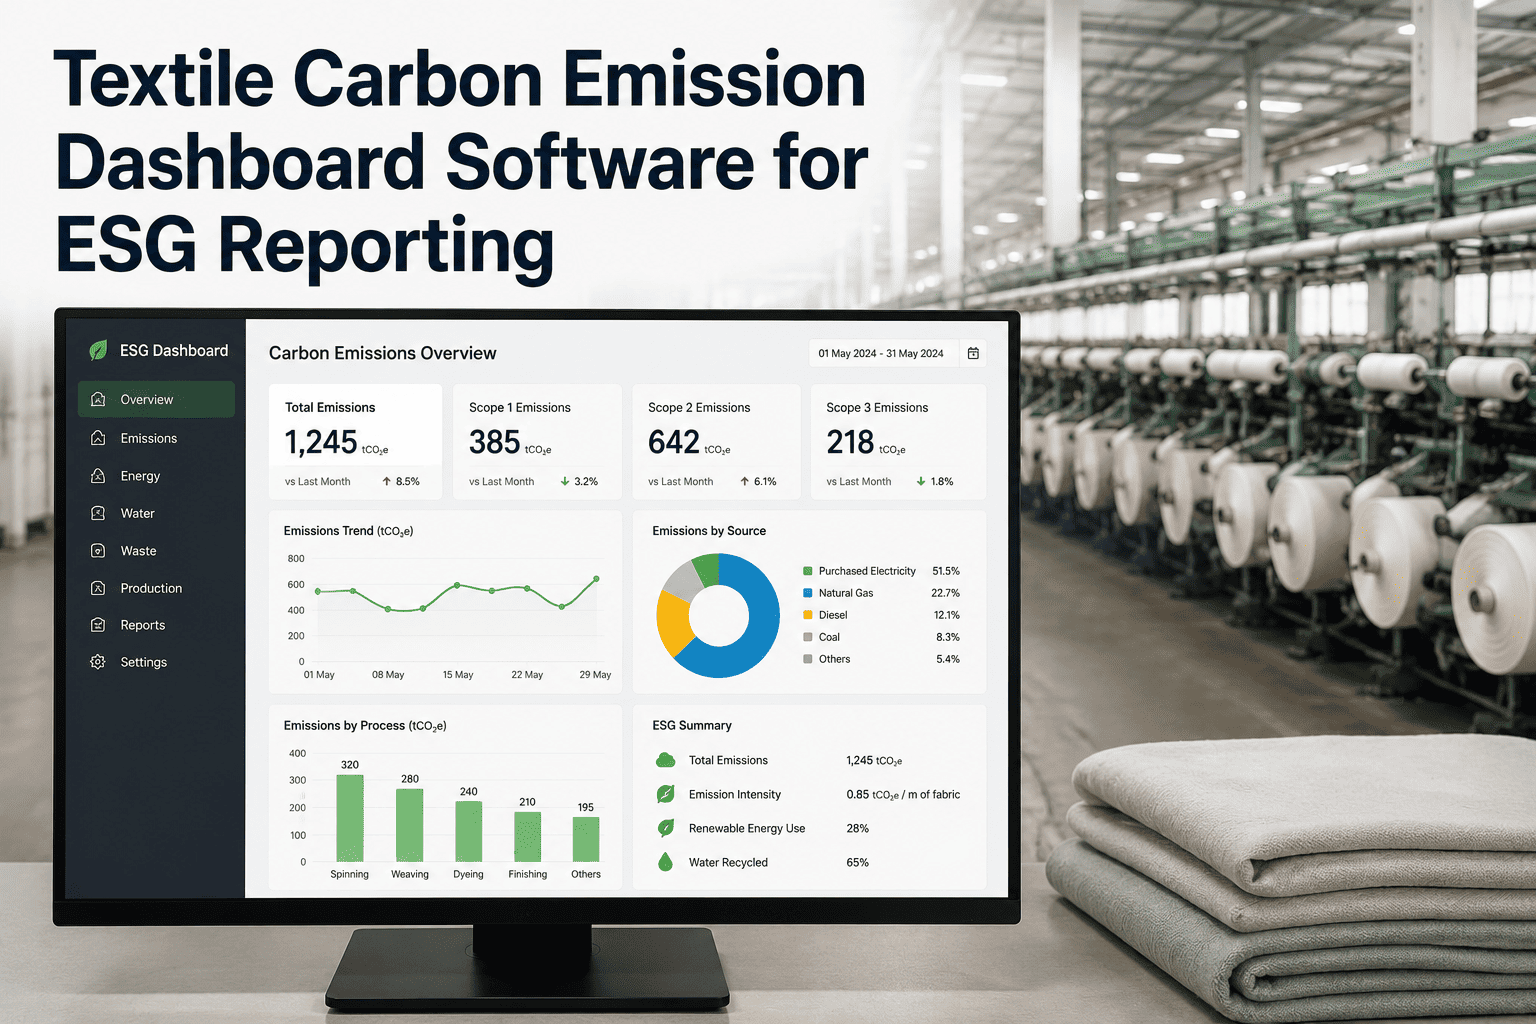
A sustainability manager at a mid-size apparel exporter gets a buyer questionnaire asking for the carbon footprint of a single denim jacket style, broken down by scope. The brand has an ESG report with a company-wide number, but nothing at the garment level, and no data past their own cut-and-sew facility. The honest answer — cotton farm, ginning, spinning, dyeing, and logistics are all somebody else's factory — is not one most buyers will accept anymore. Book a demo to see garment-level carbon tracking built from your actual production data.
How to Calculate the Carbon Footprint of a Single Garment — Scope 1, 2, 3 Boundaries and Real Data Collection
Garment-level carbon accounting means tracing emissions from fibre cultivation through spinning, dyeing, cut-and-sew, and logistics, mapped against the GHG Protocol's three scopes rather than reported as one company-wide average.
A Company-Wide Number No Longer Answers the Question Buyers Are Asking
Corporate carbon reporting at the company level was the first step most apparel businesses took, and it remains necessary — but a growing share of buyer questionnaires, retailer scorecards, and EU disclosure requirements now ask for a per-product figure, not an annual total spread across every style a factory ships. A company-wide average hides the fact that a synthetic-heavy, deep-dyed jacket carries a dramatically different footprint than a light, undyed cotton tee, and buyers increasingly want that difference visible.
Getting to a credible per-garment number means adopting product-level frameworks — Life Cycle Assessment under the GHG Protocol, ISO 14064, or the EU's Product Environmental Footprint Category Rules for apparel — rather than dividing a factory's total emissions by units shipped. The methods differ meaningfully in accuracy, and most manufacturers start further down the accuracy scale than they realize.
The practical challenge is rarely the framework itself — the GHG Protocol and ISO 14064 are well documented and widely adopted — but the underlying data. Frameworks assume access to reliable, granular activity data at each production stage, and most manufacturers discover their own internal systems were never built to capture energy and material consumption at the individual style level, only at the factory or production-line level. Closing that gap, not choosing between frameworks, is where most of the real work happens.
Where Emissions Actually Accumulate Between Fibre and Finished Garment
Mapping the Lifecycle Onto Scope 1, 2, and 3 — Why the Split Depends on Where You Sit
Scope 1 covers direct emissions from sources a company owns or controls — boiler fuel, generator diesel, and process emissions at a factory's own dyeing or finishing plant. Scope 2 covers purchased electricity, heat, steam, or cooling for owned facilities. Scope 3 covers everything else across the value chain — and for almost every apparel business, whether brand or manufacturer, Scope 3 is where the bulk of the footprint sits, because it captures every supplier tier the company itself does not directly control.
A cut-and-sew factory's own Scope 1 and 2 are typically the smallest slice of the total garment footprint, dominated instead by Tier 2 (fabric mills) and Tier 3–4 (spinning and raw material) emissions the factory does not directly measure. This is precisely why most manufacturers report accurate operational data but a rough estimate — or nothing at all — for the fibre and fabric stages that actually drive the number a buyer wants to see.
A Garment-Level Number Only Holds Up If the Underlying Data Does
Connect production, energy, and material data across your own operations and feed it into a defensible per-style carbon calculation, without waiting on a manual spreadsheet exercise every quarter.
Three Ways to Calculate Scope 3 — and Why Accuracy Varies Sharply Between Them
What to Collect Before Attempting a Credible Per-Garment Calculation
The Levers That Move a Garment's Footprint the Most
Not every intervention carries equal weight. Fibre choice and origin routinely account for the largest single swing in a garment's footprint — recycled cotton and recycled polyester both carry substantially lower emission factors than virgin fibre, and the same fibre grown or spun in a country with a cleaner electricity grid produces a measurably lighter result than the identical process run on a coal-heavy grid. Dyeing and finishing is usually the second-largest lever, since it is the most thermally intensive stage in the entire chain, followed by transport mode, where a shift from air freight to ocean freight for the same shipment can cut logistics emissions dramatically.
Where Garment-Level Carbon Calculations Go Wrong in Practice
The most frequent mistake is applying a single grid emission factor across a factory that draws power from a mixed source — partly grid, partly diesel backup, partly a captive renewable installation — and reporting the blended reality as if it were one uniform figure. This flattens seasonal and shift-pattern variation that a more granular metered approach would catch, and it understates the benefit of any on-site renewable investment a factory has already made.
A second common error is treating fabric weight as a fixed constant across a style's production run, when trim loss, cutting efficiency, and fabric relaxation shrinkage all vary the actual material consumed per finished garment. Calculating from the nominal specification rather than actual consumed weight introduces an error that compounds across every downstream emission factor applied to that material. A third mistake, and the most consequential for credibility, is presenting a spend-based estimate to a buyer without labelling it as an estimate — buyers and auditors increasingly distinguish between measured and modelled data, and conflating the two erodes trust faster than a modest, clearly-labelled estimate ever would.
Why This Is No Longer Just a Buyer Request — It Is Becoming a Market Access Requirement
The EU Strategy for Sustainable and Circular Textiles is steadily converting what used to be a voluntary sustainability disclosure into a market access condition. The direction of travel is consistent across recent EU textile policy — durability and recyclability requirements under the Ecodesign for Sustainable Products Regulation, mandatory Digital Product Passports carrying material and environmental data, and Extended Producer Responsibility schemes that increasingly factor a product's environmental footprint into the fees a producer pays. A manufacturer that cannot produce a credible per-garment carbon figure today is not just missing a buyer's questionnaire field — it is building toward a compliance gap that will affect market access within a few reporting cycles.
Manufacturers outside the EU feel this pressure indirectly but just as forcefully, since any brand selling into EU markets is pushing these same data requirements down through its entire supplier base regardless of where a factory sits. Building the systems to capture garment-level data now, ahead of it becoming strictly mandatory, is materially cheaper than retrofitting a data collection process under a compliance deadline with buyers threatening to delist non-compliant suppliers.
Where to Focus Reduction Effort Once You Have a Baseline Number
Questions Sustainability and Sourcing Teams Ask About Garment-Level Carbon Accounting
Build Garment-Level Carbon Data From Your Actual Production Floor, Not an Industry Average
Connect bill-of-material, energy, and logistics data across your operations into a defensible per-style carbon calculation that holds up under buyer scrutiny and upcoming EU disclosure requirements.