Every predictive maintenance pitch eventually lands on the same desk: finance, holding a request for sensor hardware and software licensing, asking for a number instead of a promise. "Fewer breakdowns" doesn't clear a capital review. A payback period, backed by the mill's own downtime hours and its own cost per hour, does. The good news is that number is calculable from data most textile operations already have sitting in a shift log or a maintenance spreadsheet — it just rarely gets assembled into the form finance actually needs to see. iFactory builds that business case using your plant's own numbers, not a generic industry average.
The Capital Request That Gets Approved Has a Number Attached, Not an Adjective
Predictive maintenance ROI for a textile mill comes down to three inputs finance can verify: downtime hours avoided, maintenance labor optimized, and bearing and component life extended — measured against what the program actually costs to run.
The Formula Finance Actually Wants to See
Strip away the vendor language and predictive maintenance ROI reduces to a comparison finance teams already know how to evaluate: what did the program cost, and what did it return. The complexity isn't in the formula itself — it's in pricing each input accurately enough that the number survives scrutiny in a capital review.
Most rejected predictive maintenance proposals don't fail because the underlying case was weak — they fail because the number presented couldn't withstand a finance team's first round of questions. A projection built on a single industry-average downtime figure, with no breakdown of where the savings actually come from, invites exactly the kind of skepticism that stalls a capital request in committee. The formula below is the same one finance teams use to evaluate any capital investment; the work is in filling it with numbers specific to the plant asking for the money.
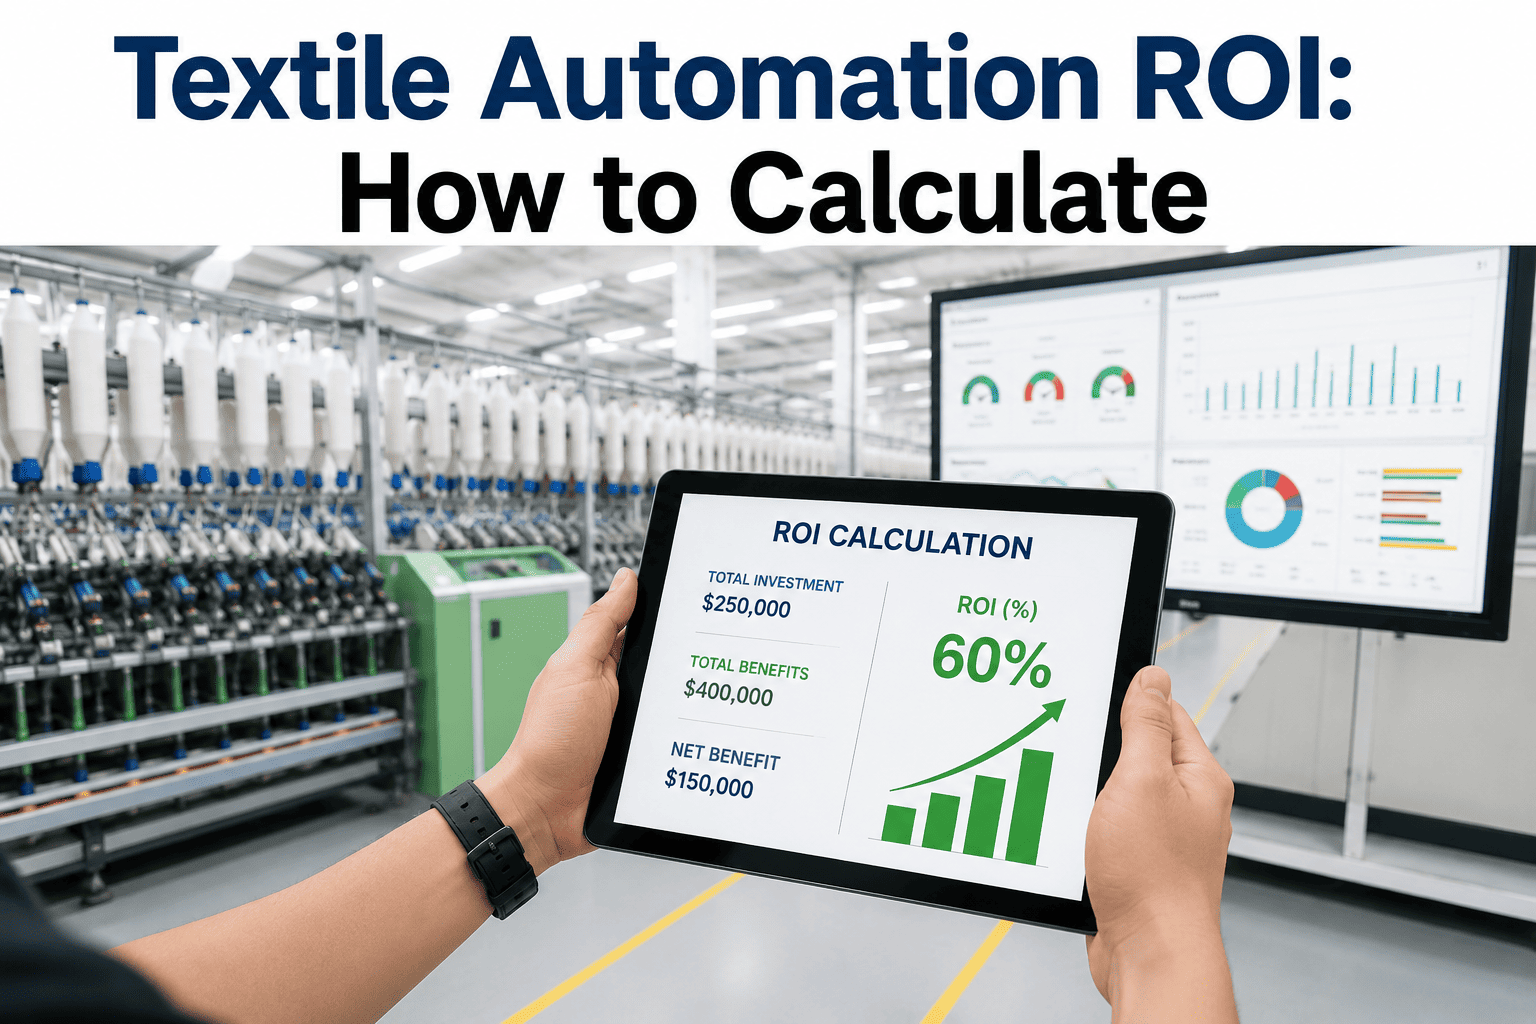
ROI (%) = (Downtime Savings + Labor Savings + Asset Life Extension − Program Cost) ÷ Program Cost × 100
Each term in that formula has its own pricing nuance, and mills that skip the detail work almost always understate their own case — because unplanned downtime cost is rarely just lost output. It includes scrap, overtime labor, expedited freight for replacement parts, and in buyer-audited operations, the compliance and relationship exposure of a missed shipment.
Downtime Cost: Why the First Number Most Mills Use Is Too Low
The most common mistake in a predictive maintenance business case is pricing downtime at production value alone — output per hour multiplied by the hours lost — while leaving out everything that surrounds the stoppage. A more complete number captures four cost layers stacked on top of each other.
Textile operations have a specific reason this understatement happens more often than in other industries: production value per hour is the easiest number to pull from an ERP report, while labor mix, scrap rates, and schedule impact live scattered across separate systems — a maintenance log, a quality report, a customer service email chain. Pulling all four together takes more effort than reading one dashboard, which is exactly why so many first-pass business cases quietly default to the incomplete number instead.
Lost Production Value
Output per hour at standard margin, multiplied by hours down — the baseline most mills already track, and the smallest piece of the true picture.
Idle and Emergency Labor
Operators standing idle during a stoppage plus emergency repair labor, typically billed at 1.5 to 2 times the standard rate for after-hours callouts.
Scrap and Rework
Partially processed fabric caught mid-run when a machine fails, plus the material lost restarting a process that doesn't resume cleanly from a hard stop.
Schedule and Relationship Cost
Expedited freight for replacement parts, missed buyer ship dates, and the harder-to-price cost of a delayed order on a long-term account.
Once all four layers are counted, the effective cost per downtime hour typically runs meaningfully higher than the production-value-only figure most mills start with — which is exactly why understating this input is the single most common way a predictive maintenance business case undersells itself before it ever reaches finance.
A Downtime Number That Only Counts Lost Output Is a Number Finance Will Discount
iFactory helps price the full cost of an unplanned stoppage — labor, scrap, freight, and schedule impact — against your actual plant data.
A Worked Example: Mid-Size Weaving Operation
Numbers land better than formulas alone. Here's a simplified but realistic model based on a weaving operation running 40 looms across two shifts, using figures consistent with published industry benchmarks for textile predictive maintenance deployments.
| Input | Baseline (Before PdM) | Year 1 (With PdM) |
|---|---|---|
| Unplanned Downtime Hours | 320 hours/year | ~190 hours/year |
| Fully-Loaded Cost per Hour | $2,400 | $2,400 |
| Emergency Repair Premium | 4-5x planned repair cost | Sharply reduced |
| Maintenance Labor Mix | Mostly reactive | Shifted to planned work |
Applying a conservative 40% downtime reduction — the low end of the 35 to 50% range documented across manufacturing predictive maintenance deployments — against 320 baseline hours at $2,400 per hour recovers roughly $307,000 in avoided downtime cost in the first year alone, before labor and asset life savings are even added to the total.
Bearing and Component Life Extension: The Savings Most Business Cases Leave Out
Downtime avoidance gets most of the attention in a predictive maintenance pitch, but extended component life is a real, measurable savings category on its own — one that compounds year over year in a way downtime avoidance alone doesn't. Ring spinning frame spindle bearings are the clearest example in a textile context, since a single frame can carry 500 to 1,000 spindles and bearing wear is a progressive, trackable failure mode rather than a sudden one.
What makes this category particularly worth including in a business case is that it's the easiest of the three to verify against records a mill already keeps. Parts purchasing history shows exactly how many bearings, belts, and drive components were replaced in a given year and at what cost — comparing that history before and after condition-based monitoring is a direct, auditable measurement rather than an estimate, which gives finance a category of the model they can check against a purchase order log without needing to trust a projection at all.
Bearings replaced on a fixed schedule regardless of actual remaining life, discarding usable service life on the majority of units replaced early
Some bearings still fail unexpectedly between scheduled intervals despite the fixed replacement cadence
Vibration monitoring at bearing housings tracks actual wear, flagging specific spindle positions only once degradation crosses a threshold
Full remaining service life is captured on every bearing before replacement, cutting both part spend and unnecessary labor
The financial impact scales directly with fleet size. A spinning floor running several thousand spindles across multiple ring frames converts a modest percentage improvement in bearing utilization into a meaningful annual parts and labor saving, on top of whatever downtime avoidance the same monitoring program also delivers.
Labor Optimization: Wrench Time Shifting From Reactive to Planned
The third major savings category is the one most easily verified against a mill's existing maintenance spend, because it shows up directly in labor hours rather than requiring a downtime cost estimate at all. Reactive repairs consistently cost more per incident than the same repair performed as planned work — documented across manufacturing studies at roughly four to five times the cost differential — and that premium comes almost entirely from emergency labor rates, rushed parts sourcing, and the secondary damage a failure-in-progress often causes before a technician arrives.
Emergency Labor Rates
After-hours and weekend emergency callouts typically run 1.5 to 2 times standard labor rate, a premium a scheduled repair during a planned window avoids entirely.
Rushed Parts Sourcing
A part ordered in a panic after a failure often costs more and arrives slower than the same part sourced against a two-week predicted failure window.
Secondary Damage
A bearing that fails catastrophically rather than being caught early frequently damages adjacent components the original fault alone wouldn't have touched.
Three Savings Categories, One Model Finance Can Actually Audit
iFactory's platform logs avoided downtime, labor mix shift, and component life extension against your own cost inputs, so the ROI number updates from real outcomes, not a projection.
Pricing the Investment Side Honestly
A credible ROI model prices the cost side with the same rigor as the savings side, and that means including line items a vendor pitch sometimes leaves out of the headline number. A full first-year investment for a mid-size deployment typically spans sensor hardware, connectivity infrastructure, platform licensing, implementation services, and the internal labor required for deployment and staff training — with the platform and licensing cost declining meaningfully in years two through five once the initial hardware capital spend recedes.
Internal labor for deployment is the line item most commonly left off a vendor's proposal, even though it's real cost the mill absorbs regardless of who's billing for it. Time spent by maintenance staff learning a new platform, tagging assets, and adjusting existing workflows to incorporate sensor alerts is genuine implementation cost, and including it — even as an estimate — makes the overall model more credible to a finance team that will notice its absence otherwise.
| Cost Component | Timing | Trend Over Time |
|---|---|---|
| Sensor Hardware | One-time, Year 1 | Minor ongoing replacement cost only |
| Connectivity Infrastructure | One-time, Year 1 | Largely fixed after initial buildout |
| Platform Licensing | Annual, recurring | Stable or modestly scaling with fleet size |
| Implementation & Training | One-time, Year 1 | Drops to near zero after go-live |
Presenting this breakdown alongside the savings model, rather than a single blended number, is what lets a finance team sanity-check the projection line by line instead of taking a vendor's total on faith.
Why the Conservative Assumption Is the Stronger Pitch
It's tempting to present a business case using the most optimistic figures documented anywhere in the industry — the top of the downtime reduction range, the fastest payback period cited in a vendor case study. That temptation works against the pitch more often than it helps it, because a finance team's job is to stress-test exactly those assumptions, and an aggressive number with no room to absorb underperformance collapses under the first hard question.
Uses the top of every published benchmark range simultaneously
Projects payback that assumes everything goes right in Year 1
Loses credibility the moment one input is questioned
Uses the low end of documented ranges, sourced explicitly
Still shows a strong payback period even under cautious assumptions
Leaves room to outperform the model, which builds trust for the next capital request
A program that beats its own conservative projection in Year 1 makes the case for Year 2 expansion far more easily than one that barely hits an aggressive target — and that second capital request is usually where the larger, plant-wide rollout actually gets approved.
A Composite Scenario: Building the Case From the Mill's Own Shift Logs
A composite knit fabric mill running three shifts across a weaving and finishing operation had been tracking downtime incidents in a shift log for years but had never converted that log into a financial model. A plant manager pulled twelve months of entries and found 340 hours of unplanned downtime across the year, concentrated heavily in loom bearing failures and two humidification system faults that had each taken down an entire weaving section for most of a shift.
Pricing those hours at the mill's fully-loaded cost of $2,100 per hour, including labor and scrap, put the baseline annual loss at roughly $714,000. A conservative 35% downtime reduction target — chosen deliberately below the 40 to 50% range documented in broader industry benchmarks, to keep the internal projection defensible — implied close to $250,000 in Year 1 downtime savings alone. Layered against an estimated $60,000 in reduced emergency labor premiums and a projected first-year platform and hardware cost of roughly $95,000, the resulting payback period came in under five months, well inside the range finance had indicated it would approve without further debate.
Where ROI Projections Go Wrong Before They Reach Finance
Using an industry-average downtime cost figure instead of the mill's own fully-loaded number.
A published industry average is a useful sanity check, but a business case built on the plant's own shift logs and labor rates survives finance scrutiny far better than one borrowed from a vendor's generic benchmark.
Presenting a single aggressive downtime reduction percentage without showing the range it came from.
Leading with a conservative figure from the low end of the documented range, and noting that mature programs typically outperform it in later years, builds more credibility than an optimistic number presented as certain.
Counting only downtime avoidance and leaving labor optimization and component life extension out of the model entirely.
Labor mix shift and extended bearing or component life are both independently verifiable against existing maintenance spend, and including them typically strengthens the case more than any single additional downtime hour would.
A Checklist Before the Number Goes to Finance
Downtime cost includes labor, scrap, and schedule impact, not just lost output
A production-value-only figure understates the true cost of a stoppage and weakens the case unnecessarily.
The downtime reduction percentage used is conservative and sourced
Citing where a reduction assumption comes from, and choosing the lower end of a documented range, holds up better under questioning than an unsourced optimistic figure.
Labor optimization and component life extension are modeled separately
Bundling every benefit into one downtime number hides the parts of the case that are easiest for finance to verify independently.
The investment side lists every cost component, not a single blended total
Hardware, connectivity, licensing, and implementation labor broken out separately lets finance check the number line by line instead of taking it on faith.
Frequently Asked Questions
What downtime reduction percentage is realistic to assume for a textile mill's first year?
A conservative 35 to 40% reduction in unplanned downtime is well supported by published industry benchmarks for a first-year predictive maintenance deployment, with more mature programs in year two and beyond typically recovering a higher share once the monitoring data set and maintenance workflow are both established. Visit support to work through an assumption appropriate to a specific mill's baseline.
How is bearing life extension actually measured and verified after deployment?
Vibration trending against a documented baseline shows the actual service life achieved on monitored bearings compared to a prior calendar-based replacement schedule, giving a direct before-and-after comparison finance can review against parts spend records.
What's typically included in the first-year investment figure for a mid-size mill?
Sensor hardware, connectivity infrastructure, platform licensing, implementation services, and internal labor for deployment and training make up the full first-year figure, with licensing and support continuing annually while the hardware and implementation costs largely recede after Year 1. Book a demo to see a cost breakdown scoped to a specific fleet size.
How quickly does a typical textile predictive maintenance program pay back its investment?
Mills with higher downtime costs per hour and larger monitored asset fleets often see payback within six months to a year, while smaller deployments with a narrower initial scope can take longer to fully recover the upfront investment, though both scenarios commonly show a positive return within the first year.
Should the ROI model include savings that are hard to price precisely, like buyer relationship impact?
Hard-to-price savings are worth noting qualitatively in a business case, but the core financial model finance reviews should rest on the categories that can be measured directly — downtime hours, labor rates, and component life — to keep the number defensible rather than speculative. Contact support to review which savings categories apply to a specific operation.
Build the Business Case With Your Own Numbers, Not an Industry Average
iFactory helps price downtime, labor, and component life against your actual mill data, so the ROI model that reaches finance is one they can verify line by line.