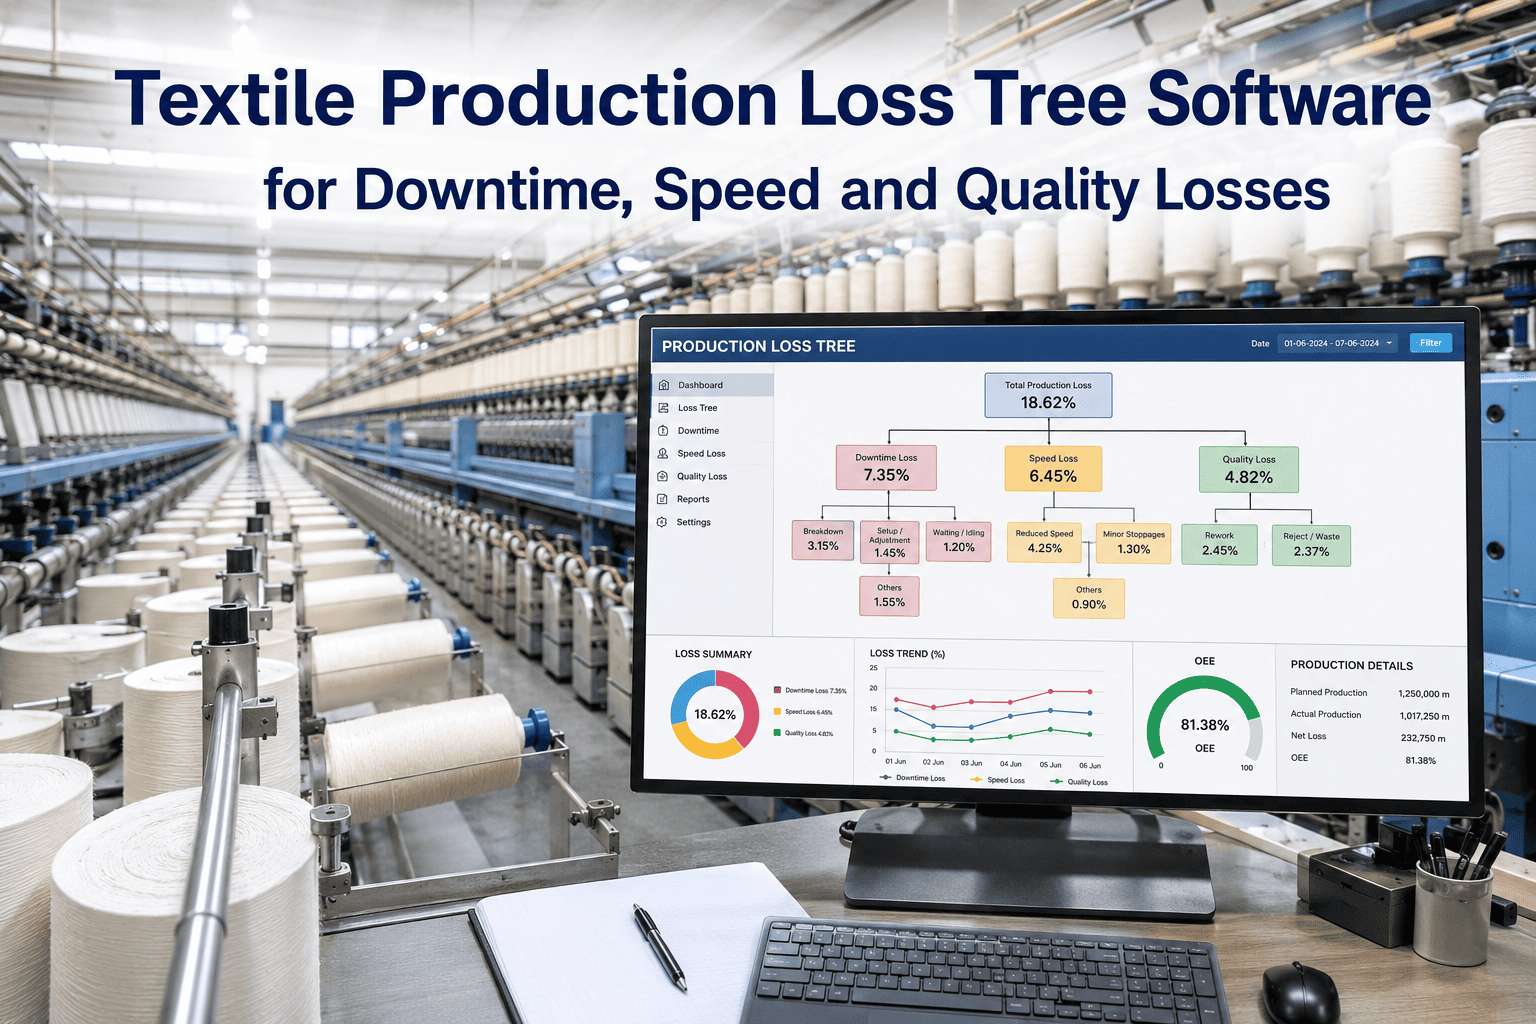
Understanding true cost per meter is the single most important financial lever for textile manufacturers, yet most mills calculate cost using rough averages that mask significant variances across fabric types, production runs, and efficiency levels. The difference between a manufacturer that knows its cost per meter at the SKU level and one that uses blanket averages is typically 8–15 percentage points of gross margin — the difference between survival and profitability in an industry where average EBITDA margins run 6–12%. A complete cost per meter model captures five primary components: yarn cost (45–55% of total), conversion cost (20–25%), energy (8–12%), labor (7–10%), and depreciation (5–8%), with each component varying significantly by fabric category, automation level, and regional input costs. This page presents a detailed cost stack for cotton shirting fabric with 2026 benchmarks, compares cost structures across three major fabric categories — 100% cotton, 100% polyester, and 65:35 poly-cotton blends — breaks down conversion cost by production process, tracks year-over-year cost trends from 2022 through 2026, and models the margin impact of specific efficiency improvements through three what-if scenarios.
Textile Cost Per Meter Calculation and 2026 Benchmarks
Textile manufacturers operate on thin margins where a $0.10 per meter cost advantage on a 10 million meter annual production volume translates to $1 million in additional profit. Yet most mills lack the real-time cost visibility needed to identify which products, orders, or production runs are actually profitable. Building a reliable cost per meter model requires accurate component measurement, consistent allocation methodology, and regular benchmarking against industry standards for comparable fabric categories, automation levels, and production scales.
Track True Cost Per Meter Across Every Production Run
iFactory's platform captures real-time cost data at each production stage — yarn consumption, energy usage, labor hours, machine utilization, and quality waste — and calculates cost per meter at the SKU, order, and shift level. Book a demo to see how leading mills identify margin leakage and improve profitability across their product mix.
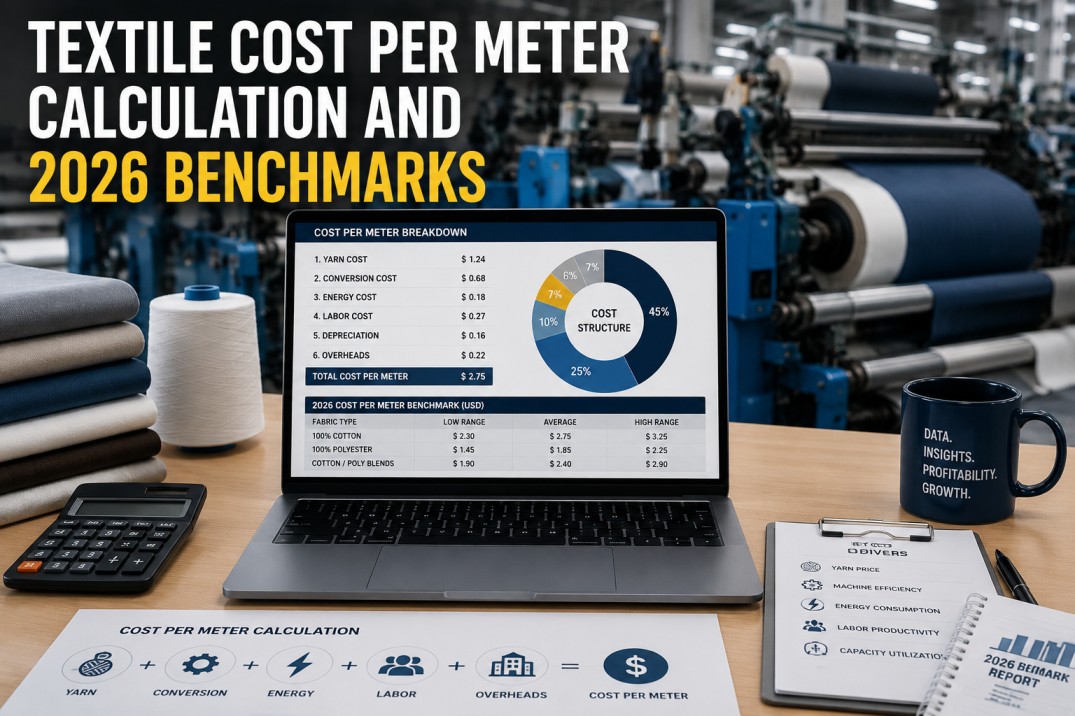
Cost Per Meter Breakdown — Cotton Shirting 2026
The cost stack for a standard cotton shirting fabric (40s Ne, 130 gsm, 145 cm width, mill in Gujarat, India) provides a representative benchmark for mid-weight woven cotton fabrics produced in a vertically integrated mill. Individual mill costs vary based on yarn sourcing model, energy mix, labor productivity, and automation levels, but the relative proportions remain consistent across similar fabric categories and production configurations.
Cost Per Meter by Fabric Category — 2026 Benchmarks
Cost per meter varies significantly across fabric categories, with polyester benefiting from lower raw material costs and higher weaving productivity, while blends capture some of polyester's cost advantage while maintaining cotton-like handle. The benchmarks below reflect representative costs for mid-weight fabrics (130–160 gsm) produced in comparable mills with similar automation levels and regional cost bases.
Benchmark Your Cost Per Meter Against Industry Standards
iFactory's cost analytics module compares your mill's cost per meter against anonymized benchmarks from similar mills, highlighting opportunities for margin improvement in each cost component. Schedule a demo to see how your cost structure compares to 2026 industry benchmarks.
Conversion Cost Breakdown by Production Process
Conversion cost — the cost of turning yarn into finished fabric — is the component manufacturers have the most control over, and it's where the largest margin improvement opportunities exist. Breaking conversion cost down by process reveals where automation, efficiency improvements, and waste reduction have the greatest financial impact.
Cost Per Meter Trends — 2022 to 2026
Textile input costs have experienced significant volatility over the past five years, with yarn prices swinging 25–40% between peaks and troughs, energy costs rising 30–50% across most manufacturing regions, and labor costs increasing 6–10% annually in India, Vietnam, and Bangladesh. Understanding these trends helps manufacturers set realistic costing assumptions and identify which cost components require the most urgent attention.
Efficiency Improvement Scenarios — Margin Impact Analysis
Three realistic improvement scenarios show how targeted investments in specific areas reduce overall cost per meter and improve gross margin. Each scenario models a achievable change within a 12–18 month timeframe based on demonstrated industry results from comparable mills.
Frequently Asked Questions About Textile Cost Per Meter
What is the most accurate method for calculating cost per meter?
The most accurate method is activity-based costing at the SKU or order level, where each cost component — yarn, conversion, energy, labor, depreciation — is tracked separately through the production process and allocated based on actual consumption rather than standard averages. This requires real-time data capture at each production stage, including actual yarn consumed (not theoretical), actual machine hours per order, actual energy metered to each production line, and actual labor hours booked to each production batch. Mills using this approach identify 8–15% more margin than mills using standard costing.
How does yarn cost vary by region and quality?
Yarn cost varies significantly by region (India 10–20% lower than China, Bangladesh 5–10% lower than India), yarn count (40s Ne 15–25% more expensive than 20s Ne), quality grade (combed vs carded adds $0.30–$0.60/kg), and fiber type (polyester 40–55% cheaper than cotton at equivalent counts). Vertically integrated mills that spin their own yarn typically achieve 5–12% lower yarn cost than mills buying from external spinners, depending on capacity utilization and cotton procurement efficiency.
What is a realistic cost per meter target for a competitive mill in 2026?
For a mid-weight cotton shirting fabric produced in India or Bangladesh, a competitive cost per meter target for 2026 is $4.80–$5.50 per meter, depending on yarn quality, automation level, and energy mix. Top-quartile mills achieve $4.50–$5.00 through a combination of vertical integration (owned spinning), renewable energy (25–40% solar or wind), high automation (90%+ air-jet looms, automated material handling), and lean manufacturing practices that keep waste below 3% and machine efficiency above 95%.
How can digital cost tracking improve profitability vs standard costing?
Digital cost tracking improves profitability by revealing which products, customers, and orders are actually profitable versus those that appear profitable under standard costing but consume disproportionate overhead. Mills implementing real-time cost tracking typically identify 15–25% of their production volume as negative-margin within six months — orders that win on price but lose on actual cost. Eliminating or repricing these orders while shifting capacity to higher-margin products typically improves overall gross margin by 3–6 percentage points within the first year.
What is the impact of energy cost on total cost per meter?
Energy represents 8–14% of total cost per meter for most textile mills, with spinning being the most energy-intensive process (45–55% of total mill energy consumption). A typical woven fabric mill consumes 4–8 kWh per meter of fabric, with electricity costs of $0.08–$0.14 per kWh depending on region. Mills that invest in energy monitoring, VFD installation on motors (25–35% savings on motor energy), compressed air leak management (20–30% savings), and solar or wind power generation (15–30% of total energy) typically reduce energy cost per meter by 15–25% within 18–24 months.
Take Control of Your Cost Per Meter With Real-Time Data
iFactory's cost analytics platform gives textile manufacturers the real-time cost visibility needed to identify margin leakage, optimize product mix, and improve profitability across every production run. Connect your MES, energy meters, and ERP to see true cost per meter at the order and SKU level.