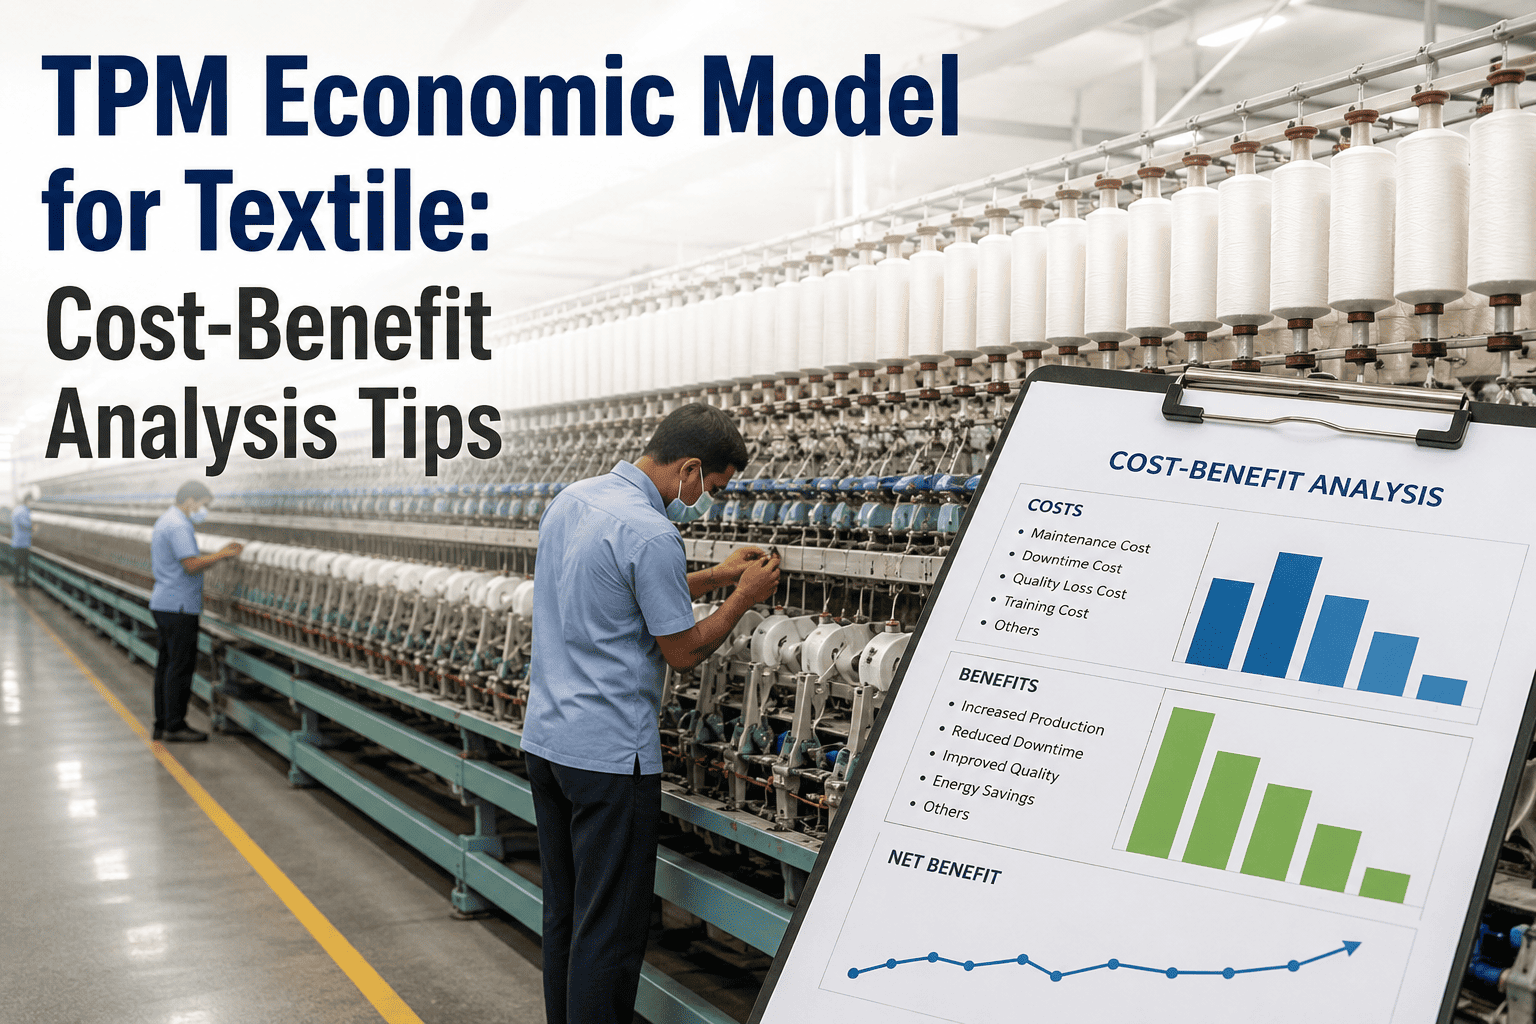
Total Productive Maintenance gets pitched to textile plant managers as a culture change — operators taking ownership of basic care, cross-functional teams chasing the eight pillars, visual boards on every machine. All of that is real, but it rarely survives a budget review unless it is backed by a number finance can defend. An economic model turns TPM from a philosophy into a line item with a payback period, and that shift is usually what determines whether a program gets funded past its first pilot cell. To walk through a model built for your specific mill, book a demo with iFactory.
Build a TPM Business Case Finance Actually Approves.
iFactory converts your machine downtime, defect, and maintenance spend data into a full TPM cost-benefit model — with payback period, not just a pillar checklist.
Most TPM Proposals Die Because They Skip the Economics
A typical TPM proposal in a textile mill lists activities: autonomous maintenance training, 5S implementation, OEE tracking boards, planned maintenance calendars. What it usually does not list is a number that translates those activities into rupees or dollars saved per quarter. Finance committees do not fund activity lists — they fund return on investment. Without an economic model attached to the pillar plan, TPM proposals compete for capital against projects that do have a clear payback period, and TPM almost always loses that competition even when it is the better long-term investment.
The fix is not to abandon the pillar structure — autonomous maintenance, planned maintenance, quality maintenance, and the rest remain the operational backbone of the program. The fix is to wrap each pillar in a cost-benefit calculation before asking for budget, so the proposal arrives with both the "how" and the "how much it's worth."
What a TPM Program Actually Costs to Run
Before benefits can be modeled credibly, the cost side needs to be complete and honest. Underestimating implementation cost is one of the fastest ways to lose finance's trust once the program is underway and the real spend starts to diverge from the pitch.
Training & Change Management
Operator autonomous-maintenance training, supervisor coaching, and the time cost of pulling staff off the line for structured learning sessions.
Visual Management Infrastructure
OEE boards, andon systems, tag-and-tackle supplies, and the physical 5S organization of tools and spare parts at each machine.
Planned Maintenance Buildout
Time-based maintenance calendars, spare parts inventory adjustments, and the labor reallocation from reactive to preventive maintenance work.
Data & Tracking Systems
CMMS licensing, OEE data collection tools, and the reporting infrastructure needed to prove the program is actually working over time.
See the Complete Cost Side of Your TPM Rollout Before You Commit.
iFactory helps you build an honest implementation cost estimate across training, infrastructure, and maintenance labor reallocation.
Where TPM Actually Generates Financial Return
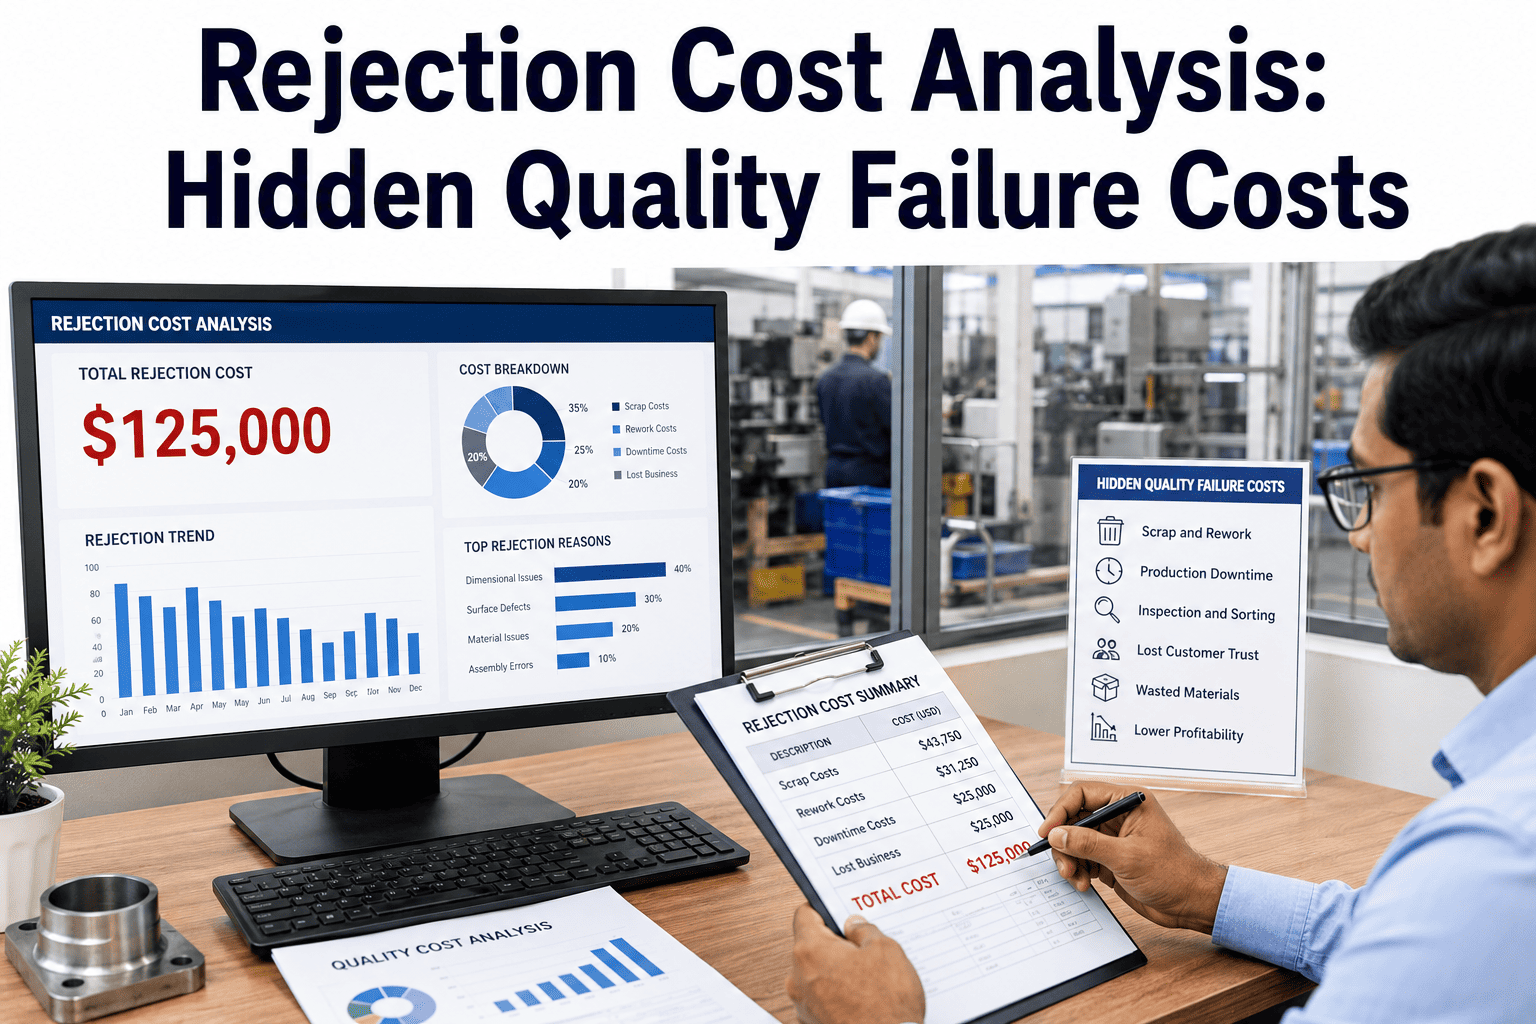
TPM's financial return comes from four converging effects, and the mistake most models make is only counting one — usually downtime reduction — while ignoring the other three, which often add up to a larger share of the total benefit than the headline number.
The percentages above represent typical shares of total quantified TPM benefit across established programs in discrete and process textile operations, not universal constants — every mill's mix depends on its starting OEE and defect baseline. What holds consistently true is that defect and rework reduction is usually underweighted in early proposals, even though quality maintenance activities under TPM directly target the same root causes driving overtime and material waste elsewhere in the plant.
A Representative Mill's TPM Economic Snapshot
The comparison below reflects a composite picture drawn from typical mid-size composite mills twelve months into a structured TPM rollout covering their two highest-downtime lines. It illustrates the shape of the economic case rather than a specific facility's guaranteed outcome.
| Metric | Before TPM | After 12 Months |
|---|---|---|
| Unplanned downtime (monthly) | 142 hours | 84 hours |
| First-pass quality rate | 91.2% | 96.4% |
| Reactive maintenance spend share | 68% | 34% |
| Overtime hours (monthly) | 620 | 410 |
| OEE | 61% | 74% |
When TPM Investment Typically Breaks Even
TPM is often criticized as a slow-return program, but the payback timeline is usually faster than assumed when the model is built correctly — because early wins in autonomous maintenance and quick-fix defect elimination generate savings well before the full pillar structure matures.
Pilot Cell Launch
Autonomous maintenance and 5S on one or two highest-downtime machines. Early quick-fix wins reduce minor stoppages measurably.
Planned Maintenance Rollout
Time-based maintenance replaces reactive repair on pilot cell machines. Spare parts cost begins declining as failure patterns become predictable.
Break-Even Point
Cumulative savings from downtime and rework reduction typically cross the cumulative implementation cost on the pilot lines around this point.
Plant-Wide Scaling
Proven pilot economics justify extending the program to remaining lines, with each new cell reaching break-even faster using the lessons learned.
Get a Quarter-by-Quarter Payback Projection for Your Mill.
Bring your current downtime, defect, and maintenance spend figures. iFactory builds the projection live in a working session.
Connecting Each TPM Pillar to a Specific Financial Outcome
TPM's eight pillars are often presented as a uniform framework, but each pillar drives a distinct category of financial benefit, and mapping them explicitly helps a plant justify investment in the specific pillars most relevant to its current cost structure rather than adopting all eight with equal intensity from day one.
Autonomous Maintenance
Operators catching early warning signs — unusual noise, vibration, temperature — before they become full failures. Primary savings: reduced unplanned downtime and lower reactive repair cost.
Planned Maintenance
Time-based and condition-based servicing replacing run-to-failure practices. Primary savings: extended equipment life and lower emergency spare parts premiums.
Quality Maintenance
Equipment condition standards designed specifically to prevent quality defects at the source. Primary savings: reduced rework, reduced material waste, reduced quality-linked overtime.
Focused Improvement
Cross-functional teams solving specific chronic loss problems using structured root-cause methods. Primary savings: elimination of the single largest repeat-offender losses on the floor.
Early Equipment Management
Applying maintenance lessons learned to the specification of new machines before purchase. Primary savings: avoided future maintenance cost on new capital investment.
Training & Skill Development
Building operator and technician capability to execute the other pillars effectively. Primary savings: indirect, but enables and sustains every other pillar's benefit.
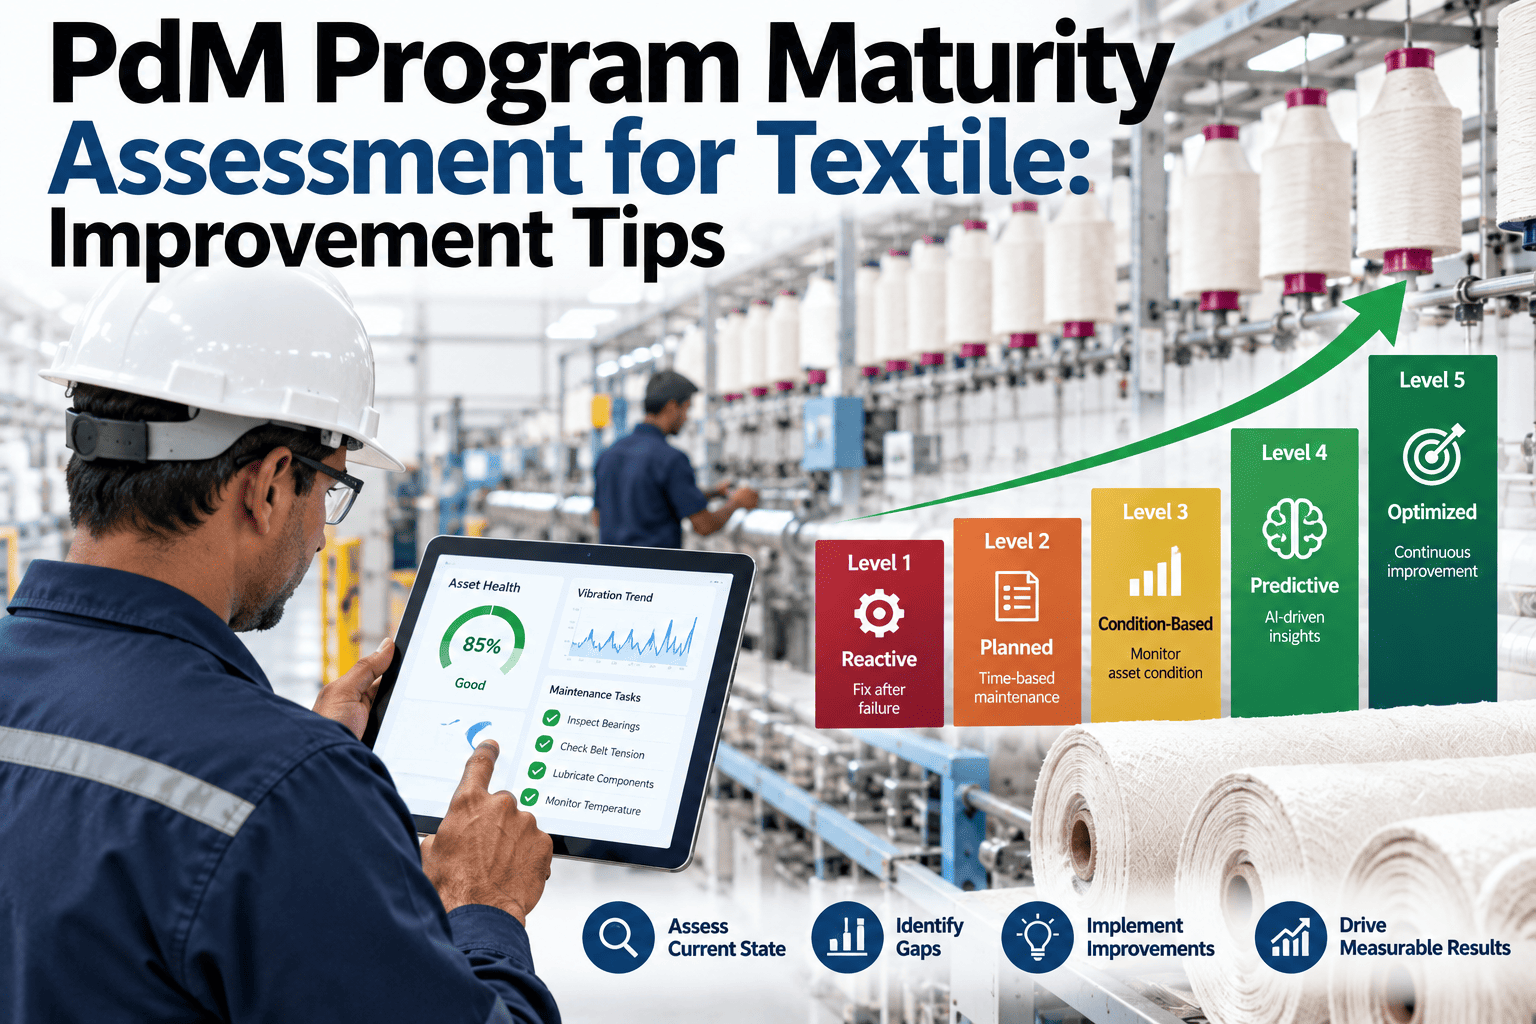
Most mills starting a TPM program get the fastest visible economic return by prioritizing autonomous maintenance and quality maintenance first, since these two pillars target the largest and most immediately measurable cost categories — unplanned downtime and rework — while focused improvement teams tackle the specific chronic problems identified along the way. Early equipment management and broader training investment tend to pay off over a longer horizon and are usually sequenced later in a program's maturity curve.
Where TPM Economic Models Go Wrong
Building the economic model is only half the challenge — keeping it credible over the life of the program requires avoiding a set of common modeling mistakes that erode trust with finance if they surface after the fact rather than being addressed upfront.
Counting Savings That Were Never Actually Realized
A projected downtime reduction that never shows up in the actual OEE numbers should be removed from the ongoing savings claim, not carried forward as a paper benefit. Models that keep counting projected-but-unrealized savings eventually collapse under scrutiny.
Ignoring the Cost of Sustaining the Program
Initial implementation cost is often modeled carefully, but the ongoing cost of sustaining autonomous maintenance routines, refresher training, and board maintenance is frequently left out — leading to an inflated long-term payback estimate.
Attributing Unrelated Improvements to TPM
If a mill also changes its raw material supplier or updates its production schedule during the same period as a TPM rollout, any resulting quality or efficiency gain should be carefully separated from TPM's specific contribution to avoid overstating the program's return.
Stress-Testing the Model Before You Present It
A single-scenario economic model is fragile — if the actual downtime reduction comes in below the projected figure, the entire business case can look discredited even if the program is still delivering meaningful value. Building a sensitivity analysis into the model from the start protects against this and demonstrates rigor to a finance audience that has likely seen overly optimistic projections before.
A useful sensitivity approach presents three scenarios side by side: a conservative case assuming benefits come in at roughly sixty percent of the base projection, the base case itself, and an optimistic case at roughly a hundred and twenty percent. Presenting all three, along with the payback period each implies, shows finance that the program still clears an acceptable threshold even under conservative assumptions — which is a far more persuasive argument than a single confident number that turns out to be wrong within two quarters. This approach also gives the program's champions a built-in defense if early results land below the base case, since the conservative scenario was already acknowledged as a realistic possibility from the outset rather than an excuse invented after the fact.
Conservative (60%)
Assumes slower adoption, partial pillar implementation, and benefits realized mainly in downtime reduction with limited quality gain in year one.
Base Case (100%)
Assumes steady execution against the implementation plan with benefits realized roughly in line with the modeled pillar-by-pillar projections.
Optimistic (120%)
Assumes strong operator engagement, fast quality gains, and compounding benefits as early wins accelerate adoption of later pillars.
Is Your Mill Actually Ready to Start a TPM Program?
Not every mill is equally positioned to launch a TPM program successfully, and an honest readiness assessment before requesting budget prevents a well-modeled economic case from failing due to organizational factors the model didn't account for. A few readiness indicators are worth checking before committing.
Leadership sponsorship matters more than almost any other factor — a TPM program championed only by a maintenance manager without visible support from plant leadership tends to stall the first time competing priorities emerge. Baseline data availability matters too: a mill with no existing downtime or quality tracking will need to invest in basic data capture before an economic model can even be built, which should be planned as an earlier, separate phase rather than assumed to happen automatically alongside pillar implementation. Finally, operator capacity for training time needs a realistic assessment — a mill running at maximum capacity with no slack for training hours will need to plan the rollout around lower-demand periods rather than committing to an aggressive timeline that competes directly with production targets.
What Data to Gather Before the First Modeling Session
Coming to an economic modeling exercise with the right data prepared in advance makes the difference between a productive first session and one spent chasing down numbers that should have been ready beforehand. A short checklist of figures, gathered from maintenance, quality, and finance records, covers most of what's needed to build a credible first draft.
From maintenance records, gather monthly unplanned downtime hours by machine or line for at least the past two to three quarters, along with current reactive versus planned maintenance labor cost split and recent spare parts spend by category. From quality records, gather first-pass yield or rejection rate trends over the same period, along with an estimate of rework labor and material cost per rejected batch where available. From finance or payroll records, gather total overtime spend over the same period and, if possible, a rough split of overtime by department, even if the downtime-versus-rework causal link hasn't yet been established. With these figures in hand, a first-draft economic model can typically be assembled within a single working session rather than requiring weeks of data-gathering before any modeling conversation can even begin.
How the Economic Case Evolves Beyond Year One
A TPM economic model built for the initial funding decision naturally focuses on the first-year payback case, but the program's financial character changes meaningfully as it matures, and the economic model should be revisited rather than treated as a one-time document.
In the second and third years, the cost side typically declines as initial training and infrastructure investment tapers off into a smaller ongoing maintenance cost for the visual management systems and periodic refresher training. Meanwhile, the benefit side often continues growing as focused improvement teams work through a deeper backlog of chronic loss problems and as early equipment management begins influencing new capital purchases with better long-term reliability characteristics built in from the start. Mills that revisit and update their economic model annually, using actual results rather than the original projections, build an increasingly credible internal capability for justifying continued investment — and this updated model becomes the foundation for expanding TPM to additional lines or departments beyond the original pilot scope, using real multi-year data rather than a fresh projection built from scratch each time.
TPM Economic Modeling — Common Questions
How much data history do we need before building a TPM economic model?
A minimum of three to six months of downtime, quality rejection, and maintenance spend history is usually enough to establish a credible baseline, though twelve months is preferable if seasonal order patterns affect your production mix. If your mill does not yet track this data systematically, iFactory can help establish the baseline tracking first and build the economic model once a reliable few months of data exist, which typically only delays the proposal by one quarter rather than a full year.
Should we model the whole plant or start with one or two pilot lines?
Starting with one or two of the highest-downtime lines is the standard approach, because it produces a faster, more defensible payback case and gives the organization real operational lessons before committing plant-wide budget. Modeling the entire plant upfront tends to produce an average figure that undersells the actual opportunity on your worst-performing lines and oversells the opportunity on your best-performing ones, weakening the case either way.
How do we account for the labor cost of pulling operators into training?
The lost-production cost of training time should be included as a real cost in the model, typically calculated as the standard hourly output value of the machine multiplied by the hours operators spend away from the line. Many mills schedule this training during planned changeovers or lower-demand shifts specifically to minimize this cost, and that scheduling choice can meaningfully improve the payback timeline shown in the model. Contact support for guidance on structuring a low-disruption training schedule.
What happens if the actual results fall short of the modeled projection?
Economic models are directional planning tools, not guarantees, and actual results depend on execution discipline as much as the underlying opportunity. The value of building the model correctly in the first place is that it identifies which specific machines and defect modes carry the largest opportunity, so even if total savings land below projection, the program is still targeting the highest-value areas rather than spreading effort evenly across the plant. Book a demo to see how tracking actual-versus-modeled results works over time.
Turn Your TPM Pitch Into a Number Finance Can't Ignore.
iFactory builds the full cost-benefit model — cost side, benefit side, payback timeline — using your actual production and maintenance data.