Most textile mills that have invested in predictive maintenance sensors do not have a clear answer to a fundamental question: how mature is our program actually? Sensors installed on a handful of critical machines is not the same as a functioning PdM program, and mills often discover the gap only after months of collecting vibration and thermal data that nobody has translated into a repeatable maintenance decision process. A structured maturity assessment gives plant and maintenance leaders an honest starting point. Mills ready to benchmark where they stand can Book a Demo to walk through a maturity evaluation against their current PdM deployment.
Why Sensor Count Is a Poor Proxy for PdM Maturity
It is tempting for a mill to measure the success of its predictive maintenance investment by counting how many machines have sensors installed, but that number says almost nothing about whether the program is actually preventing failures or improving reliability outcomes. A mill can have accelerometers on fifty looms and still be operating a fundamentally immature program if nobody reviews the data consistently, if alerts do not connect to a defined maintenance response, or if the organization has no process for refining thresholds as more data accumulates. Conversely, a smaller, tightly integrated deployment on ten critical machines with a disciplined alert-to-action workflow often delivers more measurable reliability improvement than a much larger but loosely managed sensor footprint.
The Three Dimensions of PdM Program Maturity
A useful maturity assessment evaluates a mill's predictive maintenance program across three distinct dimensions rather than treating it as a single pass-or-fail measure. Technology coverage looks at what is actually being monitored and how well the sensor and data infrastructure covers the machines and failure modes that matter most. Analysis capability looks at whether the organization can actually interpret the data being collected — distinguishing a genuine early warning signal from normal variation — and translate it into a specific, actionable maintenance task. Organizational integration looks at whether PdM has become embedded into daily maintenance planning, spare parts forecasting, and cross-functional decision-making, or whether it remains a standalone initiative that technicians engage with inconsistently.
Technology Coverage
Measures sensor deployment breadth against critical asset inventory, data quality and uptime, and whether monitoring extends across the specific failure modes most relevant to each machine type rather than a generic vibration-only approach.
Analysis Capability
Measures whether the team can reliably distinguish genuine wear signals from noise, how thresholds are set and refined over time, and whether root cause analysis feeds back into improving future alert accuracy.
Organizational Integration
Measures whether alerts automatically generate maintenance work orders, whether PdM data informs spare parts planning and capital decisions, and whether the program has executive visibility and sustained resourcing.
The Five Maturity Levels: From Ad Hoc to Optimized
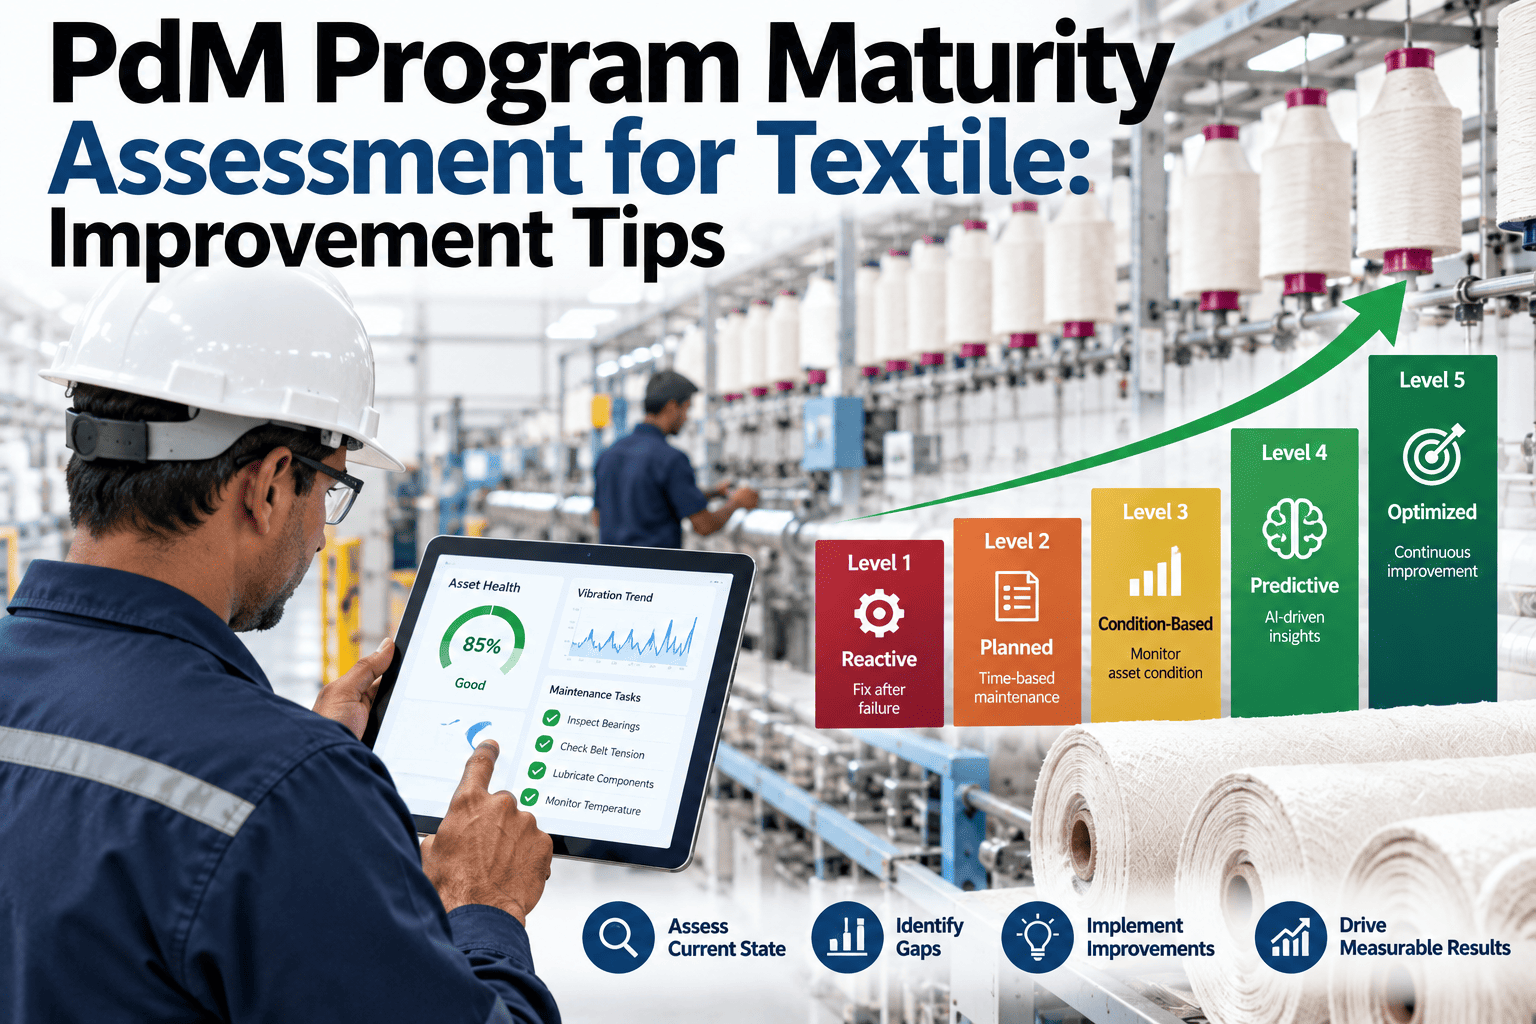
Plotting a mill's score across all three dimensions typically places the overall program at one of five recognizable maturity levels, each with distinct operational characteristics. Understanding which level a mill currently occupies — and, just as importantly, understanding that different machines or departments within the same mill can sit at different levels — is what makes the assessment useful for planning rather than just descriptive.
Scoring Your Program: What to Look For at Each Level
Assessing maturity honestly requires looking past the presence of technology and asking specific, concrete questions about how that technology is actually used day to day. A mill claiming Level 4 integration should be able to point to specific examples of spare parts orders that were placed based on condition trend data rather than fixed reorder points, and specific maintenance schedule adjustments made in response to alerts rather than calendar dates. Without this kind of concrete evidence, a mill is likely overestimating its own maturity based on the sophistication of the sensors installed rather than the sophistication of the decisions being made with the resulting data.
| Assessment Question | Level 2–3 Indicator | Level 4–5 Indicator |
|---|---|---|
| How are alert thresholds set? | Default vendor settings, rarely adjusted | Continuously refined using accumulated failure data |
| What happens when an alert fires? | Reviewed manually, inconsistent follow-up | Automatically generates a scheduled work order |
| How does data inform spare parts? | No connection to inventory decisions | Reorder points adjusted from condition trends |
| Who reviews program performance? | Maintenance team only, informally | Cross-functional review with executive visibility |
Building an Improvement Roadmap From Your Assessment Score
A maturity assessment only creates value when it leads to a specific improvement plan rather than sitting as a diagnostic exercise on its own. The most effective roadmaps target the dimension with the lowest score first, since a mill with excellent technology coverage but weak organizational integration will not see meaningful reliability improvement until alerts actually connect to maintenance action — no amount of additional sensor deployment fixes that gap. Similarly, a mill with strong analysis capability but narrow technology coverage should prioritize expanding sensor deployment to more critical assets before investing further in analytics sophistication that only a fraction of the fleet can benefit from.
Score Each Dimension Honestly
Evaluate technology coverage, analysis capability, and organizational integration independently, using concrete evidence rather than general impressions of program sophistication.
Identify the Weakest Dimension
Target the lowest-scoring dimension first, since improvement there typically unlocks value trapped in the mill's existing investment in the other two dimensions.
Set a 90-Day Improvement Target
Define a specific, measurable target for the weakest dimension — such as connecting alerts to automatic work order generation — rather than a vague goal of "improving PdM maturity."
Re-Assess Quarterly
Repeat the maturity scoring on a regular cadence to track progress objectively and catch dimensions that have quietly regressed as staff or priorities change.
Common Maturity Gaps Across Textile Mills
Across a wide range of textile mills evaluated against this framework, certain maturity gaps recur often enough to be worth calling out specifically, because recognizing a familiar pattern in your own operation can accelerate the improvement planning process considerably. The most common gap by far sits between technology coverage and organizational integration — mills that have made a genuine investment in sensors and monitoring infrastructure but have not built the workflow discipline to convert that data into consistent maintenance action. This gap is particularly common in mills where the PdM initiative was driven by a single champion rather than embedded into standard maintenance procedure, meaning the program's effectiveness fluctuates heavily with that individual's availability and attention.
A second common gap appears in mills that have achieved strong analysis capability on a narrow set of pilot machines but have never built a repeatable process for extending that capability to the broader fleet. The lessons learned calibrating thresholds and interpreting alerts on the pilot machines remain tribal knowledge rather than documented procedure, which means every new machine added to the monitoring program essentially restarts the learning curve rather than building on what the team already knows. Mills that formalize this knowledge into documented calibration procedures and failure mode libraries scale their PdM programs considerably faster than those relying on informal experience alone.
Who Should Lead the Maturity Assessment Process
Deciding who owns the maturity assessment matters as much as the framework itself, because the answer shapes whether the resulting roadmap gets taken seriously across departments or treated as a maintenance-department-only initiative that quietly loses priority when production pressure increases. The strongest assessments are led jointly by maintenance leadership and a plant operations or reliability sponsor with enough organizational standing to commit resources to the improvement plan that follows, rather than being run solely by whichever technician happens to be the most enthusiastic about the sensor technology. This joint ownership matters most at the organizational integration dimension, since closing gaps there almost always requires cross-departmental commitment — spare parts planning, scheduling, and capital budgeting all sit outside a typical maintenance technician's direct authority.
Bringing in an outside perspective for the assessment itself, even when the improvement work will ultimately be led internally, also has real value. Internal teams naturally develop blind spots about their own program after months or years of incremental investment, and an outside assessor asking direct, evidence-based questions — show me the last five alerts and what happened after each one — often surfaces gaps that internal self-assessment tends to gloss over entirely, simply because familiarity with a long-running program breeds a kind of comfortable blindness to its weaker points. This is particularly true for organizational integration, where internal teams can mistake the existence of a process on paper for a process that is actually followed consistently on the floor.
Avoiding the Trap of Over-Investing in Technology Before Process
A recurring pattern among textile mills beginning their PdM journey is a strong bias toward solving maturity gaps by purchasing more sensors or more sophisticated analytics software, largely because technology purchases are easier to approve and easier to point to as visible progress than the slower, less glamorous work of building consistent maintenance workflow discipline. This bias is understandable but frequently counterproductive — a mill sitting at Level 2 maturity because alerts do not reliably generate maintenance action will not improve outcomes by adding more sensors that generate more unactioned alerts. The technology investment compounds the existing organizational gap rather than closing it, and mills often only recognize this after a year or more of expanding sensor coverage with disappointingly flat reliability metrics.
The corrective approach is to sequence investment deliberately according to the maturity assessment results rather than defaulting to technology expansion as the first response to any reliability concern. A mill that scores low on organizational integration gets more value from a focused, low-cost initiative — defining alert response ownership, building the workflow connection between alerts and work orders, training technicians on a specific response playbook — than from a six-figure sensor expansion that will simply generate more data flowing into the same broken process. Sequencing technology investment to follow, rather than precede, organizational readiness is one of the clearest patterns separating mills that reach Level 4 and 5 maturity from those that plateau indefinitely at Level 2 or 3 despite continued spending.
Frequently Asked Questions: PdM Program Maturity Assessment
How long does a full maturity assessment typically take to complete for a mid-sized mill?
A structured maturity assessment covering technology coverage, analysis capability, and organizational integration across a mid-sized mill's critical asset base typically takes two to three weeks, including interviews with maintenance leadership and technicians, a review of alert and work order data from the past several months, and a walkthrough of how spare parts and scheduling decisions currently incorporate condition data. Mills can Book a Demo to see the assessment framework and discuss timeline for their specific operation, including which existing data sources — work order history, alert logs, spare parts records — can be reused to speed up the evaluation rather than starting the data collection process entirely from scratch.
Can different departments or machine types within the same mill sit at different maturity levels?
Yes, and this is extremely common — a mill's dyeing department might have reached Level 4 integration with condition data feeding directly into maintenance scheduling, while the weaving shed remains at Level 2 with sensors installed but no consistent review process. Recognizing this variation is important because it means the improvement roadmap should be tailored department by department rather than applying a single mill-wide maturity score and improvement plan uniformly across very different operational realities, and it also means that a department further along the maturity curve can often serve as an internal reference point and training ground for the rest of the mill rather than requiring outside expertise for every subsequent rollout phase.
What is the single most common reason mills stall at Level 2 or 3 maturity?
The most common cause of stalling is the absence of a defined, owned process for converting alerts into maintenance action — without this workflow discipline, even well-calibrated sensor data accumulates without changing what technicians actually do day to day. Mills that break through this stall point typically do so by assigning explicit ownership of the alert review process to a specific role rather than leaving it as an informal, shared responsibility that nobody consistently prioritizes during busy production periods.
Does reaching Level 5 maturity require a large dedicated reliability engineering team?
Not necessarily — while larger reliability teams can accelerate the journey, mid-sized mills reach Level 4 and even Level 5 maturity by building strong documented processes and clear ownership rather than by simply adding headcount, since much of what separates the higher maturity levels is workflow discipline and cross-functional integration rather than raw analytical staffing. Contact iFactory Support for guidance on structuring a maturity improvement plan that fits your current team size.
How often should a mill formally re-run the maturity assessment once an improvement plan is underway?
A quarterly re-assessment cadence works well for most mills actively working through an improvement roadmap, since it is frequent enough to catch stalled progress or quiet regression in a specific dimension while not so frequent that it becomes a distraction from the actual improvement work itself. Mills further along in maturity, closer to Level 4 or 5, often shift to a twice-yearly cadence once the program has stabilized and the focus moves toward incremental refinement rather than structural change, using the extra time between assessments to deepen analysis capability, expand sensor coverage into secondary assets, and document the calibration knowledge that newer team members will eventually rely on as the original program champions move into other roles.
Making Maturity Progress Visible to Leadership
Sustained investment in closing PdM maturity gaps depends heavily on leadership being able to see progress in terms they care about, and a maturity score alone rarely holds attention for long unless it is paired with the operational outcomes that score is supposed to predict. Pairing each quarterly re-assessment with a short summary of avoided downtime hours, reduced redye or defect rates, and shifts in the planned-to-reactive maintenance ratio gives plant leadership concrete evidence that the maturity work is translating into results rather than remaining an internal maintenance department exercise. This pairing also helps maintenance leaders make the case for continued resourcing when competing priorities put pressure on the improvement roadmap's timeline.
Mills that sustain long-term maturity improvement typically build this reporting rhythm into an existing management review cycle rather than creating a separate standalone reporting process that competes for attention. A brief maturity and reliability update folded into the monthly operations review, for example, keeps the program visible without adding meaningful administrative burden, and it gives cross-functional stakeholders — production planning, quality, and procurement — regular visibility into how the PdM program's maturity is evolving and where their own departments may need to engage more closely to help close a specific gap identified in the assessment.