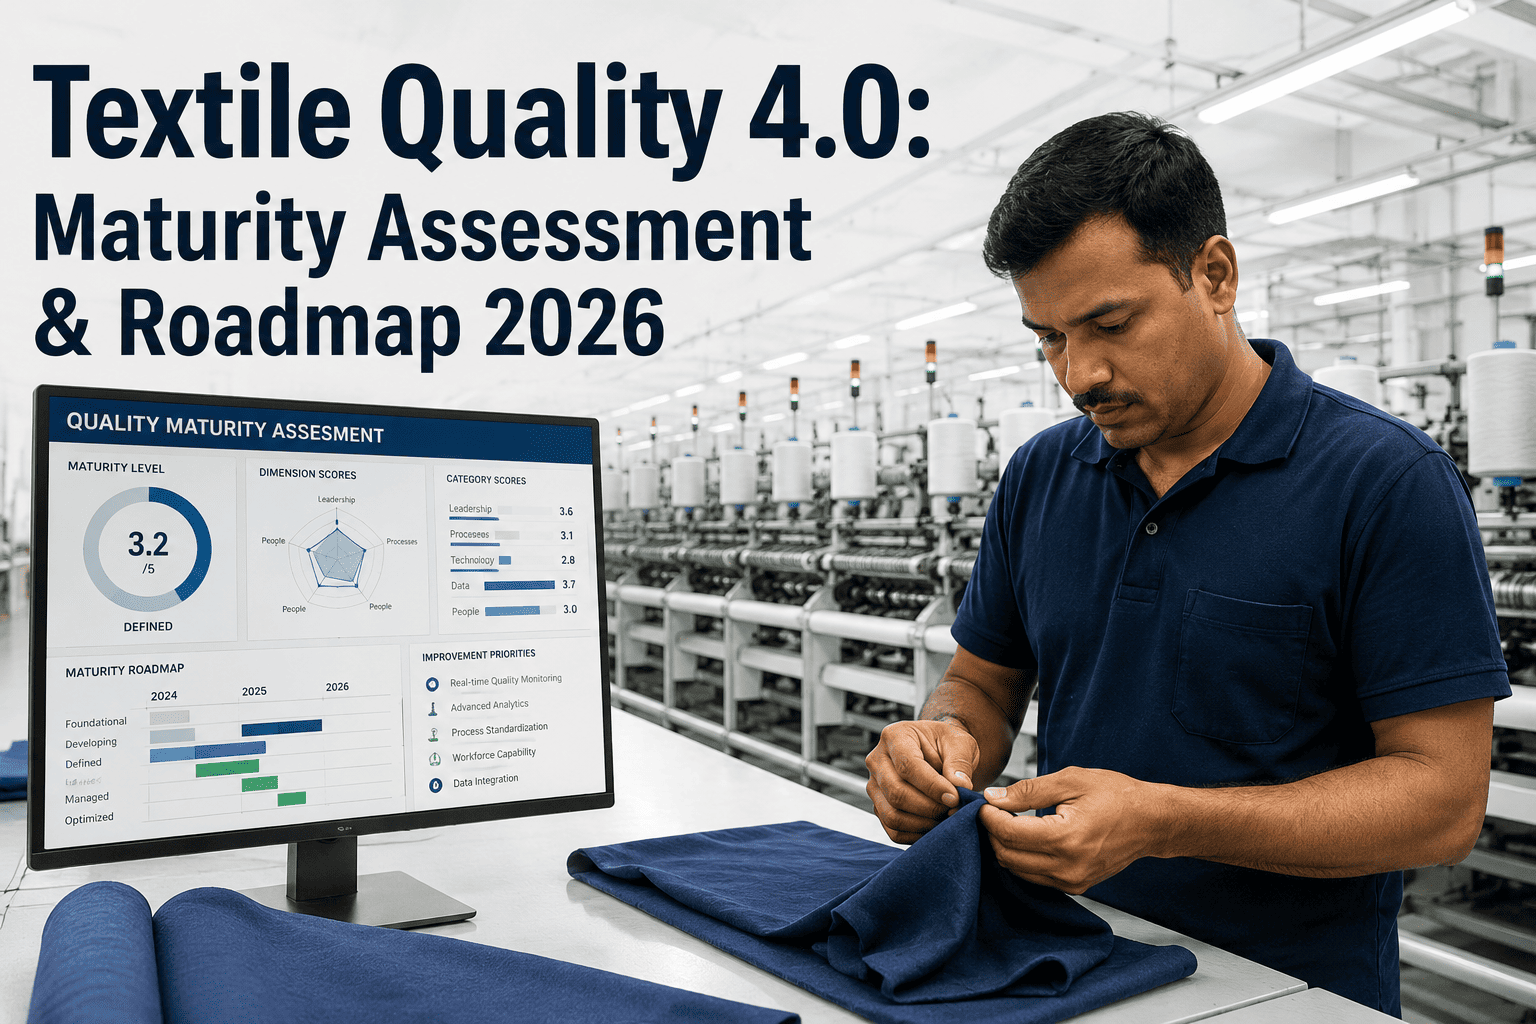
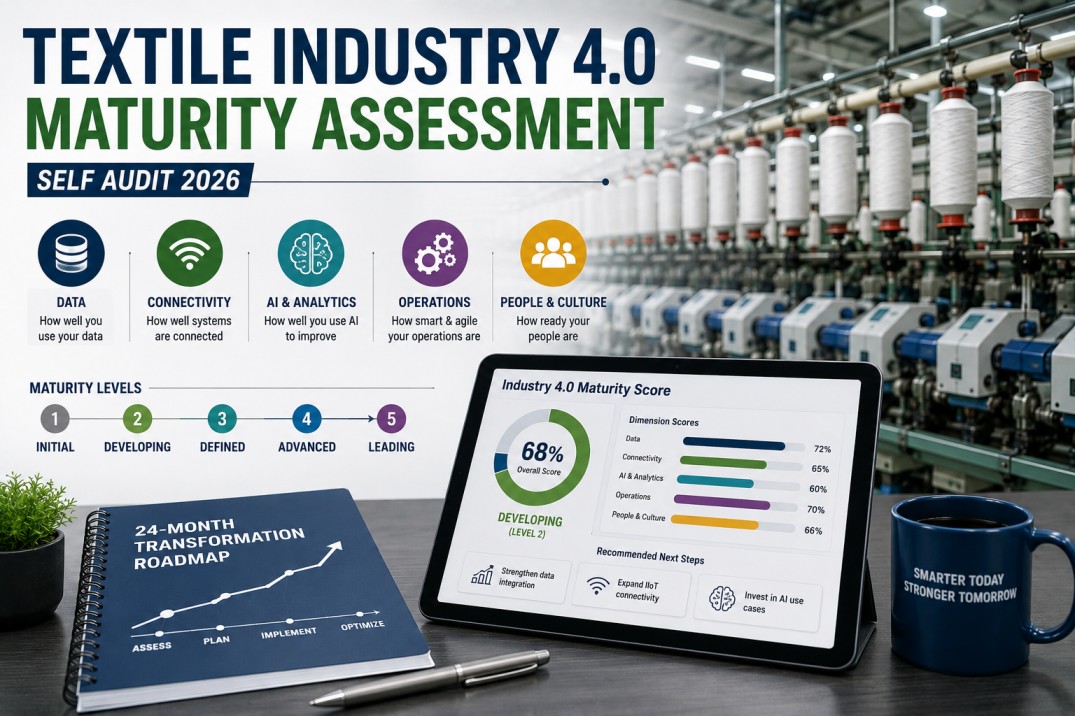
Ask ten textile plant managers where their quality program sits on the Industry 4.0 curve and most will answer with a guess rather than a score. That guess usually undersells the plant's real position, or worse, overstates it. A recent readiness study across more than 100 textile units found the majority still cluster in the earliest readiness stages, with technology maturity consistently the weakest dimension — not because the tools don't exist, but because strategy and workforce readiness lag behind the equipment on the floor. iFactory's textile quality platform gives that guess a real score, and the score a roadmap.
Textile Quality 4.0: Maturity Assessment & Roadmap
Six stages separate a paper-based inspection floor from a fully connected, self-correcting quality system. This guide scores where most textile plants actually sit, and maps the path from wherever you are now to the next stage up.
Why Textile Quality Maturity Lags Behind Other Manufacturing Sectors
Textile manufacturing carries a specific set of conditions that slow digital quality adoption in ways that discrete manufacturing sectors like automotive or electronics rarely face. Production runs are labor-intensive across cutting, sewing, dyeing, and finishing. Supply chains span multiple countries and multiple tiers of subcontracted capacity. And critically, the industry is defined by the coexistence of decades-old mechanical equipment running alongside newly installed sensor-driven lines on the same production floor — a condition that makes a single, uniform digital rollout far harder than it looks on a vendor slide deck.
A multi-criteria readiness study across the textile sector found a result that runs counter to the usual assumption: Strategy, not Technology, is the dimension that most strongly predicts overall digital maturity. Plants with clear digital strategy and organizational alignment consistently outperform plants that have purchased more sensors and software but never built the strategic or workforce foundation to use them well. Technology, ranked dead last in influence among the maturity dimensions studied, is necessary but not sufficient — and it is very often the dimension textile plants over-invest in relative to the others.
This finding has a practical consequence that reshapes how a maturity roadmap should actually be sequenced. A plant tempted to lead its transformation budget with a large capital purchase — a new vision inspection system, a fleet of IoT sensors, a predictive analytics platform — is very often solving for the dimension that will move the maturity needle least, while leaving the dimension that moves it most, strategy and organizational alignment, effectively untouched. The technology still has value once the strategic foundation exists to direct it, but sequencing it first is a common and expensive mistake that readiness research across the sector consistently identifies.
Find Out Which Dimension Is Actually Holding Your Plant Back
iFactory's maturity assessment scores your plant across all six dimensions, not just the technology on the floor — so the roadmap targets the real constraint.
The Six Stages of Quality 4.0 Maturity
The Quality 4.0 Capability Roadmap organizes the transition into six stages — three stages of foundational readiness, followed by three stages of active maturity. Each stage carries a specific theme and a specific set of capabilities that must be in place before a plant can credibly claim the next stage. Skipping stages is where most digital quality initiatives stall: a plant that jumps straight to predictive analytics without first stabilizing basic digital data capture ends up with a dashboard nobody trusts.
Paper-Based
Inspection records on paper or spreadsheets. No digital traceability between batch, machine, and defect. Quality decisions rely on inspector memory and manual sampling.
Digitally Aware
Basic digital work order or inspection logging exists on some lines. Data is captured but rarely analyzed — it sits in disconnected spreadsheets or standalone software with no cross-line visibility.
Connected
Core systems — ERP, quality management, and at least some machine data — begin exchanging data automatically. Defect data can be traced back to a specific machine and shift, not just a batch.
Data-Driven
Real-time dashboards replace end-of-shift reports. Statistical process control runs on live data. Quality teams shift from reactive inspection to active monitoring of process variables as they drift.
Predictive
Machine learning models flag defect risk before parts are produced, using historical patterns across machine, material lot, operator, and environmental conditions. Vision-based defect detection runs in-line, not at end-of-line inspection.
Self-Correcting
The system doesn't just predict a defect — it adjusts process parameters automatically to prevent it, with human oversight rather than human intervention as the default operating mode.
What Each Stage Actually Looks Like on a Textile Floor
The stage names above are abstractions. What separates them in practice, on an actual textile production floor, is a specific and observable set of capabilities — not a certification or a purchased software license.
A plant at this level typically has some form of computerized record-keeping — an ERP for orders, a spreadsheet for defect tracking — but the systems don't talk to each other. Defect data exists somewhere, but reconstructing which loom, which shift, and which material lot produced a specific quality issue requires manually cross-referencing multiple sources, often after the fact. This is where the majority of textile plants sit today, and it is not a criticism: it reflects the genuine difficulty of digitizing a labor-intensive, multi-process production floor with legacy equipment still in active use.
The defining shift at this level is traceability that works without manual reconciliation. A defect found at final inspection can be traced back to a specific machine, shift, and material lot in seconds, not hours. Statistical process control moves from a periodic sampling exercise to continuous monitoring, and quality teams start catching process drift before it produces an out-of-spec part rather than discovering the defect after the fact. This is also typically where automated in-line inspection — image processing and vision systems checking fabric density, color consistency, and weave defects at production speed — starts to replace end-of-line sampling as the primary detection method.
Very few textile plants operate consistently at this level today, and that scarcity is itself informative — it confirms that the earlier stages are prerequisites, not optional steps to skip. A plant here has enough historical data, across enough production cycles, to train models that flag defect risk before a part is produced, based on the combination of machine condition, material lot characteristics, and even operator and environmental variables. The self-correcting stage goes one step further: the system doesn't just flag risk, it adjusts controllable process parameters automatically, with a human reviewing exceptions rather than every decision.
Reaching Stage 5 or 6 is not primarily a software purchase — it is the product of years of consistent Stage 3 and Stage 4 discipline generating the clean, connected, high-volume data that any predictive model actually requires to be trustworthy. A plant that has run reliable machine-to-defect traceability and continuous SPC for several years arrives at Stage 5 with a genuine data asset. A plant that skips straight to purchasing a predictive analytics platform without that history arrives with a model trained on gaps, and a quality team that quickly learns not to trust its outputs — which defeats the purpose of the investment entirely.
Move From Stage 2 to Stage 4 Without Skipping the Foundation
iFactory builds the traceability and live-monitoring layer that Stages 3 and 4 require, on top of the equipment your plant already runs — no forklift upgrade of legacy machinery required.
Capability Gap Scorecard: Where to Look First
A maturity assessment is only useful if it produces a specific, prioritized list of gaps — not a single score with no direction attached. The table below reflects the capability gaps most commonly found across textile plants during a Quality 4.0 readiness review, ranked by how frequently they appear as the binding constraint. Reading the table left to right tells a story: the highest-priority gaps cluster at the earliest maturity stages, which is exactly the pattern the sequencing principle above predicts — foundational gaps block everything built on top of them, so closing them first has outsized leverage compared with addressing a later-stage gap in isolation.
| Capability Gap | Typical Stage Found | Why It Blocks Progress | Fix Priority |
|---|---|---|---|
| No machine-to-defect traceability | Stage 1-2 | Root cause investigation takes hours instead of seconds | Highest |
| Quality data isolated from production data | Stage 2-3 | Correlation between process drift and defects stays invisible | High |
| Inspection is end-of-line only | Stage 2-3 | Defects are found after all downstream cost has already been added | High |
| No SPC on live process variables | Stage 3 | Process drift is caught reactively, not before it produces scrap | Moderate |
| Insufficient historical data volume | Stage 4 | Predictive models cannot be trained reliably without enough cycles | Moderate |
| Workforce not trained on digital tools | All stages | Adoption stalls regardless of how capable the technology is | Ongoing |
Common Barriers Specific to Textile Manufacturing
Digital transformation barriers in textile manufacturing are well documented across multiple readiness studies, and a consistent pattern emerges regardless of geography: the obstacles are rarely purely technical. Interpretive structural modeling research across the sector has mapped dozens of individual barriers into a small number of root causes that drive most of the resistance — and understanding which barriers are causes versus which are symptoms changes where a plant should actually spend its improvement effort.
SME resource constraints. The majority of textile and clothing manufacturers operate as small or medium enterprises with limited capital for large digital investments, limited in-house IT infrastructure, and limited access to specialized digital skills — a constraint that shapes what a realistic roadmap looks like far more than any technology limitation.
Legacy equipment coexisting with new investment. A textile floor rarely replaces its entire equipment base at once. Older mechanical looms and finishing equipment continue running alongside newly installed sensor-driven lines, which means any digital quality strategy has to work with partial, uneven data availability rather than assuming uniform connectivity across every machine.
Unreliable IT infrastructure. Continuous, reliable data flow — both within a single production line and across the wider plant network — depends on infrastructure that many textile facilities, particularly in developing manufacturing regions, have not yet built out. Weak signal strength and unreliable networks can quietly undermine an otherwise well-designed digital rollout.
Data silos between departments. A majority of textile factories report that data generated on the production floor stays disconnected from the systems used by quality, planning, and management — meaning the data exists, but nobody downstream of the machine can actually use it without manual re-entry.
Change resistance and leadership commitment. Technology adoption research across manufacturing SMEs consistently identifies workforce resistance and inconsistent leadership commitment as barriers that outrank cost or technical complexity — a finding that reinforces why Strategy, not Technology, predicts maturity most strongly.
Building a Realistic Roadmap: Sequencing Over Speed
A maturity roadmap that tries to compress six stages into a single fiscal year budget almost always underperforms one that sequences deliberately and treats each stage as a genuine prerequisite for the next. The plants that make the fastest sustained progress typically follow a pattern that looks slower on paper in year one and considerably faster by year three, because the foundation actually holds.
The first phase of a realistic roadmap addresses the dimension the readiness research identifies as most predictive: strategy and organizational alignment. This means naming a clear owner for the quality data program, defining what "good" looks like at each stage, and securing leadership commitment that survives the first difficult quarter rather than evaporating when the initial investment doesn't produce an immediate return. Only once that foundation exists does it make sense to move into the second phase — closing the specific connectivity and traceability gaps identified in a capability assessment, prioritized by which gap is currently the binding constraint rather than which gap has the flashiest available technology solution. The third phase, predictive and self-correcting capability, only becomes realistic once the first two phases have generated enough clean, connected historical data to train a model that can actually be trusted.
Quality 4.0 Maturity KPIs to Track
Defect-to-Root-Cause Time
Time from a defect being flagged to identifying the specific machine, shift, and material lot responsible. The clearest single indicator of traceability maturity.
In-Line Inspection Coverage
Percentage of total production volume checked by automated in-line vision or sensor systems rather than end-of-line sampling alone.
Machine Data Connectivity
Percentage of production equipment feeding data automatically into a central quality system, rather than requiring manual data entry or remaining fully disconnected.
End-of-Line Rejection Rate
Defects caught only at final inspection, after full production cost has already been incurred. A falling trend indicates earlier-stage detection is maturing.
Workforce Digital Tool Adoption
Share of relevant staff actively using digital quality tools rather than reverting to parallel paper processes. Low adoption despite available technology signals a workforce or change-management gap, not a technology gap.
Stage Progression
Movement through the six-stage maturity model over a defined review period, assessed against the specific capabilities each stage requires — not a subjective self-rating.
Every textile plant I've assessed believes its biggest gap is technology — they want to talk about sensors and AI models before we've even discussed whether their quality and production data can find each other. The readiness research backs up what the floor tells me every time: strategy and organizational alignment predict maturity far better than the hardware installed. A plant with modest sensors and a clear digital strategy consistently outperforms a plant with excellent sensors and no plan for who owns the data or what happens when it flags a problem. Buy less technology and build more strategy first — the roadmap gets shorter, not longer.
Frequently Asked Questions
A credible maturity score requires assessing capabilities across multiple dimensions — strategy and organization, machine connectivity, data flow between systems, workforce adoption, and the sophistication of quality detection methods in use — rather than a single self-reported number. Readiness research consistently shows Strategy carries the most predictive weight, so an assessment that only inventories installed technology will systematically overstate maturity. The honest starting point is usually a structured audit against each stage's specific required capabilities, not a survey asking managers to rate themselves. Book a demo to run a structured maturity assessment against your plant's actual capabilities.
Not reliably. Predictive models require substantial historical data volume across enough production cycles to identify meaningful patterns, and that data only exists if earlier-stage capabilities — machine connectivity, consistent digital data capture, reliable traceability — are already in place. A plant that invests in predictive analytics software before stabilizing its data foundation typically ends up with a model trained on incomplete or unreliable data, producing predictions nobody trusts enough to act on. Book a demo to see how iFactory sequences the data foundation before layering on predictive capability.
Textile production floors rarely replace their entire equipment base in a single transition, which means older mechanical looms and finishing equipment typically continue running for years alongside newly installed sensor-driven lines. Any realistic digital quality strategy has to account for this uneven connectivity from the start, rather than assuming every machine can report data automatically. Plants that plan around full uniform connectivity from day one frequently stall when a significant share of their actual production equipment cannot participate in that plan. Book a demo to see how iFactory bridges legacy equipment into a unified quality data layer.
End-of-line inspection catches defects after a part has already moved through every downstream production step, meaning the full cost of material, labor, and machine time has already been incurred by the time the defect is found. In-line inspection — automated vision and sensor systems checking fabric density, color consistency, and weave defects at production speed — catches the same defect at the point of creation, at a fraction of the accumulated cost. Moving inspection coverage from end-of-line toward in-line is one of the clearest, most measurable signs of advancing maturity on a textile floor. Book a demo to see in-line defect detection integrated with your quality data platform.
Resource constraints are real and well documented across SME textile research — limited capital, limited in-house IT infrastructure, and limited specialized digital skills all shape what a realistic transformation timeline looks like. But maturity progression does not require replicating a large enterprise's full technology stack; the readiness research is clear that strategic clarity and workforce alignment predict outcomes more strongly than the scale of technology investment. An SME with a focused, sequenced roadmap targeting its actual capability gaps regularly outperforms a larger competitor that bought more software without the organizational foundation to use it. Book a demo to see a maturity roadmap scaled to your plant's size and resources.
Score Your Plant's Real Stage, Then Get the Roadmap to the Next One
iFactory assesses your textile plant across the dimensions that actually predict maturity — strategy, connectivity, data flow, and workforce adoption — and builds a prioritized capability roadmap from there.

.jpg)