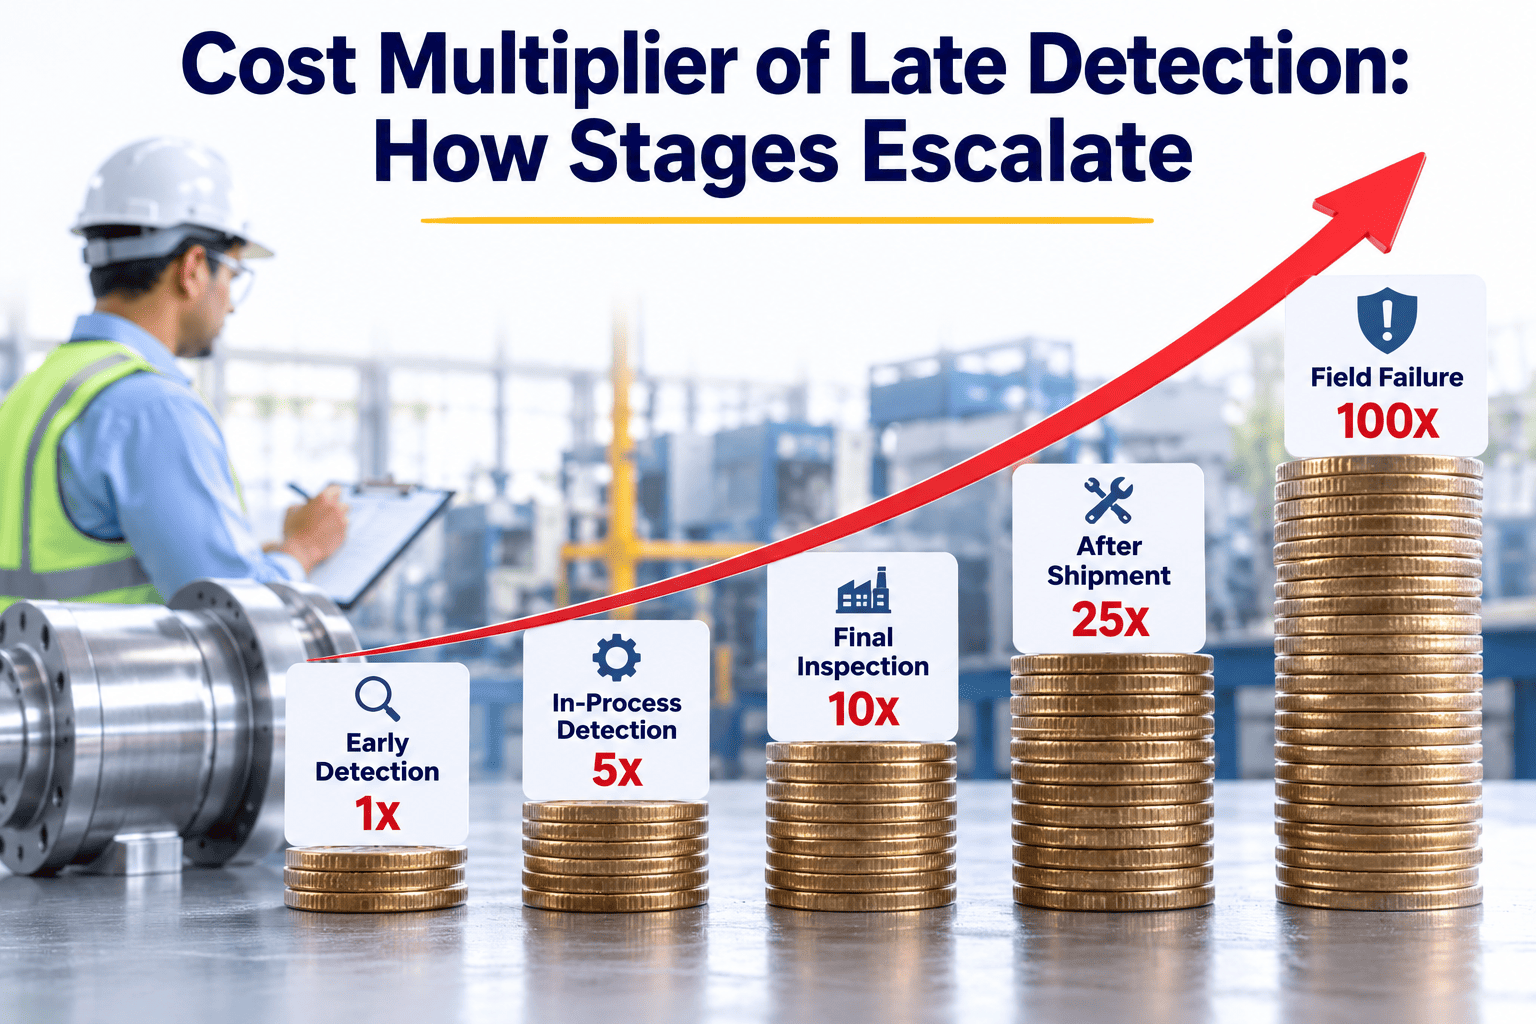
A broken filament caught at the spinning frame costs almost nothing to fix — a few metres of yarn, a moment of operator attention, and the line keeps running. The same underlying fault, left undetected until it shows up as a finished garment failing final inspection, can cost fifty times more once fibre, machine time, energy, labour, and dye have all been sunk into a product that is now unsellable. This is the cost multiplier of late detection, and it is the single most persuasive number in the case for earlier inspection — because it is not an abstract quality metric, it is a direct multiplier on your cost of goods that grows every stage a fault is allowed to travel undetected. Talk to iFactory about modelling this cost curve for your own production line.
The Cost Multiplier of Late Detection: How a Single Undetected Fault Gets More Expensive at Every Stage
A defect costs roughly 1x to fix at spinning, 5x at weaving, 20x at dyeing, and 50x or more once it reaches a finished garment. Understanding this curve changes how plants prioritise their quality investment.
Why the Curve Escalates
Every Stage Adds Cost That Cannot Be Recovered If the Batch Is Ultimately Rejected
The cost multiplier is not a marketing statistic — it reflects a straightforward accounting reality. Every processing stage a material passes through adds labour, energy, machine time, and often additional raw materials such as dye or finishing chemicals. If a fault originating early in the process is not caught until much later, all of that added value is at risk simultaneously, because the finished defect makes the entire cumulative investment worthless rather than just the cost of the original stage where the fault began. This dynamic is often underestimated by plant teams who track defect rates as a percentage without translating that percentage into a cost figure that accounts for which stage the defect was actually caught at — two plants with an identical defect rate can have dramatically different total quality cost depending purely on how early or late in the process their defects are typically discovered.
Spinning — Baseline Cost (1x)
A fault caught during spinning costs only the yarn produced up to that point, plus a brief line stop. No dye, no weaving labour, no finishing chemicals have been applied yet, so the loss is contained to the earliest and cheapest stage in the entire value chain.
Weaving — Compounding Cost (≈5x)
By the time fabric is being woven, yarn has already been produced, warped, and threaded through the loom. A fault caught here means the yarn cost, warping labour, and loom time invested are all at risk, not just the immediate fabric being woven when the fault appeared.
Dyeing — Significant Cost (≈20x)
Dyeing adds substantial chemical, water, energy, and processing time cost on top of everything already invested in spinning and weaving. A shade or penetration fault discovered after dyeing risks the entire lot's fibre, weaving, and dyeing cost simultaneously — and dye lots are notoriously difficult to correct after the fact.
Garment — Maximum Cost (≈50x+)
By the time a garment is cut, sewn, finished, and packed, every prior stage's cost is embedded in that single unit, plus cutting and sewing labour which is typically the most labour-intensive stage of all. A fault found here is the most expensive possible point of discovery, and the garment is often simply scrapped rather than reworked.
Turn This Curve Into a Business Case
iFactory Helps You Quantify Exactly What Late Detection Is Costing Your Plant
Most plants know late detection is expensive but have never quantified the multiplier specific to their own product mix, stage costs, and current defect rates. iFactory works with your team to build a stage-by-stage cost model using your actual production data, turning this general principle into a specific number that justifies earlier detection investment.
The Economics of Earlier Detection
What Moving Detection One Stage Earlier Is Actually Worth
The financial case for inline detection is strongest when framed not as "reducing defects" in the abstract, but as "moving the average detection point earlier in the process" — because every stage you move detection backward captures the full cost differential between where a fault is currently found and where it could have been found instead.
| Current Detection Stage | Target Detection Stage | Approximate Cost Avoided | Primary Lever |
|---|
| Garment (final inspection) | Dyeing | ~60% of unit cost | Inline colour and penetration sensors |
| Dyeing | Weaving | ~75% of unit cost | Camera-based loom monitoring |
| Weaving | Spinning | ~80% of unit cost | Online yarn quality sensors |
| Garment (final inspection) | Spinning | ~95%+ of unit cost | Full multi-stage inline coverage |
These figures are illustrative and should be validated against your own stage-level cost structure — actual avoided cost depends heavily on your specific fibre cost, dye chemical cost, and labour rate at each stage.
It is worth noting that these percentages compound across your total production volume rather than applying only to the units that currently carry a defect. If your plant processes a large volume monthly and even a modest percentage carries a fault that is currently caught late, shifting the average detection point earlier by even one stage can represent a substantial recurring monthly saving once multiplied across your actual production scale — which is precisely why building this model with your own volume and cost figures, rather than relying on generic industry percentages, produces a business case specific and credible enough for capital investment decisions.
Where to Invest First
Using the Cost Curve to Prioritise Detection Investment
01
Map Your Current Detection Points
Identify where in your process most defects are currently being caught today — many plants are surprised to find the majority are caught much later than they assumed, often at final inspection rather than in-process.
02
Calculate Your Stage-Specific Cost Additions
Work out the approximate cost added at each stage of your specific process — materials, labour, energy, and chemicals — so the generic cost curve becomes a number specific to your operation rather than an industry average.
03
Identify the Highest-Leverage Stage to Instrument
Combine your current defect volume with the cost curve to find which stage, if instrumented first, captures the largest avoided cost — this is rarely intuitive without doing the calculation explicitly.
04
Build the Business Case With Real Numbers
Present the investment decision as an avoided-cost calculation tied to your actual defect volume and stage costs, rather than a general quality improvement argument that is harder for finance stakeholders to evaluate.
One additional consideration worth building into the prioritisation exercise is the current variability of your defect rate at each stage — a stage with a high but stable defect rate may be a lower priority than a stage with a lower but highly variable rate, since variability is often a sign of an underlying process control issue that inline detection can help diagnose in addition to catching individual defective units. Plants that combine defect volume, stage cost, and variability into their prioritisation decision tend to identify a more accurate first investment target than those relying on defect volume alone.
Analyst Perspective
The mistake I see most often is plants treating every stage of the process as equally important for quality investment, when the cost multiplier curve makes clear that is not true — a rupee spent improving detection at spinning is worth meaningfully more than a rupee spent improving detection at garment inspection, because it prevents cost from accumulating in the first place rather than catching it after the fact. Once finance teams see the multiplier laid out stage by stage with their own numbers attached, the conversation shifts from "should we invest in quality technology" to "which stage should we instrument first" — and that is a much easier conversation to have.
Thaddeus Okonkwo-Reyes
Manufacturing Cost Analyst · 12 years in textile operations finance · Specialist in quality cost modelling and capital investment justification for process manufacturing
Cost Modelling Questions
Frequently Asked Questions
Are the 1x, 5x, 20x, 50x multipliers accurate for every textile plant, or do they vary significantly?
These figures are directional and widely observed across the industry, but the exact multiplier at each stage varies meaningfully depending on your specific product — a high-value dyed and finished fabric will show a steeper cost curve than a simpler grey fabric product, because more expensive processing steps are added at dyeing and finishing. The relative shape of the curve — cost escalating significantly at each subsequent stage — holds broadly true across textile manufacturing, but plants should calculate their own stage-specific costs rather than relying purely on industry averages when building an internal business case.
Book a session to build a cost model specific to your product mix.
How do we calculate our own stage-specific cost multiplier without a dedicated cost accounting team?
A reasonably accurate estimate can be built from information most plants already have available — approximate material cost per stage from your bill of materials or standard costing, average labour hours and rate per stage from production planning data, and energy or utility cost estimates per process step, which utilities or maintenance teams typically track at some level even without formal activity-based costing. This does not need to be a precise cost accounting exercise to be useful for prioritisation purposes; even directionally accurate estimates are usually sufficient to identify which stage represents the highest-leverage investment opportunity.
Contact our support team for a simple worksheet approach to building this estimate.
If earlier detection is so much cheaper, why do so many plants still rely primarily on final inspection?
Final inspection persists as the primary quality checkpoint in many plants largely for historical and organisational reasons rather than because it is the economically optimal approach — it requires a single centralised inspection team and process rather than distributed sensing and monitoring capability across every stage, and it has traditionally been the easier capability to build and staff. Inline detection at every stage requires more upfront technology investment and a more distributed operational model, which has historically been a higher barrier to entry even though the cost economics clearly favour earlier detection once the investment is made. As sensor and vision technology costs have declined, more plants are finding the economics now favour making that upfront investment.
Does this cost multiplier apply the same way to all defect types, or do some faults behave differently?
The general escalation principle applies broadly, but the magnitude varies by defect type and whether the fault is correctable in process versus only detectable after the fact. A shade variation caught mid-dye-cycle may sometimes be correctable through additional dye addition, limiting the loss even at a later stage, whereas a structural yarn defect discovered at garment stage is almost never correctable and results in near-total loss of accumulated value. Understanding which of your common defect types are correctable in process versus only detectable helps refine where earlier detection delivers the largest marginal benefit for your specific defect profile.
How should we present this cost curve to leadership to justify a detection technology investment?
The most persuasive framing ties the general cost multiplier principle directly to your plant's actual current defect volume and detection stage — for example, calculating that a specific number of units per month are currently being caught at garment stage rather than spinning stage, and multiplying that volume by your calculated cost differential per unit to produce a concrete monthly avoided-cost figure if detection moved earlier. This transforms an abstract industry principle into a specific number relevant to your operation, which is generally far more persuasive to finance and operations leadership than the general multiplier concept alone.
Book a session to build this specific business case with our team.
Every Stage a Defect Travels Undetected Adds to Its Cost
Build a Cost Model Specific to Your Plant and Prioritise the Right Investment
iFactory helps textile manufacturers quantify the real cost multiplier across their own production stages and identify exactly where earlier detection delivers the largest avoided cost — turning a general principle into a specific, fundable business case.