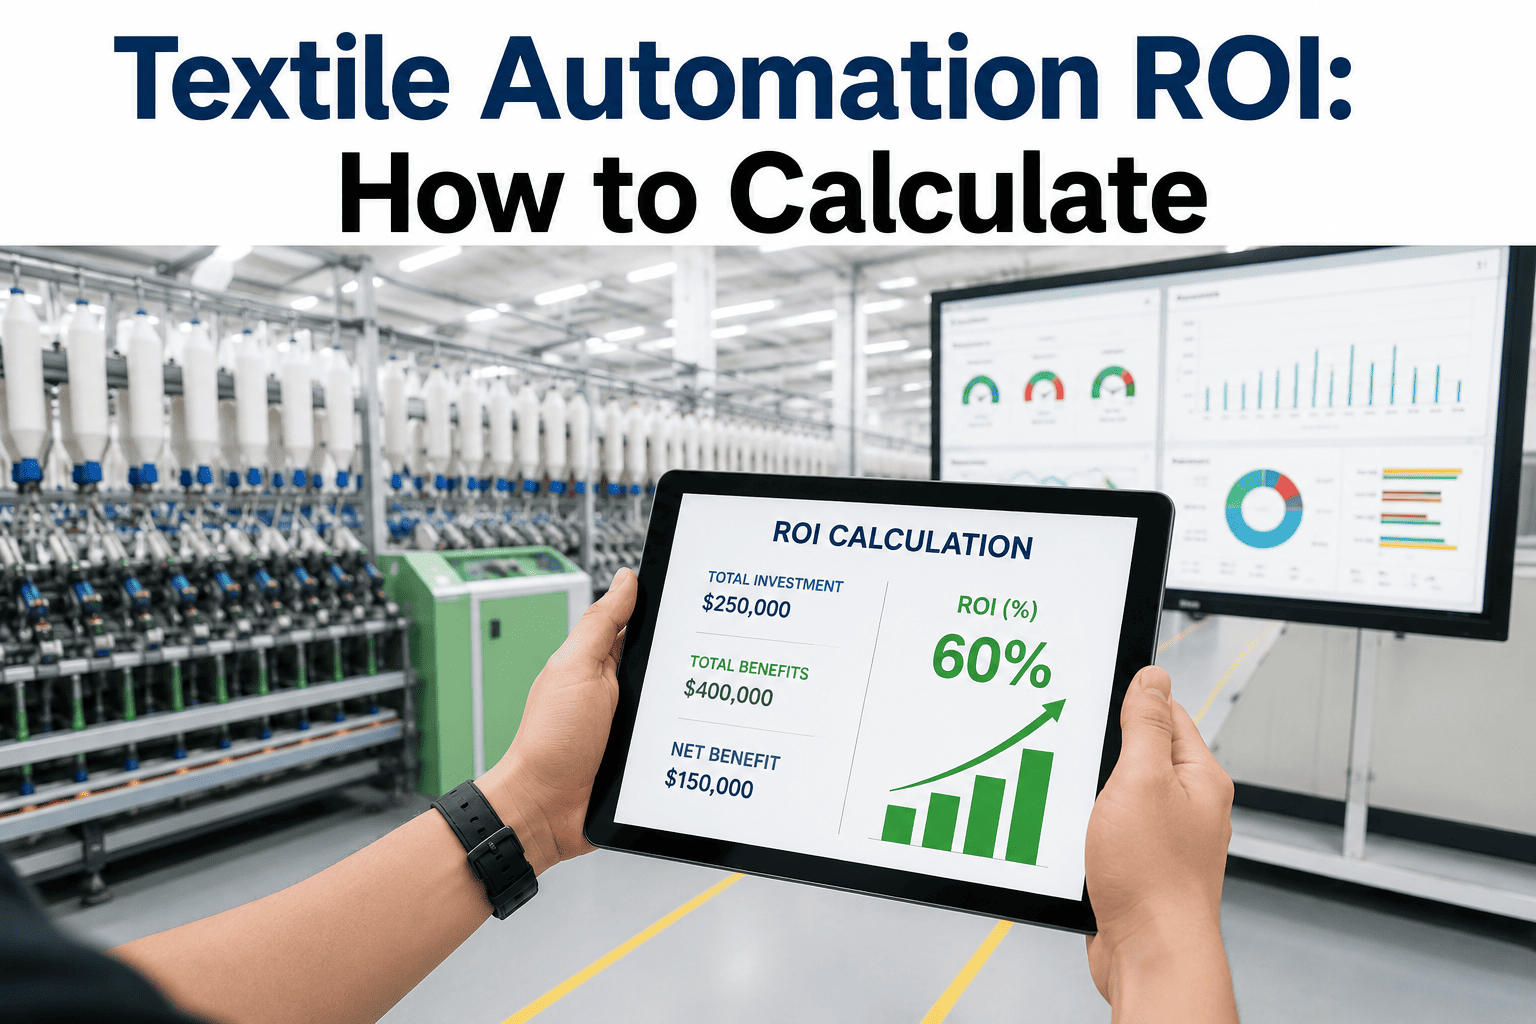
A plant manager in Coimbatore once told us his automation proposal got rejected three times before anyone realized the finance team and the production team were calculating ROI on completely different assumptions. Production counted machine-hour savings. Finance wanted cash-flow timing. Nobody had built a single framework both sides could sign off on, so the project sat in limbo for eleven months while competitors modernized their spinning lines. This happens constantly in textile manufacturing, where automation decisions touch capital budgeting, shift labor, quality yield, and energy cost all at once — and where a shaky ROI model kills good proposals just as often as a good one saves bad ones. Getting this calculation right the first time is what separates mills that modernize on schedule from mills stuck relitigating the same spreadsheet every quarter, and it's exactly the kind of decision support iFactory's manufacturing intelligence platform is built to feed with real production data.
Textile Automation Finance
The ROI Framework Textile Mills Actually Need
Payback period, NPV, and IRR modeling built specifically for spinning automation, weaving monitoring, dyeing control, and finishing line upgrades — not a generic manufacturing template that ignores how textile capital cycles actually work.
18-30month typical payback
3 modelspayback, NPV, IRR
5 costcategories tracked
Why Textile ROI Calculations Break Down So Often
Most textile automation proposals fail not because the technology doesn't work, but because the financial case was assembled from incomplete or mismatched data. Production teams tend to overweight visible savings like reduced headcount on a shift, while underweighting harder-to-quantify gains like reduced fabric defects, faster changeover, or lower energy draw per kilogram produced. Finance teams, meanwhile, apply generic corporate hurdle rates that don't reflect how textile capital actually depreciates or how quickly a spinning or weaving asset becomes obsolete against newer competitor lines.
The fix isn't a more complicated spreadsheet — it's a shared framework that both sides trust because it's built from the same underlying production and cost data, refreshed continuously rather than estimated once at proposal time.
01
Capital Outlay
Equipment purchase, installation, integration with existing MES or ERP systems, and commissioning labor — the number every proposal gets right because it's contractual.
02
Labor Reallocation
Not headcount elimination in most mills, but reallocation of operators from repetitive monitoring tasks to higher-value quality and maintenance roles, changing the labor line differently than a straight cut.
03
Yield and Defect Reduction
Automated tension control, break detection, and dye-batch consistency reduce second-quality output — often the single largest line item in a well-built ROI model and the most commonly underestimated.
04
Energy and Utility Load
Automated finishing and dyeing lines typically reduce steam and water consumption per unit of output through tighter process control, a savings category most manual proposals never model.
05
Downtime Avoidance
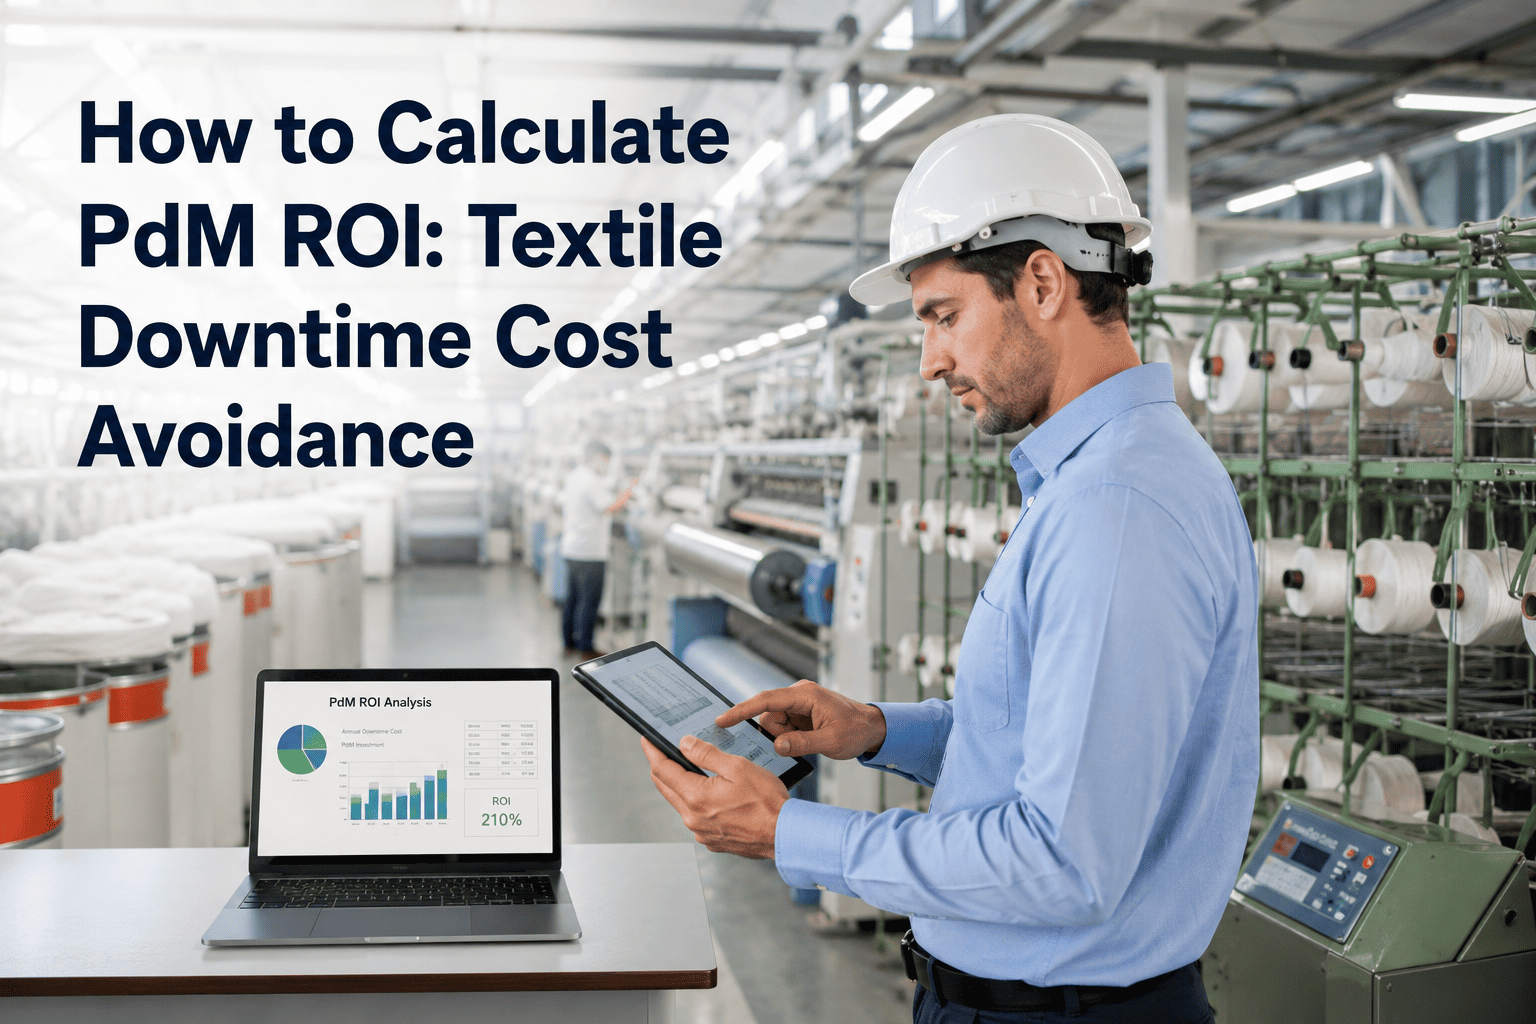
Predictive maintenance data attached to automation investments reduces unplanned stoppages, and the avoided cost of downtime is calculable against your historical stoppage log rather than estimated from industry averages.
Three Financial Models, Three Different Questions
Payback period, NPV, and IRR aren't interchangeable — each answers a different question a stakeholder is actually asking, and a strong proposal presents all three rather than picking whichever number looks best.
Payback Period
"When do we get our money back?"
The simplest and most requested figure on the plant floor. Divide total capital outlay by annual net savings across labor, yield, energy, and downtime categories. Most textile automation investments in spinning and weaving land between 18 and 30 months, while dyeing and finishing control systems often pay back faster due to chemical and water savings.
Net Present Value (NPV)
"Is this worth more than doing nothing with the capital?"
NPV discounts future cash flows back to today's value using your mill's cost of capital, then subtracts the initial investment. A positive NPV means the automation investment creates value beyond simply banking the capital or paying down debt — this is the number that typically satisfies a finance committee.
Internal Rate of Return (IRR)
"How does this compare to our other capital projects?"
IRR expresses the investment's return as a percentage, letting you rank an automation proposal against competing capital projects — a new loom line versus a warehouse expansion versus an ETP upgrade — on a single comparable scale.
A Worked Example: Weaving Monitoring Automation
Consider a mid-size mill running 120 looms across two shifts, evaluating an automated weaving monitoring system that detects warp breaks, tracks efficiency per loom, and flags quality deviations in real time. The table below shows how the five cost categories translate into an actual annual savings estimate for this specific investment class.
| Cost Category | Annual Impact | Basis for Estimate |
|---|
| Yield improvement | 2.5-4% fewer defects | Reduced warp-break related second quality |
| Labor reallocation | 1 operator per shift freed | Automated break detection replaces manual walk-checks |
| Downtime avoidance | 8-12% fewer stoppage-hours | Faster break detection and alert routing |
| Energy impact | Marginal, loom-dependent | Minor efficiency gain from reduced idle running |
| Typical payback | 14-22 months | Combined savings against capital and integration cost |
Want this framework run against your actual loom count, shift structure, and historical defect rate? Book a walkthrough and we'll build the model live with your numbers.
The Data Problem Behind Every Weak ROI Model
The biggest reason textile ROI models get challenged in review isn't the math — it's the source data. When defect rates, downtime hours, and energy consumption are pulled from manual logs or estimated from memory, finance teams rightly push back. A model built on continuously captured production data, sourced directly from the floor rather than reconstructed at proposal time, survives scrutiny because every number traces back to an auditable record rather than an assumption.
This is where connecting automation proposals to a live manufacturing intelligence layer changes the outcome. Instead of building a one-time estimate, the mill maintains a running model that updates as production data accumulates, so a proposal that was marginal at 18 months payback six months ago might now show 14 months once actual yield data replaces the original estimate.
Live Data, Not Estimates
Build Your ROI Model on Real Production Data
Connect defect rates, downtime logs, and energy consumption directly to your automation business case instead of reconstructing numbers from memory at proposal time.
Sensitivity Analysis: Where Proposals Actually Get Rejected
Even a well-built ROI model can get rejected if it can't survive a sensitivity check, and finance committees know exactly which assumptions to stress-test first. Running your own sensitivity pass before the proposal goes to review is the single most effective way to avoid a rejection that sends the project back for another quarter of revision.
Utilization Rate
Model the payback at 75%, 85%, and 95% machine utilization — most rejected proposals assumed utilization that the plant has never actually sustained.
Raw Material Price Swings
Yield-based savings shrink or grow with fiber and dye cost, so show the payback range across recent 12-month price bands rather than a single snapshot price.
Labor Cost Trajectory
If labor reallocation savings assume today's wage rates, show how the payback shifts against expected annual wage inflation over the model's time horizon.
Integration Delay Risk
Add a delay scenario where commissioning takes 60-90 days longer than planned — reviewers trust models that already account for the most common execution risk.
Frequently Asked Questions
What discount rate should we use for textile automation NPV calculations?
Most mills use their weighted average cost of capital, typically somewhere between 10% and 15% depending on debt structure and regional lending rates, though some mills apply a slightly higher rate to automation specifically to account for technology obsolescence risk. The right rate depends on your capital structure and how conservatively your finance committee wants to treat newer technology categories.
Talk to our team if you want help benchmarking your rate against comparable mill investments.
How do we account for savings that are hard to quantify, like improved quality consistency?
Quality consistency shows up financially through reduced second-quality output, fewer customer returns, and in export-facing mills, fewer compliance rejections at inspection — all of which are quantifiable if you have historical defect and return data to draw from. The mistake most proposals make is treating quality as a qualitative bullet point rather than tracing it through to an actual cost line, which is exactly the kind of gap a continuous data layer closes.
Book a walkthrough to see how this maps against your own quality records.
Should spinning, weaving, and dyeing automation be evaluated with the same ROI framework?
The three-model structure of payback, NPV, and IRR applies consistently across all three process areas, but the underlying cost categories shift in weight — dyeing and finishing automation tends to lean heavily on water and chemical savings, while spinning and weaving automation leans more on yield and labor reallocation. Building a single flexible framework that lets you weight these categories differently per process area is more useful than three separate templates.
Reach out to our team for guidance on weighting for your specific process mix.
How often should the ROI model be revisited after the investment is approved?
A quarterly revisit against actual realized savings is standard practice, and it serves two purposes: it validates the original model's assumptions against real outcomes, and it builds an evidence base that makes the next automation proposal easier to approve because it's backed by a track record rather than a fresh estimate. Mills that skip this step tend to relitigate the same assumption debates on every new proposal instead of building institutional trust in the framework.
Book a walkthrough to see how ongoing tracking works in practice.
What's a realistic payback range across different textile automation categories?
Spinning automation investments typically show payback in the 20-30 month range given higher capital intensity, weaving monitoring systems commonly land between 14 and 22 months, and dyeing or finishing control automation frequently pays back fastest, often in the 12-18 month range, due to direct chemical and water savings. These are general bands, and your actual figure depends heavily on current defect rates, utility costs, and shift structure.
Talk to our team to get a range scoped to your specific process line.
Ready to Build the Business Case?
Turn Your Production Data Into a Defensible ROI Model
Share your current defect rates, downtime logs, and utility costs, and we'll help you build a payback, NPV, and IRR model that survives finance committee review on the first pass.