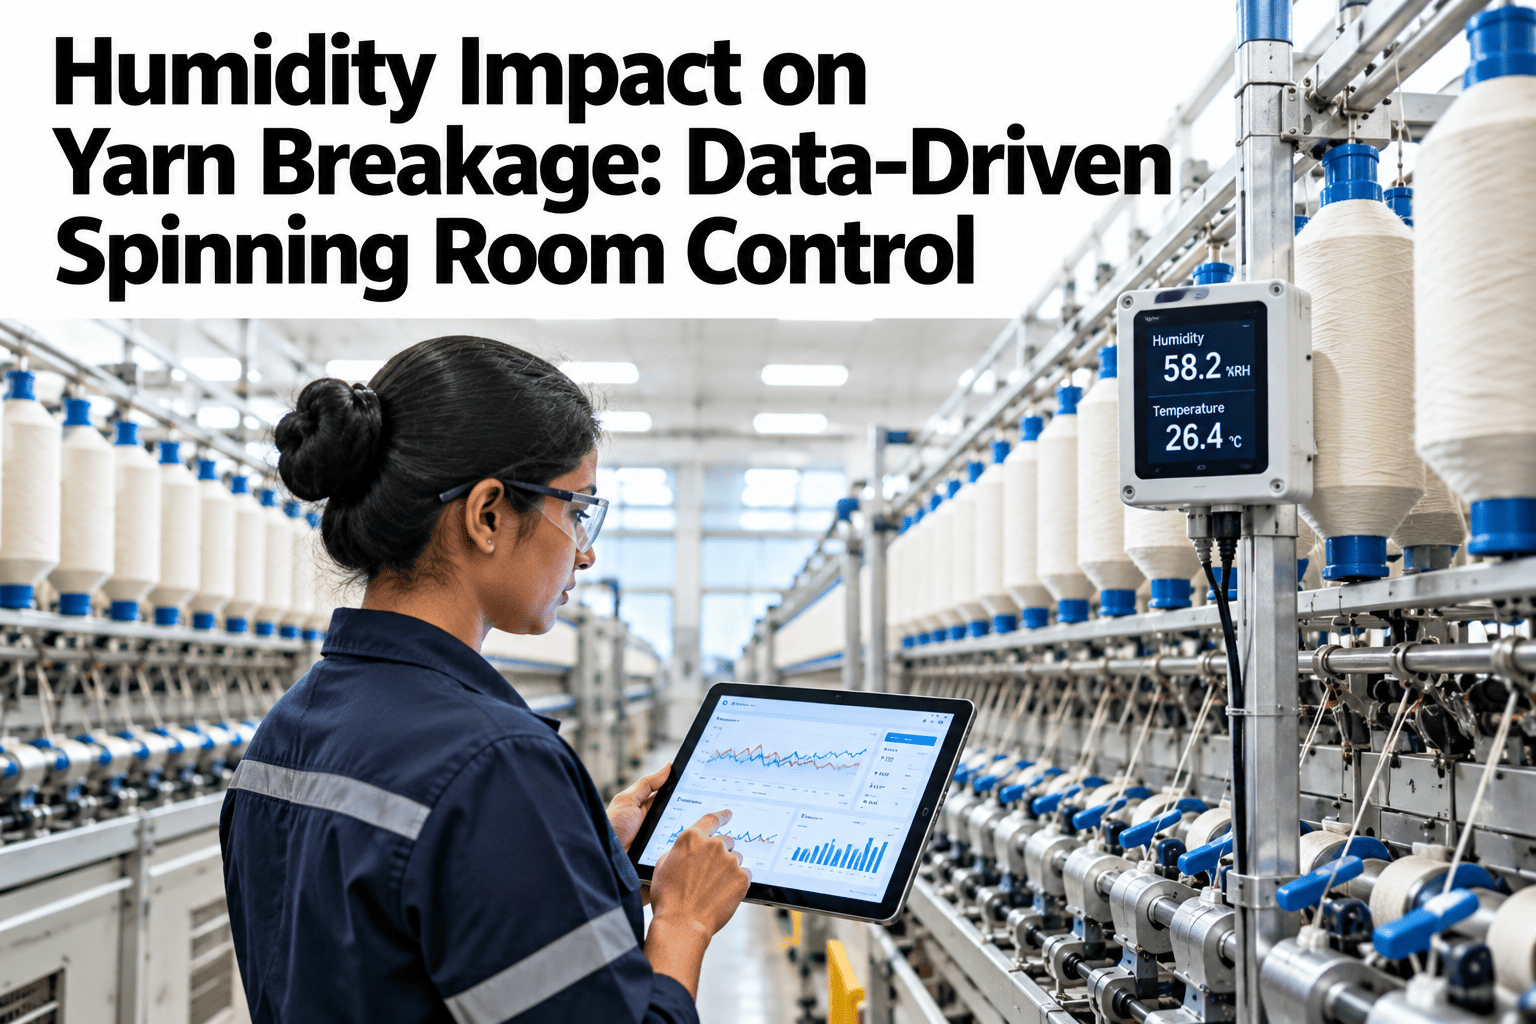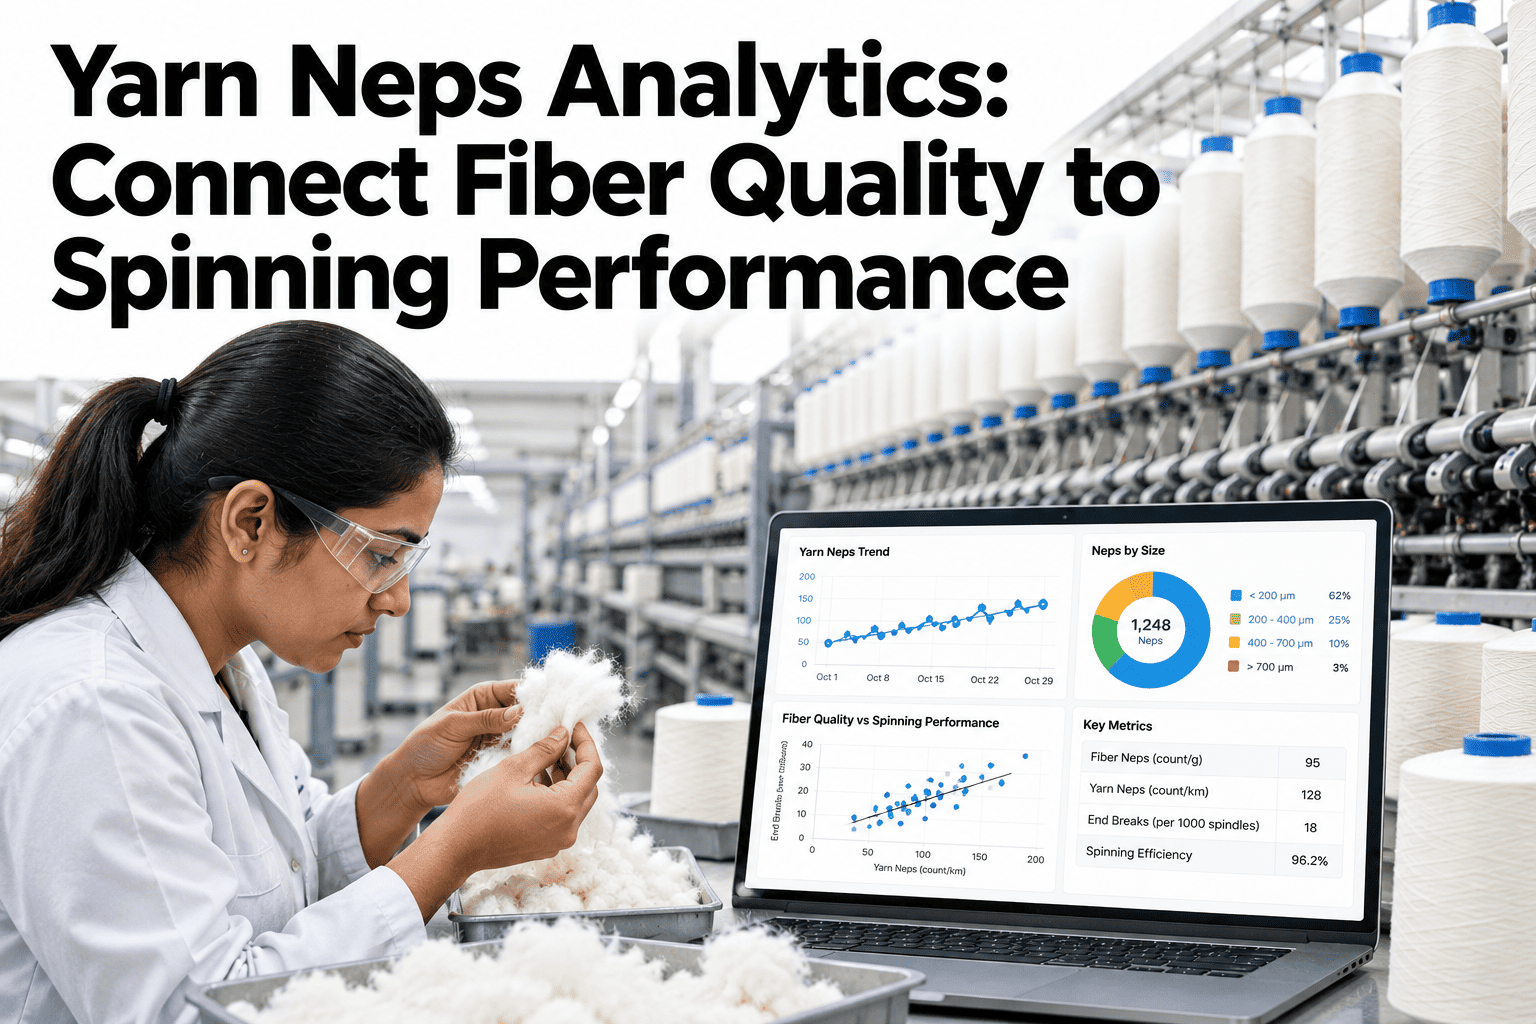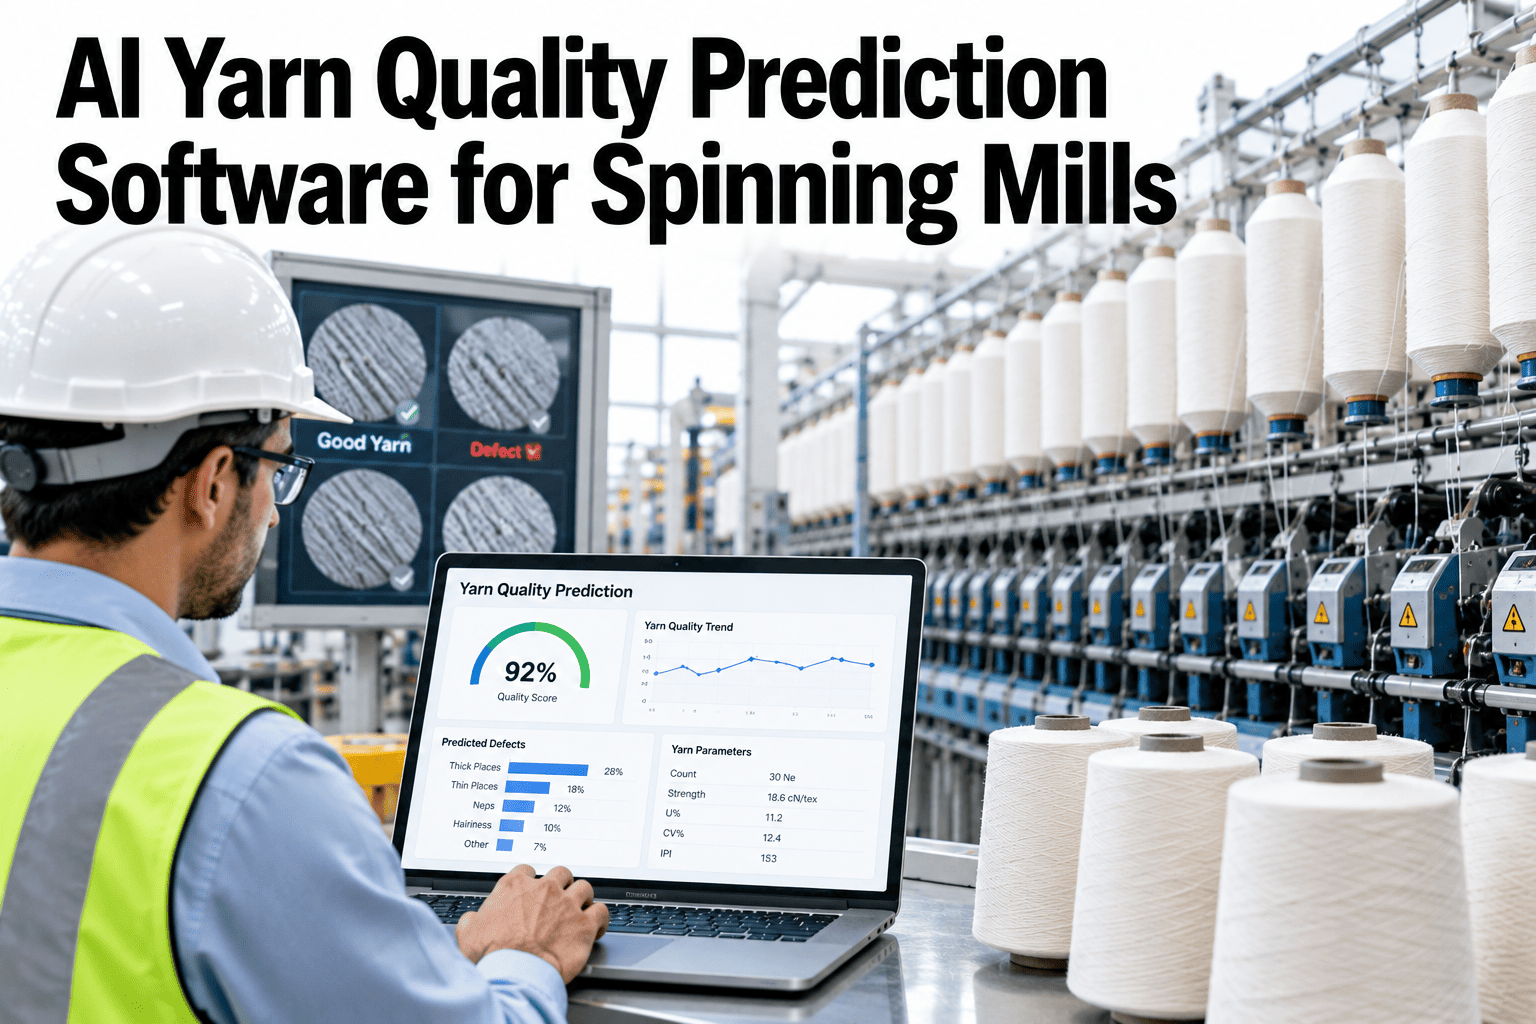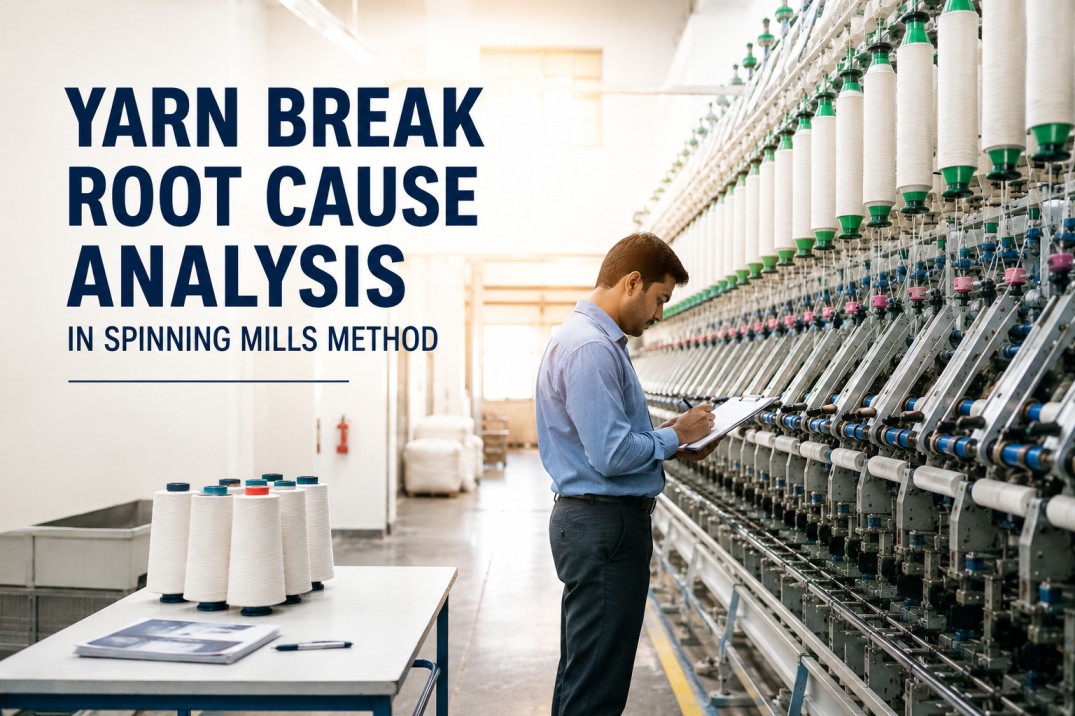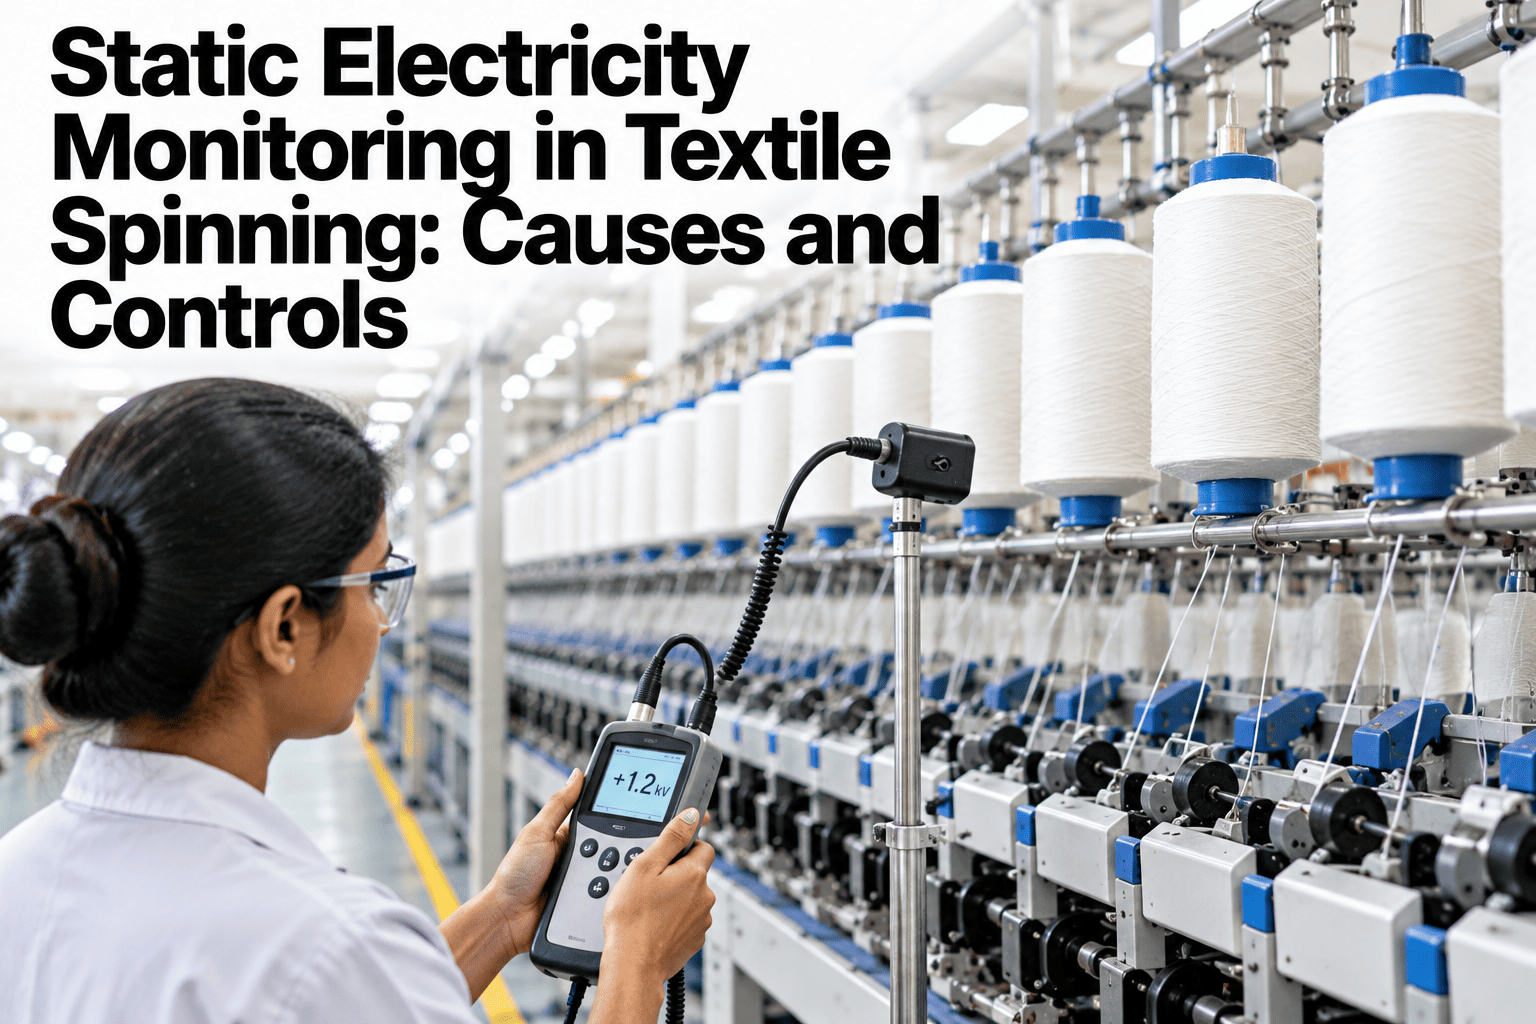
Static builds silently. There is no gauge on a ring frame that reads out electrostatic charge the way a thermometer reads temperature, so most mills only notice static once it is already causing fiber to cling, fly to scatter unevenly, or yarn to behave unpredictably at the winder. Humidity is the lever that controls most of it, which means the environmental data a mill already collects can double as an early warning system for static risk, if the two are connected properly. This guide covers how that connection is built. Mills ready to see their own static risk tracked can book a demo with the iFactory AI team.
Static Electricity Monitoring in Textile Spinning: Causes and Controls
Track environmental conditions associated with static electricity and connect them with yarn breaks, fiber behavior and machine performance.
Above 58% RH
50 to 58% RH
Below 50% RH
Why Static Is Tracked Indirectly
Direct electrostatic measurement equipment is specialised and rarely deployed across an entire spinning floor, so most mills rely on the conditions known to drive static instead of measuring the charge itself.
Humidity, temperature and fiber type together explain most of the variation in static behavior, which makes environmental monitoring a practical proxy for a hard-to-measure problem.
What Drives Static Risk
A handful of factors interact to determine how much static a given condition is likely to generate.
| Factor | Effect on Static Risk | Typical Monitoring Signal |
|---|---|---|
| Relative humidity | Lower humidity sharply raises static risk | Zone humidity sensors |
| Temperature | Interacts with humidity to set effective moisture content | Zone temperature sensors |
| Fiber type and finish | Synthetic blends typically carry higher static tendency | Production schedule data |
| Air movement | Can concentrate or disperse static-prone fiber fly | HVAC airflow settings |
Connecting Environment to Outcome
The monitoring approach follows a short sequence that turns environmental readings into a usable risk signal.
Turn an Invisible Risk Into a Visible Signal
Book a 30-minute walkthrough and see static risk zones built from your own humidity and temperature data.
A Sample Risk Period, Illustrative
The figures below are invented to show the shape of a risk period, not to benchmark your mill.
Common Static Monitoring Mistakes
The same gaps repeat across mills building their first static risk view.
Controls Beyond Humidity Alone
Humidity is the primary lever, but a few complementary controls help where humidity alone cannot fully resolve a static issue.
Anti-static finishes, grounding on metal components, and ionising equipment near high-risk zones are common additions once the humidity data confirms where the risk actually concentrates.
Frequently Asked Questions
Can static actually be measured directly instead of inferred?
Yes, dedicated electrostatic field meters exist, but they are typically used for spot checks rather than continuous zone-wide monitoring, which is why environmental proxies remain the practical choice for ongoing tracking. Book a demo to discuss direct measurement options.
Does fiber blend really change the risk threshold that much?
Yes, synthetic fibers and blends generally carry higher static tendency than natural fibers at the same humidity level, so a threshold set for cotton may be too lenient for a polyester blend.
How quickly can a humidity correction reduce static-related issues?
Once a zone's humidity returns to its target band, static-related effects typically subside within the same shift, making humidity one of the faster levers available compared to equipment changes.
Does this connect to our existing environmental sensors?
In most cases, yes. iFactory AI reads from existing humidity and temperature sensors and builds the risk scoring on top. Ask support which sensor systems connect.
See Static Risk Before It Shows Up in Yarn
iFactory AI connects humidity and temperature data to static risk and real machine performance. Book a walkthrough built around your mill.