A dye lot fails shade approval, the batch gets traced back to a chemical supplier, and the quality manager pulls up a spreadsheet last updated two months ago to decide whether this is a pattern or a one-off. That spreadsheet cannot answer the question, because nobody had time to log every incoming rejection, every delayed delivery, and every claim against every yarn, dye and chemical vendor across a full quarter. Supplier quality analytics fixes this by scoring every vendor automatically from the data your mill already generates: incoming inspection results, lot performance on the floor, claims, delivery timing and downstream production impact. See what your own supplier data looks like once it is actually scored by booking a supplier analytics walkthrough with iFactory.
Know Which Suppliers Are Actually Costing You Money
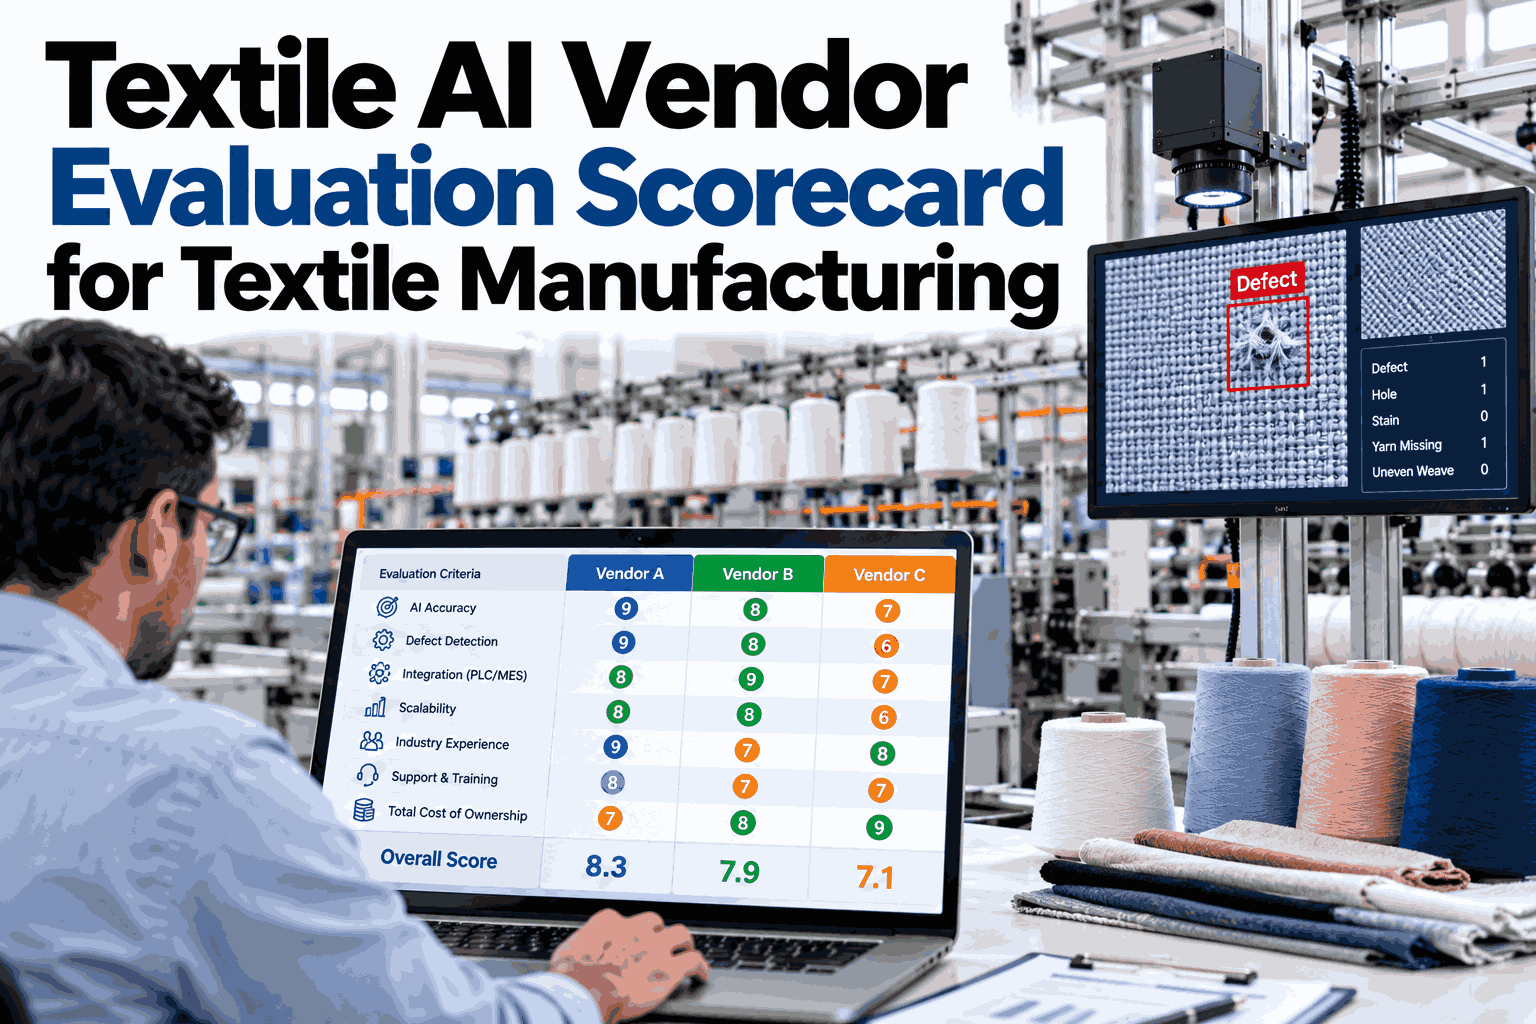
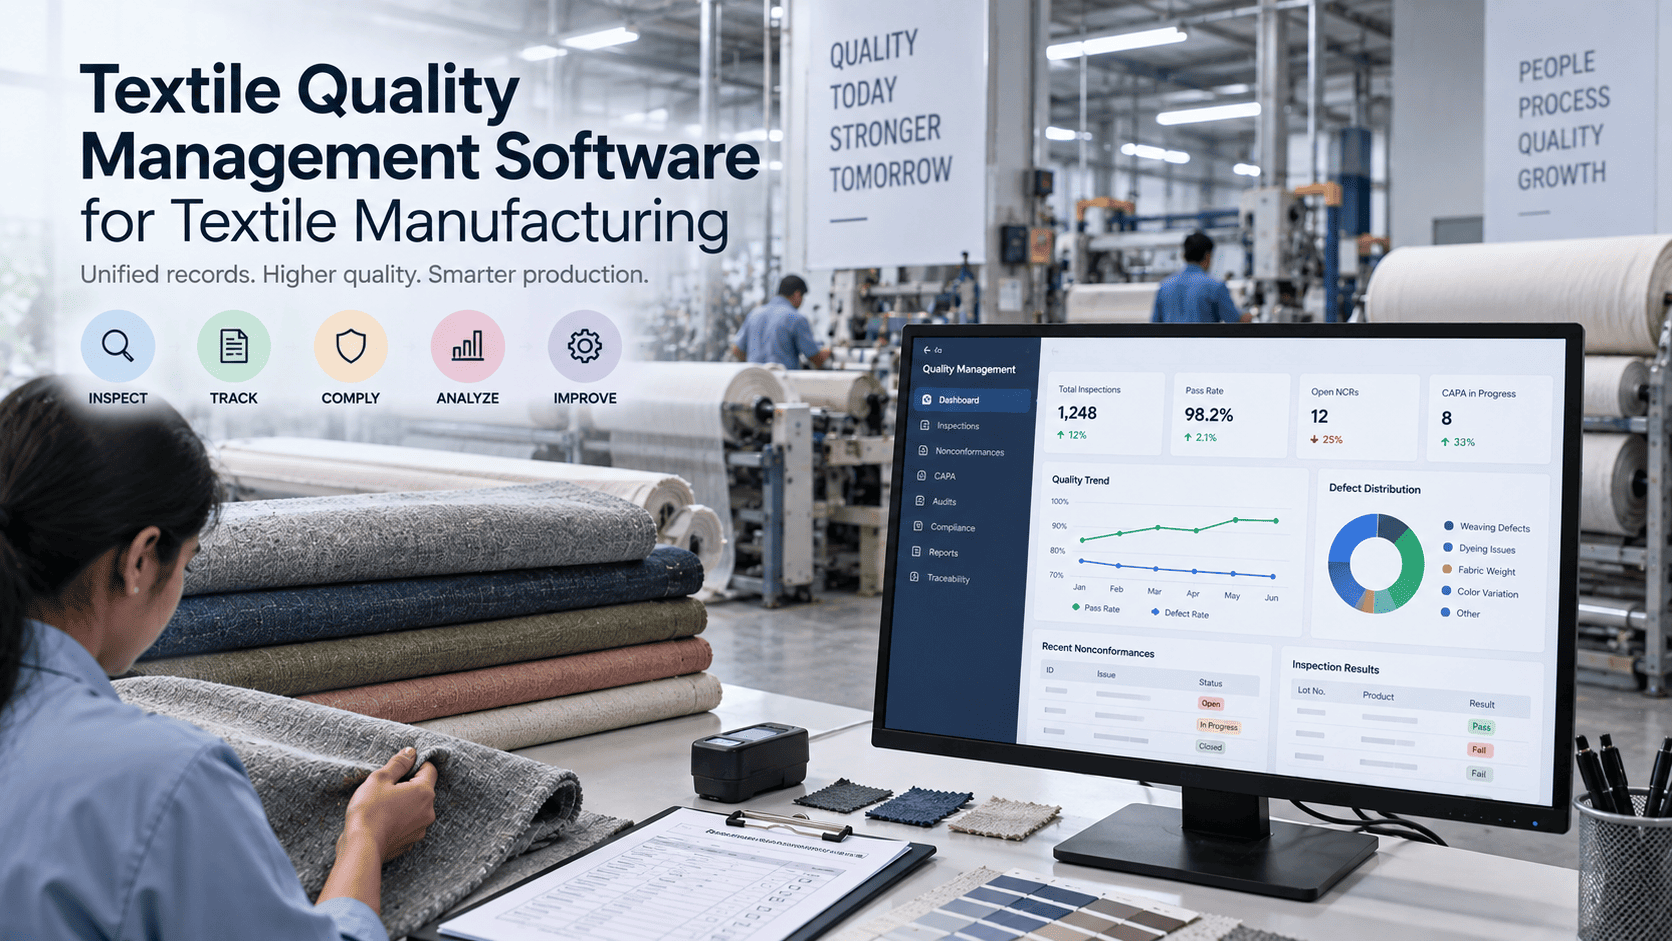
iFactory turns incoming inspection, lot performance and claims data into a live supplier scorecard for every yarn, dye and chemical vendor, so sourcing decisions are based on production impact, not gut feel.
Why Supplier Quality Data Stays Buried
The information needed to score a supplier fairly is scattered across incoming inspection logs, production quality holds, customer claims tied back to a specific dye lot, and delivery records in the ERP. Nobody sits down to join all four unless a problem has already escalated, which means most sourcing decisions are made on relationship and price, not on measured quality impact.
Incoming inspection results sit in a QC log that never connects to what happened on the production floor with that specific lot.
A dye or chemical batch that causes downstream rework is rarely traced back to the supplier lot that caused it.
Delivery delays get noted informally but never rolled into a supplier's overall reliability picture.
Sourcing renewal decisions happen annually, based on memory of recent issues rather than a full quarter of measured data.
See Your Vendors Scored on Real Production Data
Bring your incoming inspection logs or claims history to the call and iFactory will show you what a live scorecard looks like against your actual supplier base.
What Goes Into a Supplier's Score
The score is not a single number pulled from one data source. It is a weighted combination of five measurable factors that together explain whether a supplier is actually a quality risk or just an easy target for blame.
Incoming Quality
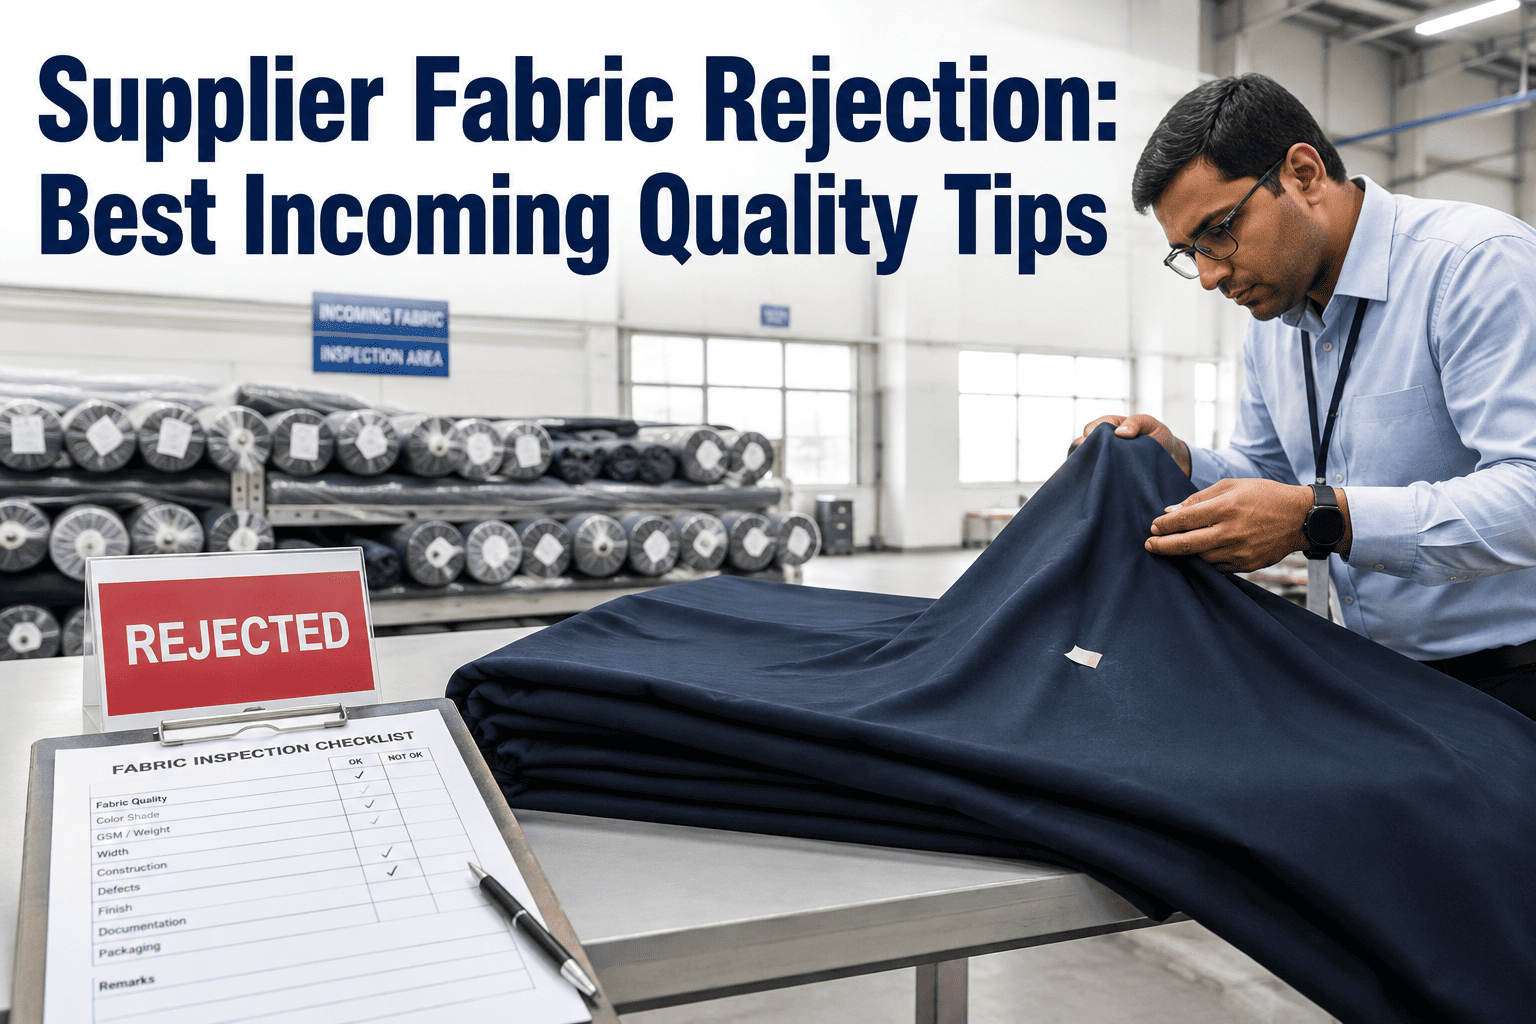
Rejection rate and defect severity at incoming inspection, weighted by lot volume received.
Production Impact
Downstream rework, holds and scrap traced specifically to that supplier's lots once in production.
Claims History
Frequency and severity of customer claims traceable back to a specific supplier lot or chemical batch.
Delivery Reliability
On-time delivery rate and lead-time variance against the purchase order schedule.
Test Result Trend
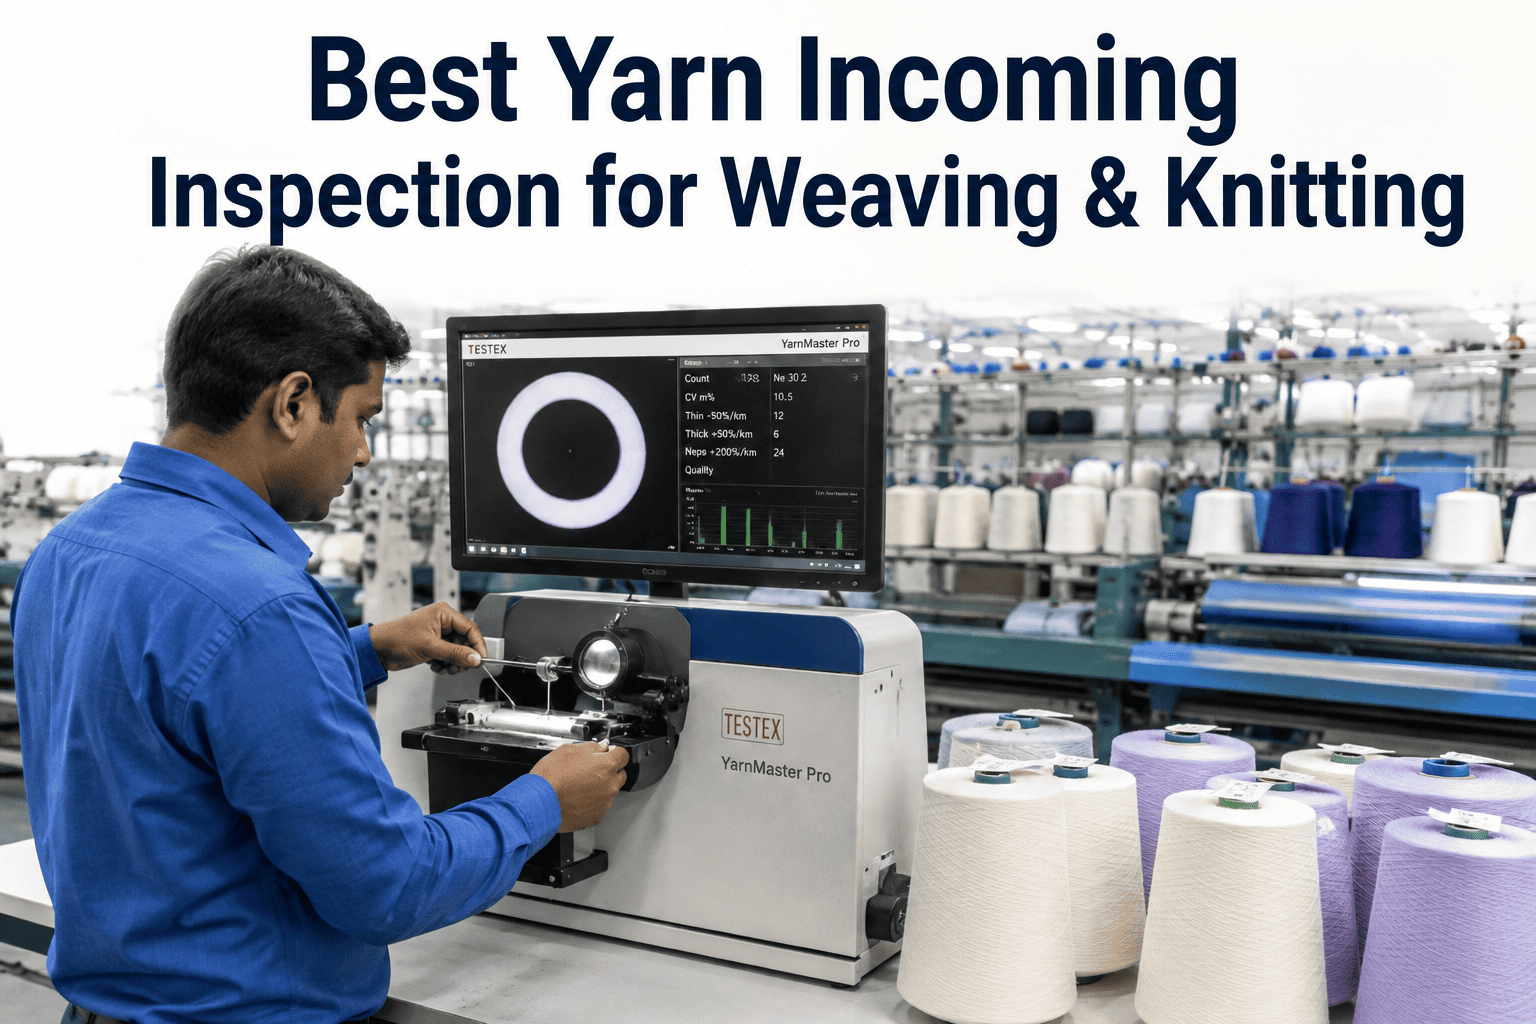
Lab test results over time, tracking whether a supplier's quality is stable, improving or drifting.
Spreadsheet Tracking vs Automated Scoring
| Factor | Manual Spreadsheet | iFactory Supplier Analytics |
|---|---|---|
| Data sources joined | Usually one, rarely all four | Inspection, production, claims, delivery combined |
| Update frequency | Quarterly or after an incident | Continuous, as new data arrives |
| Lot-level traceability | Rarely traced to source lot | Every score traces to specific lots |
| Sourcing decision basis | Recent memory, relationship | Measured trend across full history |
What Mills See After Scoring Goes Live
reduction in incoming material rejections after supplier scorecards drive sourcing decisions
faster identification of which supplier lot caused a downstream production quality issue
of active suppliers scored continuously instead of only the ones involved in a recent complaint
Frequently Asked Questions
Where does the data for supplier scoring actually come from?
The platform pulls from your existing incoming inspection records, production quality holds, customer claim logs and ERP delivery data through standard integrations. It does not require your team to manually enter new information, it connects to systems that already capture this data and joins it in a way that was previously too time-consuming to do by hand. This is why the scoring can update continuously instead of only at quarterly review time.
Can we adjust how much weight is given to incoming quality versus delivery reliability?
Yes. The five scoring factors are configurable to your priorities, so a mill that cares more about on-time delivery for a just-in-time production schedule can weight that higher, while a mill focused on shade consistency for a premium customer base can weight incoming quality and claims history more heavily. This is set during onboarding and can be adjusted as your sourcing priorities change over time.
Does this replace our existing supplier relationship or procurement process?
No. It gives your procurement and quality teams better data to use within the process you already run, including annual reviews, chargeback discussions and sourcing renewal decisions. The scorecard is designed to support the conversation with a supplier, not replace the relationship management that a good procurement team already does. Many mills use it specifically to make chargeback and claim discussions more objective and less contentious.
How far back does the scoring go when we first set it up?
Onboarding typically includes a historical data load covering the past twelve to twenty-four months, depending on how much clean data exists in your systems, so the first scorecard is not starting from zero. From that point forward, scoring updates continuously as new inspection, production and claims data comes in. Talk to a specialist about what historical data your systems can provide.
How long does it take to get supplier scorecards live for our full vendor base?
Most mills see initial scorecards within four to six weeks of kickoff, covering the integration work needed to connect inspection, production and ERP data sources. Full vendor base coverage typically follows within another few weeks as data quality checks are completed across all suppliers. Book a scoping call to get a timeline specific to your systems.
Stop Guessing Which Supplier Is the Real Problem
Supplier quality decisions made on memory and relationship cost mills real money every time a bad lot slips through because the pattern was never actually measured. Automated scoring turns scattered inspection, production and claims data into a scorecard that tells you, objectively, which yarn, dye and chemical suppliers are worth keeping and which ones are quietly driving your rework and claims cost. Talk to iFactory about what your own supplier base looks like once the data is actually joined.