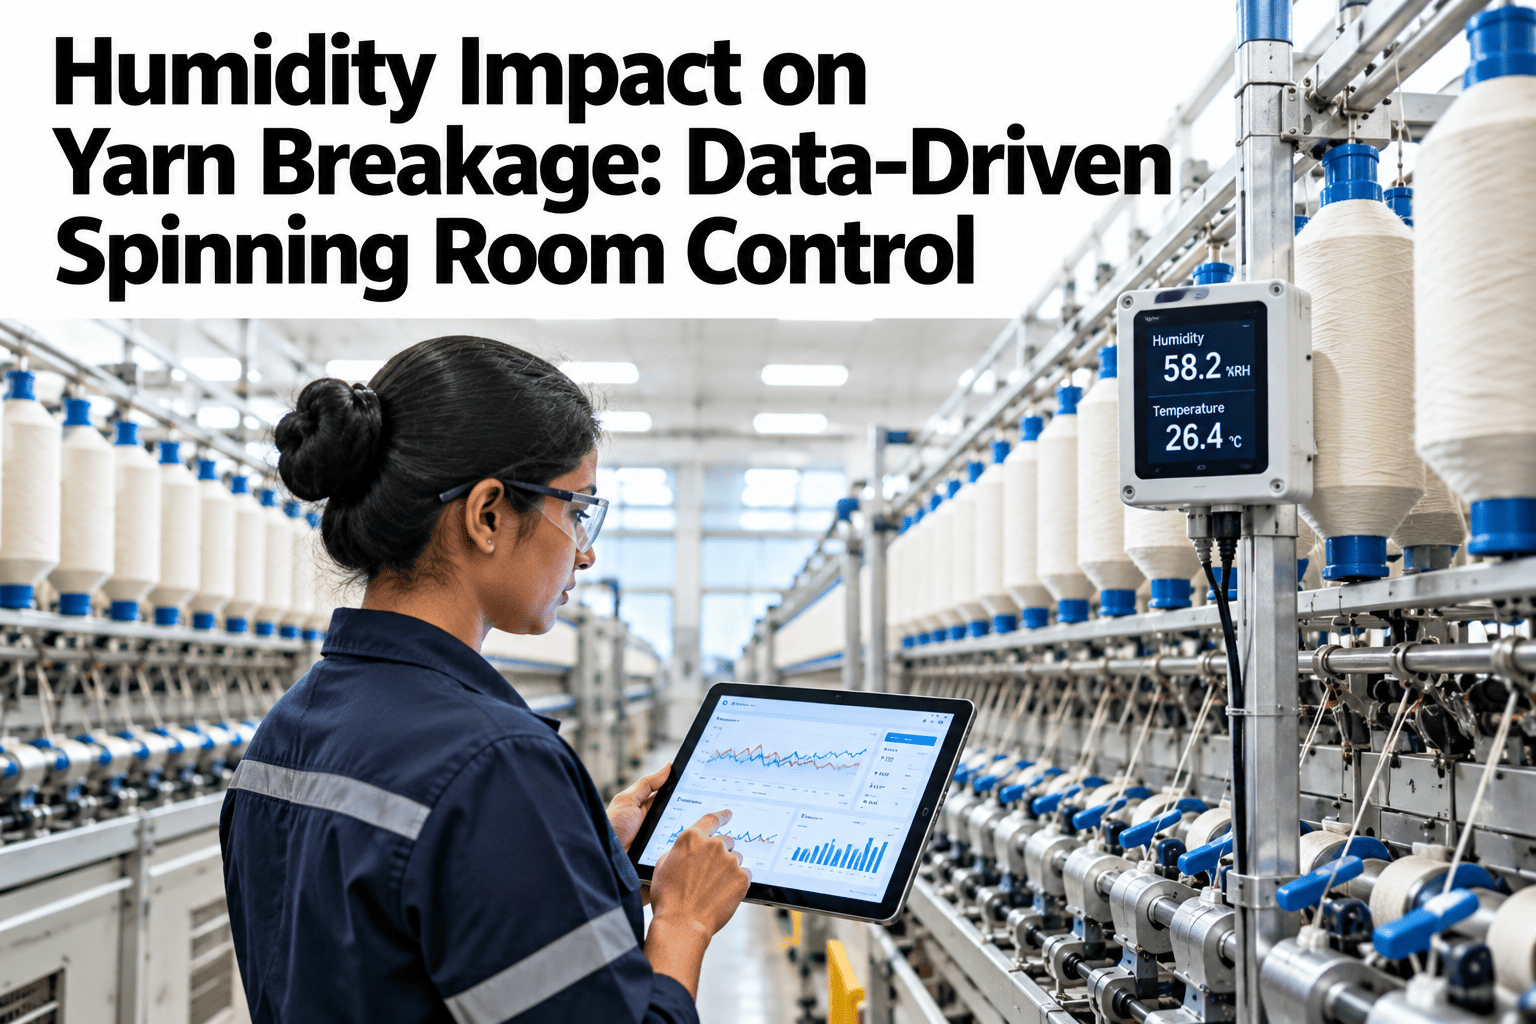
Every spinner knows humidity and end breaks are connected, but knowing it in general and proving it for a specific shift, frame or zone are very different things. Without the data lined up side by side, the link stays a hunch repeated in the tea room rather than a number that justifies a climate system upgrade. This guide covers how to analyse humidity levels against yarn breaks, machine performance and shift patterns, so the environmental conditions behind spinning instability become visible instead of assumed. Mills ready to see their own breaks and humidity data lined up can book a demo with the iFactory AI team.
Humidity Impact on Yarn Breakage: Data-Driven Spinning Room Control
Analyze humidity levels against yarn breaks, machine performance and shifts to find the conditions linked to instability and quality losses.
From Hunch to Evidence
A supervisor who says breaks go up when it gets dry is usually right, but without the two data sets lined up on the same timeline, that observation cannot support a capital decision.
Lining up end-break counts against humidity readings for the same frame and the same hour turns the hunch into a chart anyone can read.
What Gets Compared
The analysis lines up three data sets on the same timeline, so a pattern across all three becomes visible rather than argued about.
| Data Set | Typical Source | Resolution |
|---|---|---|
| End breaks | Frame stop records or break counters | Per frame, per hour |
| Humidity and temperature | Zone sensors | Per zone, continuous |
| Shift and product | Production schedule | Per shift, per count being spun |
Reading the Pattern
Once the data is aligned, a few consistent patterns tend to show up across most mills, though the specific thresholds vary by count and fiber.
Prove the Link Between Humidity and Breaks
Book a 30-minute walkthrough and see your own end-break and humidity data lined up on one timeline.
A Sample Correlation, Illustrative
The figures below are invented to show the shape of the analysis, not to benchmark your mill.
Common Analysis Mistakes
The same mistakes show up across mills attempting this analysis for the first time.
Turning the Finding Into a Control Change
A proven correlation only pays off once it changes how the climate system is actually run.
Once a threshold is established, HVAC setpoints can be tightened specifically around the shifts or zones where breaks are most sensitive, rather than running a conservative setting across the whole mill around the clock.
Frequently Asked Questions
How much historical data is needed to find a reliable threshold?
A few weeks of aligned data usually reveals a clear pattern, though a full seasonal cycle gives a more complete picture since outdoor humidity shifts significantly across the year. Book a demo to see what your existing data already shows.
Does the threshold stay the same across all counts?
No, finer counts typically show sensitivity at a higher humidity level than coarser counts, so the analysis is usually run separately for each major count range the mill spins.
Can this analysis account for fiber batch differences?
Yes, where fiber lot data is available, it can be included as another variable, since fiber moisture regain and quality also affect how sensitive a batch is to humidity swings.
Does this connect to our existing frame stop data?
In most cases, yes. iFactory AI reads end-break or stop data from existing frame monitoring and aligns it with humidity records automatically. Ask support which frame monitoring systems connect.
Turn a Hunch Into a Chart You Can Act On
iFactory AI aligns end breaks, humidity and shift data so the real pattern becomes visible. Book a walkthrough built around your mill.