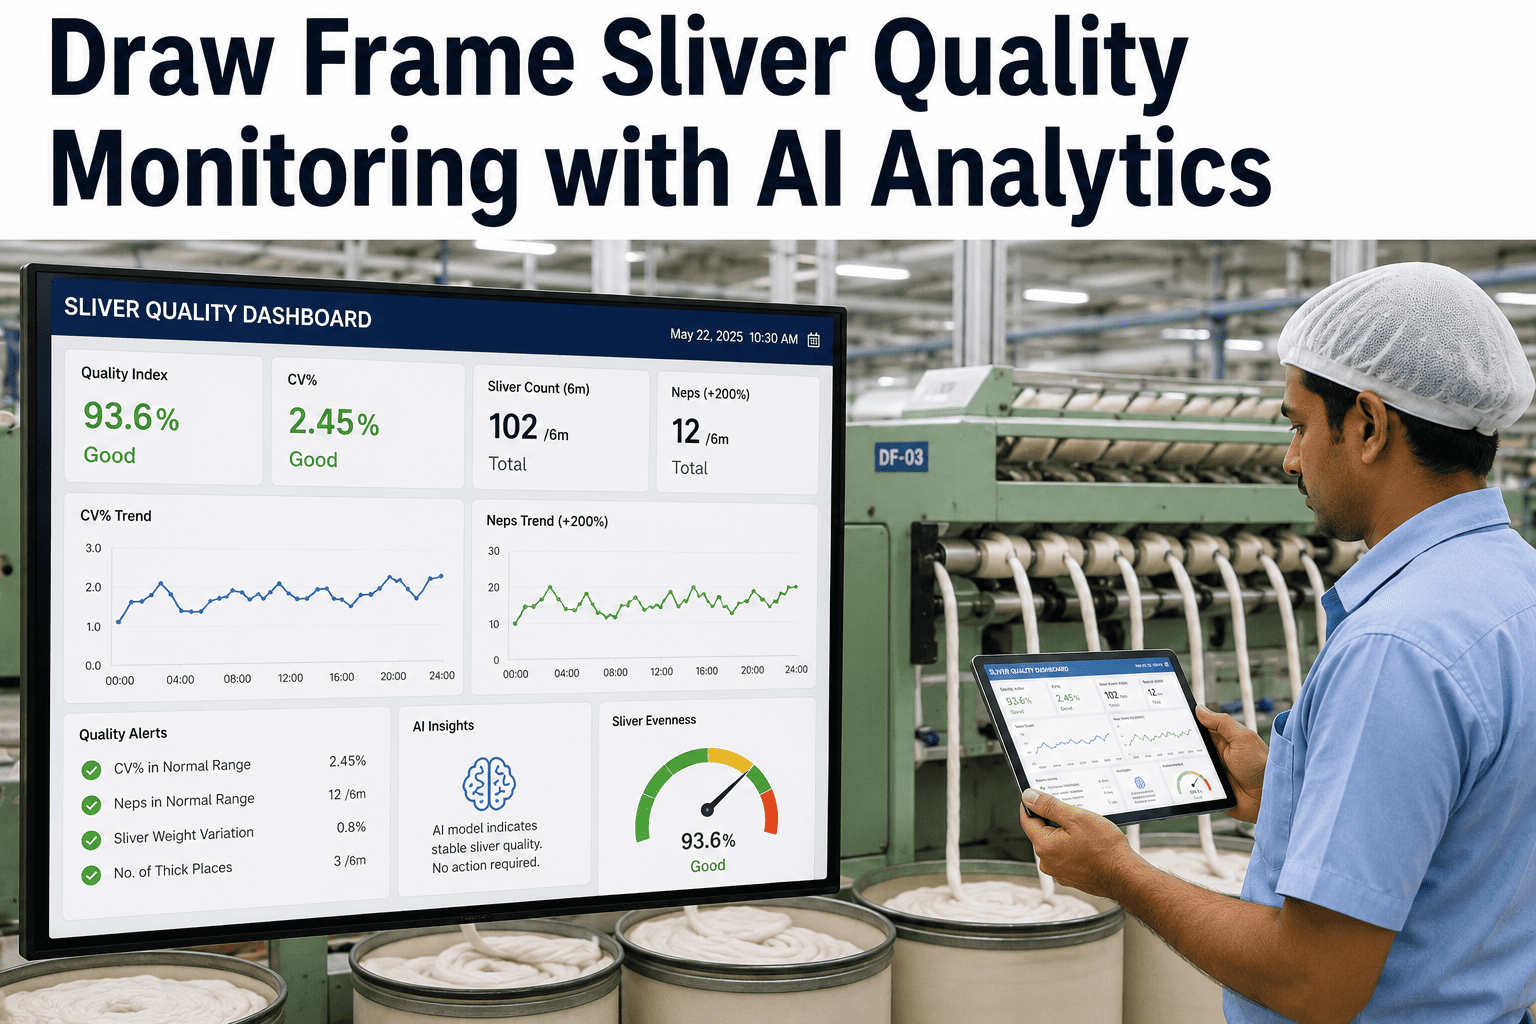
Sliver uniformity at the draw frame delivery determines more than 60% of yarn evenness variability in ring spinning — and autoleveller optimization is the primary tool U.S. mills have to control it. Without systematic monitoring of autoleveller response curves, draft parameters, and sliver mass variation, even the best-equipped draw frame produces inconsistent quality. iFactory Draw Frame Quality Control continuously tracks sliver CV%, autoleveller correction accuracy, draft stability, and roller condition across Trutzschler TD, Rieter RSB, and Marzoli draw frames — giving spinning mills the visibility needed to maintain sliver uniformity within tight control limits. Book a demo to see how AI-powered monitoring stabilizes your draw frame output.
Sliver Uniformity at the Core of Your Spinning Line
A technical guide to draw frame sliver uniformity optimization — covering CV% control strategies, autoleveller parameter tuning, statistical process control for sliver quality, and the monitoring infrastructure needed to keep every delivery within specification. Designed for U.S. textile mills targeting consistent yarn quality across counts and blends.
Six Metrics That Define Sliver Uniformity
Sliver uniformity is not a single number — it is a combination of mass variation across different wavelength ranges, short-term irregularity, long-term drift, and spectrogram signatures. Each metric reveals a different aspect of draw frame performance and autoleveller effectiveness. The table below summarizes the six critical uniformity metrics, their acceptable ranges for typical U.S. mill applications, and what drives each one.
| Metric | Symbol | Target Range | Wavelength | Primary Driver | Autoleveller Impact |
|---|---|---|---|---|---|
| Coefficient of Variation | CV% | 1.8 — 2.5% | Full spectrum | Overall draft precision | Direct — primary controlled variable |
| Short-Term Irregularity | CV1m | 0.8 — 1.5% | < 1 meter | Roller condition, break draft | Moderate — open loop corrects |
| Long-Term Drift | CV100m | < 1.0% | > 10 meters | Autoleveller setpoint drift | Strong — closed loop controls |
| Periodic Peaks | dB | < 3 dB above noise | Roller circumference | Mechanical eccentricity | None — mechanical wear only |
| Mass per Unit Length | ktex | +/- 0.5% of setpoint | — | Autoleveller accuracy | Direct — primary control variable |
| Spectrogram Drift | Shape | Flat baseline | — | Fiber friction change | Indirect — draft setting stability |
Four-Step Sliver Uniformity Optimization Protocol
Achieving and maintaining sliver CV% below 2.0% requires a structured approach that combines mechanical setup, autoleveller tuning, statistical baseline establishment, and ongoing monitoring. The four-step protocol below is designed for Trutzschler TD, Rieter RSB, and Marzoli draw frames with digital autoleveller systems.
Mechanical Baseline
Verify roller condition, weighting pressure, ratch settings, and trumpet alignment before enabling autoleveller. Mechanical defects below 2% CV% cannot be corrected by any autoleveller — they must be eliminated mechanically. Measure roller eccentricity with a dial indicator; reject any roller with runout exceeding 0.02 mm.
Autoleveller Tuning
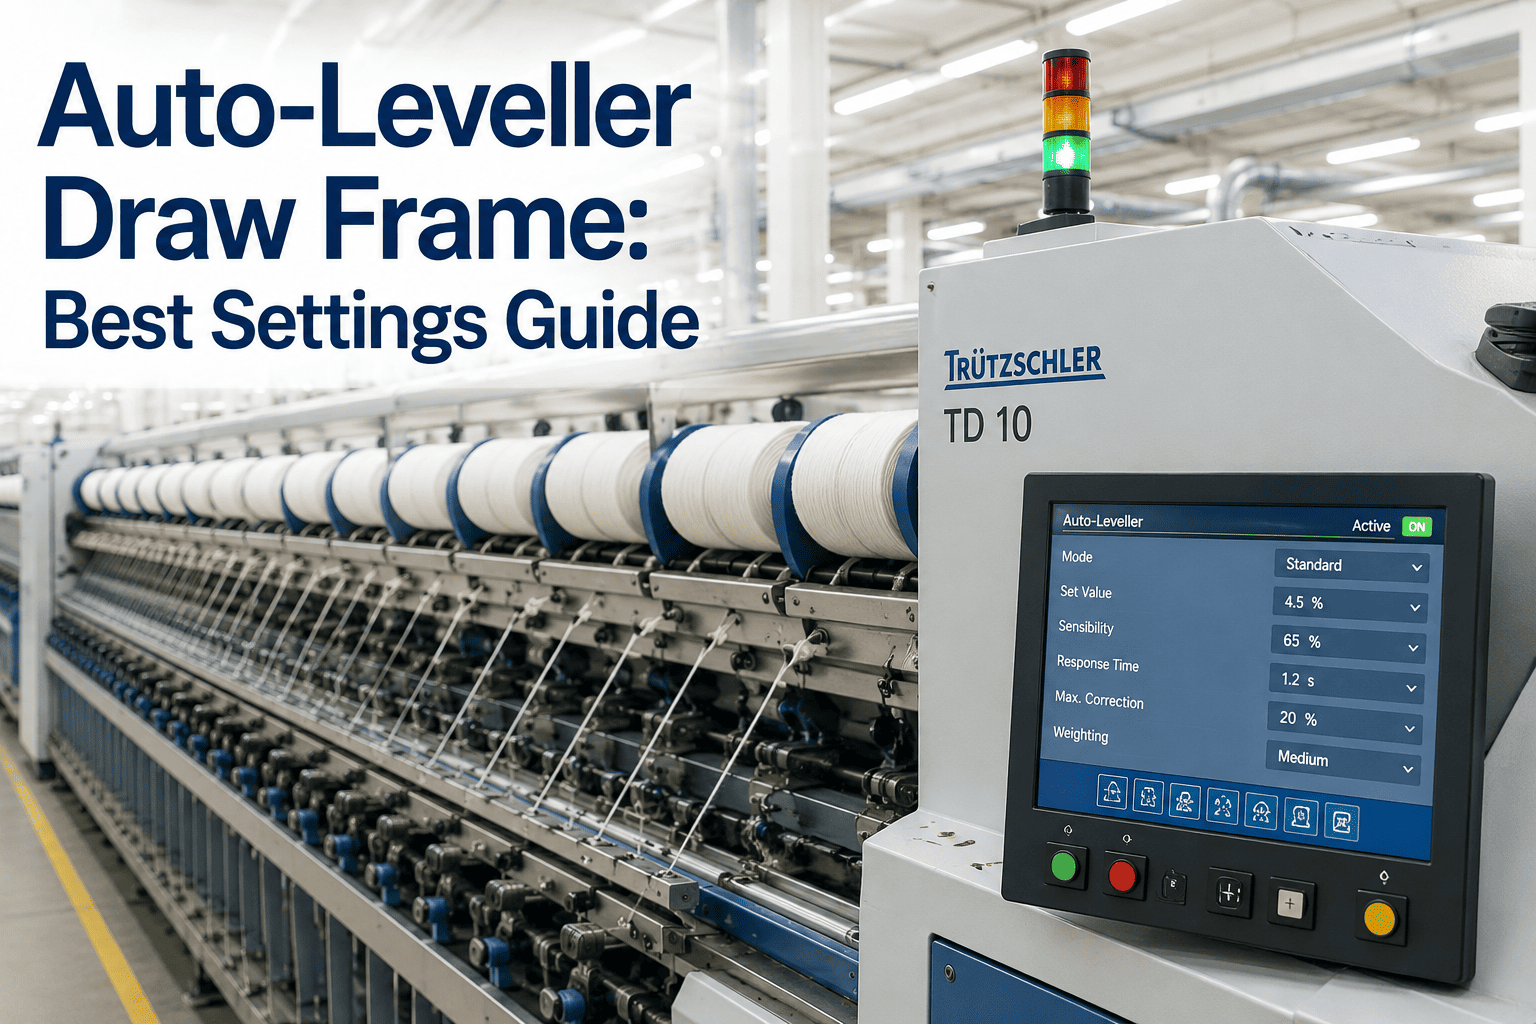
Set correction strength between 85-95%, response time matched to delivery speed, and mass setpoint within +/- 0.5% of target ktex. Run a step-change test — introduce a doubled sliver at the feed and measure how quickly the autoleveller returns CV% to baseline. Target recovery within 3 meters of sliver.
Statistical Baseline
Run 50 consecutive cans per delivery head and measure CV% on an evenness tester. Calculate mean, standard deviation, and control limits (UCL/LCL). Establish distinct baselines for each material type, sliver count, and delivery speed. Document the autoleveller settings that produced each baseline.
Continuous Monitoring
Deploy real-time monitoring on every delivery head. Track CV%, mass setpoint deviation, autoleveller correction activity, and spectrogram baseline. Configure alerts for CV% exceeding UCL, autoleveller correction exceeding 10% of setpoint, and spectrogram peaks above 3 dB. Review trends weekly for each machine.
Draw Frame Optimization Impact — Measured Results
The table below compares typical U.S. mill draw frame performance before and after implementing structured sliver uniformity optimization with autoleveller tuning and real-time monitoring. Results are based on data from 14 draw frames across three mills producing Ne 20-40 carded cotton yarns.
Turn Your Draw Frame Data Into a Quality Advantage
Mills using iFactory for draw frame quality monitoring achieve an average sliver CV% of 1.9% across all deliveries — with CV% range across heads reduced to +/- 0.3%. The platform tracks every parameter that determines sliver uniformity and alerts your team before quality drifts beyond control limits. Schedule a call to discuss your draw frame quality objectives.
Sliver Uniformity Quality Tiers and Their Downstream Impact
The acceptable sliver CV% varies by end-use application. A mill producing open-end yarn for denim can operate at higher CV% than a mill spinning compact yarn for shirting. The tier framework below maps sliver uniformity ranges to yarn applications, downstream efficiency, and the autoleveller capability required to maintain each tier.
Common Sliver Uniformity Defects and Autoleveller-Based Solutions
When sliver uniformity degrades, the root cause typically falls into one of six categories. The matrix below maps each defect to its spectrogram signature, the autoleveller parameter that requires adjustment, and the corrective action that restores uniformity within two production hours.
| Defect | Spectrogram Signature | CV% Impact | Autoleveller Solution | Resolution Time |
|---|---|---|---|---|
| Drafting wave | Broad peak at 3-8 cm | +0.6 — 1.2% | Reduce break draft 0.1-0.2; narrow ratch 1 mm | 15 min |
| Autoleveller cycling | Oscillating CV% every 3-5 m | +0.4 — 0.8% | Reduce correction strength 5%; increase deadband | 10 min |
| Sensor drift | Gradual CV% increase over hours | +0.3 — 0.7% | Clean sensor trumpet; recalibrate zero and span | 30 min |
| Roller eccentricity | Sharp peak at roller circumference | +0.5 — 1.5% | Replace eccentric roller; verify runout < 0.02 mm | 45 min |
| Material change transient | CV% spike on blend/lot change | +0.8 — 2.0% | Adjust mass setpoint; allow autoleveller 3-5 m to stabilize | 20 min |
| Suction/airflow disruption | Random thick-thin with no periodicity | +0.3 — 0.5% | Clean suction ducts; check vacuum level at draw box | 15 min |
Frequently Asked Questions
What is the difference between sliver CV% and sliver mass variation?
Sliver CV% (coefficient of variation) measures the relative variability of sliver mass per unit length — it is the standard deviation divided by the mean, expressed as a percentage. Sliver mass variation typically refers to the absolute deviation from the target setpoint in ktex or grams per meter. CV% captures short-term and long-term irregularity regardless of absolute mass level, while mass deviation indicates whether the autoleveller is maintaining the correct linear density. Both are needed for comprehensive quality assessment: CV% tells you how even the sliver is, and mass deviation tells you whether it matches the downstream process requirements.
What autoleveller settings have the greatest impact on sliver uniformity?
Three settings dominate sliver uniformity outcomes: correction strength (typically 85-95% — too high causes cycling, too low under-corrects), autoleveller response time (matched to delivery speed — typically 0.1-0.5 seconds for open loop), and the mass setpoint accuracy (must be within 0.5% of target ktex). The break draft ratio is the fourth critical parameter — it controls fiber gripping at the back roller and incorrect break draft is the single most common cause of periodic drafting waves that increase CV% by 0.6-1.2%. These four parameters account for approximately 80% of the CV% variability at the draw frame delivery.
How do I set up SPC control limits for sliver CV% at the draw frame?
Start by collecting at least 50 consecutive sliver samples per delivery head per material type. Calculate the mean CV% and standard deviation. Set the upper control limit (UCL) at mean + 3 sigma and the lower control limit (LCL) at mean - 3 sigma. For most carded cotton applications with mean CV% of 2.2% and sigma of 0.25%, the UCL would be approximately 2.95% and LCL approximately 1.45%. Once established, monitor CV% in real time. A single point beyond the UCL requires immediate investigation. Two out of three consecutive points beyond 2 sigma indicate a developing trend. iFactory automates this SPC calculation and alerting across all draw frame deliveries.
Can the same autoleveller settings work for cotton and polyester blends?
No. Polyester and cotton-polyester blends require distinct autoleveller settings because of differences in fiber friction, compression behavior, and sliver cohesion. Polyester typically requires 8-12% higher correction strength due to lower fiber-to-fiber friction in the drafting zone. The roller ratch should be increased by 2-4 mm for polyester-rich blends to accommodate longer fiber length distribution. The mass setpoint may need adjustment because polyester sliver compresses differently in the measuring trumpet. Cotton-polyester blends (typically 50/50 or 65/35) require intermediate settings verified through CV% measurement. Most mills maintain separate autoleveller setting recipes for each material type.
How does iFactory improve sliver uniformity compared to machine-only monitoring?
Machine autolevellers correct mass variation in real time but cannot detect calibration drift, mechanical wear trends, or CV% degradation patterns across shifts and days. iFactory adds a layer of statistical process control and trend analysis that machine-level control systems do not provide: cross-machine CV% benchmarking, autoleveller response curve trending over weeks, spectrogram baseline comparison across material lots, predictive calibration alerts based on sensor drift rate, and correlation of sliver CV% with downstream ring frame end breaks. Mills using iFactory report reducing CV% range across deliveries from +/- 0.9% to +/- 0.3% within three months of deployment.
Achieve Sliver CV% Below 2.0% Across Every Draw Frame Delivery
iFactory provides real-time sliver uniformity monitoring, autoleveller parameter tracking, SPC-based quality alerts, and cross-machine CV% benchmarking — purpose-built for U.S. spinning mills that need consistent sliver quality from every draw frame, every shift, for every yarn count and blend they produce.