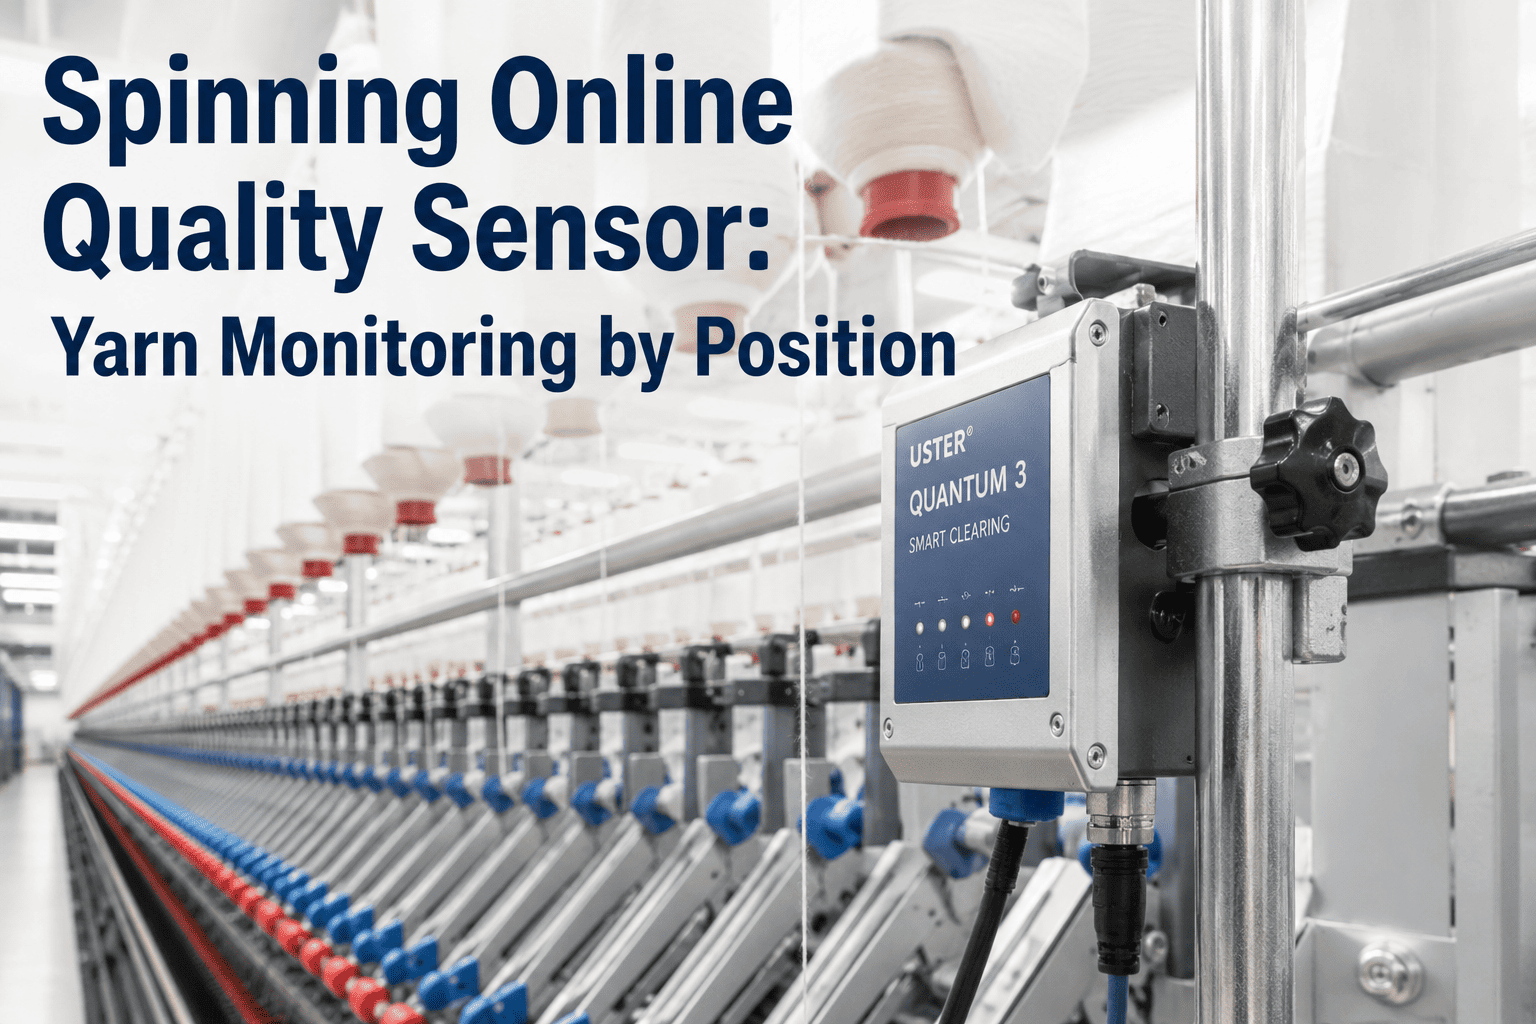
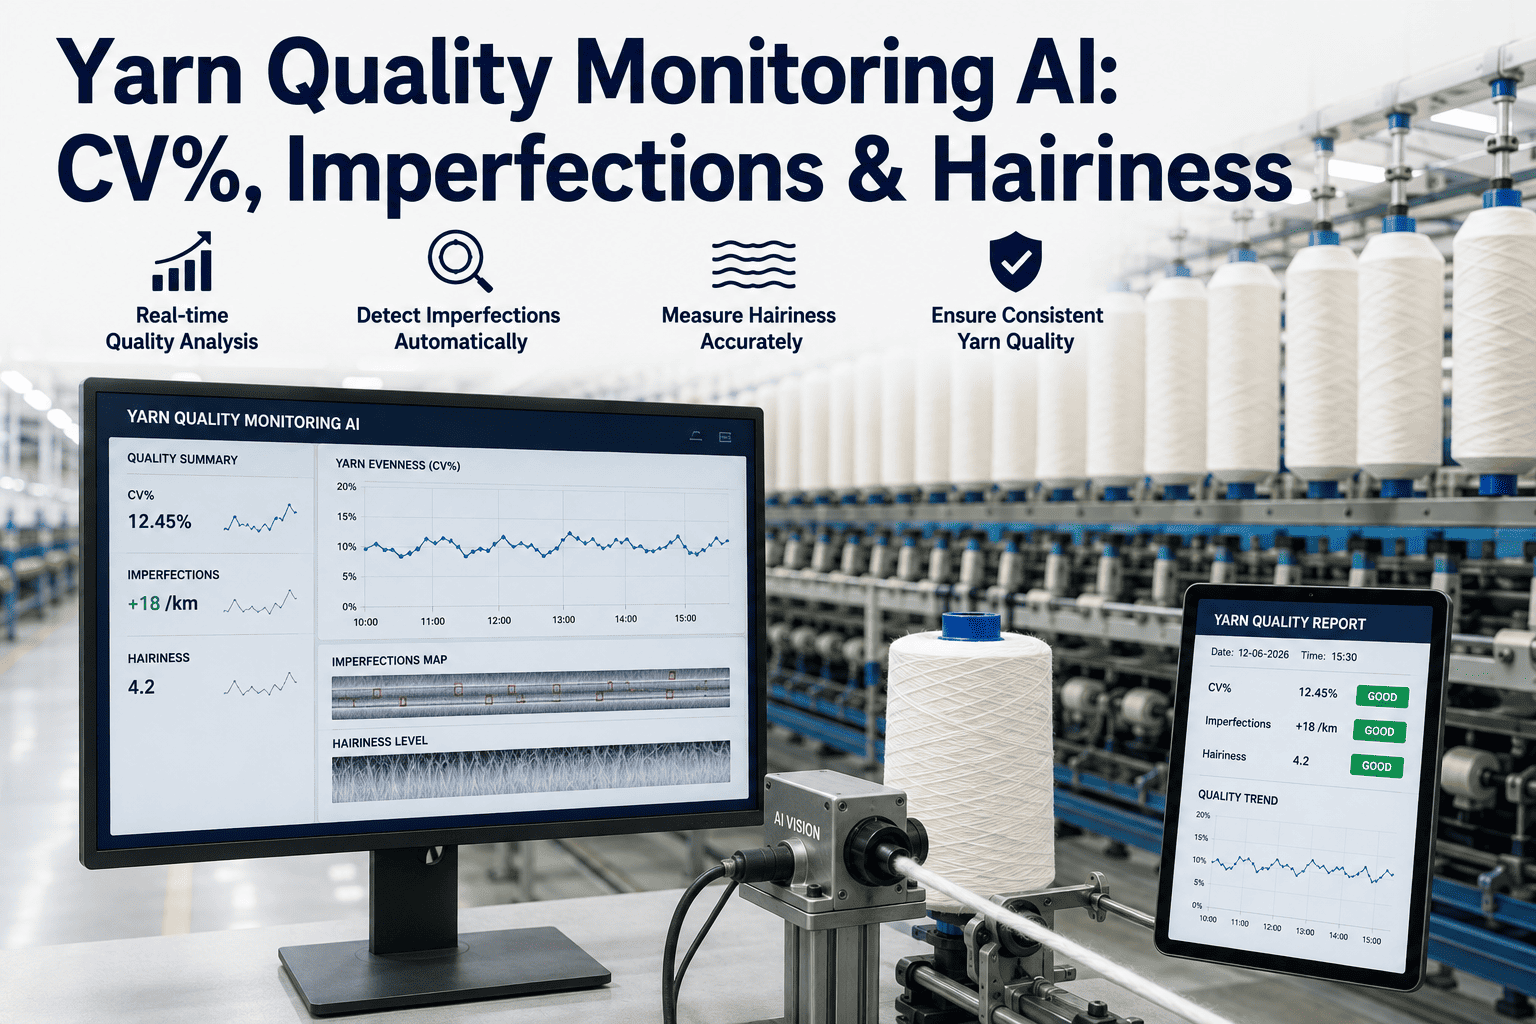
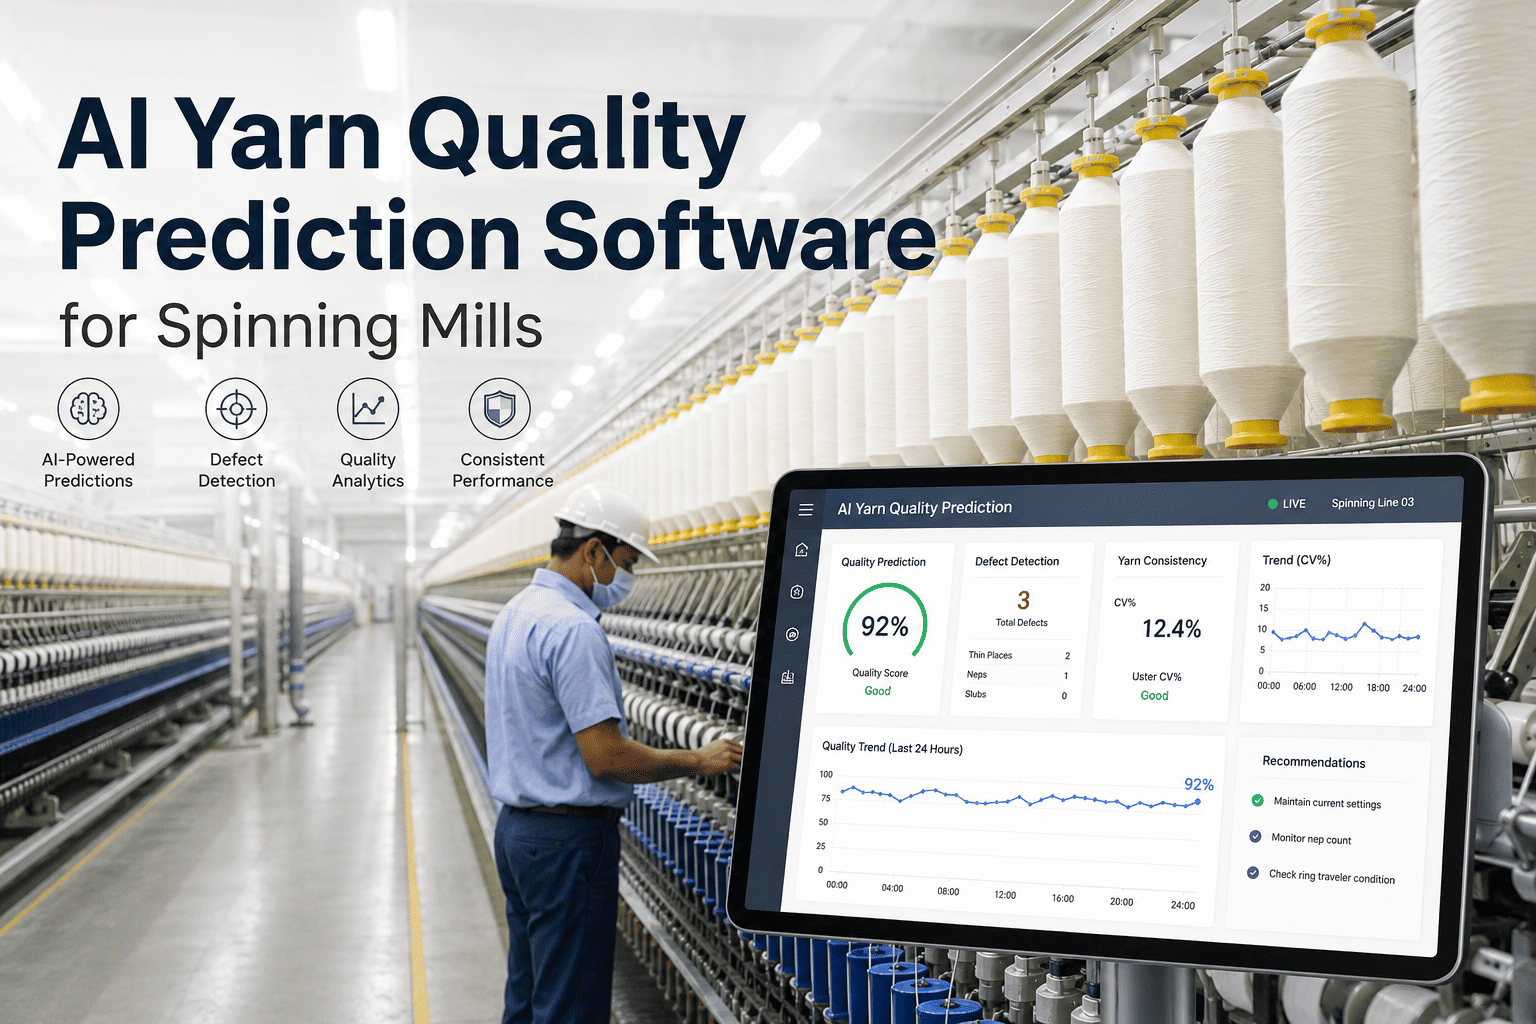
Yarn evenness is the single most important predictor of fabric quality and weaving efficiency, yet most spinning mills still measure it with lab-based Uster testers that sample less than 0.01 percent of total production. A ring spinning frame producing 1,000 kg of yarn per shift sends a single 100-meter bobbin to the quality lab every four hours. The CV%, thin places, thick places, neps, and hairiness numbers reported on the daily quality summary represent a tiny fraction of actual production. The undetected yards between lab tests contain the periodic faults, the count variations, and the uneven segments that cause warp breaks, weft stops, and fabric appearance defects downstream. AI-powered yarn quality monitoring systems analyze every meter of yarn at full spindle speed using inline optical sensors and machine vision, detect CV% variations below 0.3 percent, identify periodic faults at any wavelength, and classify thin and thick places to Uster Statistics thresholds in real time. Mills using AI yarn monitoring reduce weaving downtime by 30 to 45 percent, cut customer yarn quality claims by 55 to 70 percent, and shift from reactive quality control to closed-loop process adjustment that prevents faults before they are spun.
Monitor Yarn Quality Every Meter, Every Spindle
iFactory AI yarn quality monitoring tracks CV%, hairiness, thin and thick places, and neps in real time across ring spinning, open end, and air jet processes. Inline detection at full production speed. Deployed in 7 to 14 days.
Key Yarn Quality Parameters Monitored by AI
Five parameters determine whether a yarn meets quality specifications. The cards below show the target ranges, typical defect thresholds, and the downstream impact of each parameter for ring-spun cotton yarns in the Ne 20 to Ne 40 range.
CV%
Coefficient of variation of massThin Places
-50% threshold per 1,000 mThick Places
+50% threshold per 1,000 mNeps
+280% threshold per 1,000 mHairiness H
Mean hair length protruding from yarn bodyCV% Variation Across Spinning Technologies
The bar chart below compares typical CV% ranges for ring spinning, open-end rotor spinning, and air-jet spinning across three common yarn counts. AI monitoring adjusts the alert thresholds dynamically based on the spinning technology and yarn count being produced.
Uster CV Percentile Classification
Uster Statistics classify yarn evenness on a percentile scale from 5 percent (world-class) to 95 percent (poor). The table below shows the CV% thresholds for each percentile level across common ring-spun cotton yarn counts, along with the corresponding quality classification used by AI monitoring systems.
| Percentile | Classification | Ne 20 CV% | Ne 30 CV% | Ne 40 CV% | AI Action |
|---|---|---|---|---|---|
| 5% | World class | ≤ 10.5 | ≤ 11.5 | ≤ 13.0 | Maintain current settings |
| 25% | Excellent | 10.6 – 11.5 | 11.6 – 12.5 | 13.1 – 14.0 | Monitor trend, no action required |
| 50% | Good | 11.6 – 12.5 | 12.6 – 13.5 | 14.1 – 15.0 | Review draft settings |
| 75% | Average | 12.6 – 13.5 | 13.6 – 14.5 | 15.1 – 16.0 | Schedule maintenance check |
| 95% | Poor | > 13.5 | > 14.5 | > 16.0 | Immediate process intervention |
AI versus Lab Testing Detection Comparison
The bars below compare defect detection rates between traditional lab-based Uster testing and inline AI monitoring across 50,000 kg of ring-spun Ne 30 yarn. AI monitoring detects faults continuously during production while lab testing samples less than 0.01 percent of output.
Lab Uster Tester (Batch Sample)
Inline AI Monitoring (Continuous)
Real-Time Spinning Quality Dashboard
The dashboard card below shows a live AI monitoring view for a ring spinning frame producing Ne 30 combed cotton. The system tracks CV%, hairiness, and defect counts per spindle and alerts the quality team when any parameter exceeds the configured threshold.
Active Alerts
Frequently Asked Questions
Monitor Yarn Evenness Across Every Spindle in Real Time
iFactory AI yarn quality monitoring measures CV%, hairiness, thin and thick places, and neps inline at full production speed. Spindle-level fault detection with sub-second alerting. Deployed in 7 to 14 days.