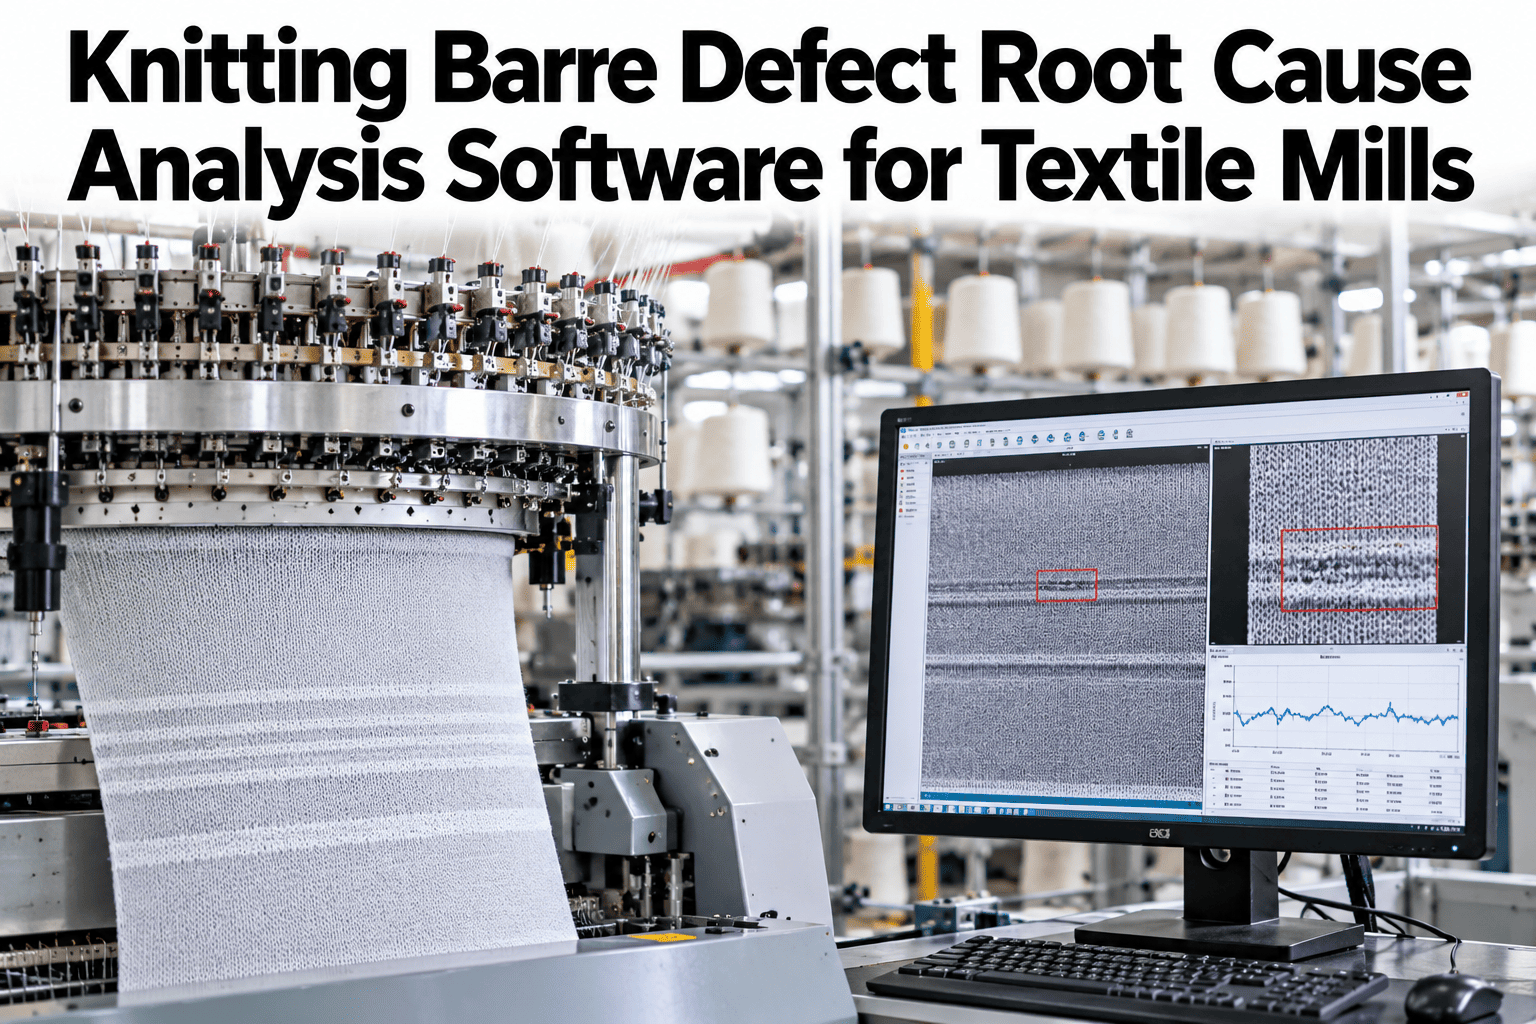
Barre is the defect that appears after everything else looks right. The greige fabric passes inspection, the dyeing is on recipe and then horizontal bands show up across the width, and the knitting, yarn and dyeing teams each point at the other two. Finding the cause means first deciding what kind of barre it is, then reading its pattern, and only then looking at the machine, the yarn or the dye lot. Knitting mills who want a clear method can ask iFactory AI how barre defects are traced across yarn, machine and dyeing data.
Find the Root Cause of Barre Before the Blame Game Starts
iFactory AI links yarn lots, feeder data, machine settings and dyeing results to each barre defect, so the cause is found from evidence and not from opinion.
What Barre Is and Why It Is Hard to Pin Down
Barre is a repeating horizontal band of shade or texture variation. It hides in greige and shows up after dyeing, which is why it is so often argued about.
Structural barre
A real difference in loop length, tension or yarn in the fabric, visible in greige and worse after dyeing.
Dye barre
A difference in how fibre or yarn takes dye, even when the knitting structure is uniform.
Mixed barre
A small structural difference that dyeing amplifies into an obvious band.
The Decision Path: Greige First, Dyed Second
A simple path separates knitting causes from dyeing causes quickly.
Reading the Barre Pattern Back to Its Cause
How a barre repeats is the best clue you have. This table links patterns to likely causes.
| Pattern | Likely Cause | First Check |
|---|---|---|
| One band repeating at a regular interval | A single feeder or needle position | Feeder tension, guides and needles at that position |
| Bands that repeat once per machine revolution | A feeder-specific issue | Compare each feeder's loop length and tension |
| Irregular bands across rolls | Yarn count or twist variation | Yarn lots, mixed packages and test data |
| Bands that start after a lot change | Mixed yarn lots or dye lots | Lot records on the machine and in dyeing |
| Bands only visible after dyeing | Dye uptake variation | Fibre, yarn dye lot and dyeing machine records |
A Worked Look at Feeder Repeat
This is illustrative arithmetic for a machine with 96 feeders. A stripe appears at a regular interval.
| Item | Basis | Result |
|---|---|---|
| Feeders on the machine | Machine specification | 96 |
| Courses knitted per revolution | One course per feeder | 96 courses |
| Stripe repeat interval | Measured on the fabric | Every 96 courses |
| Reading | Interval equals one revolution | One feeder is behaving differently |
| Next check | Inspect that feeder's tension and loop length | Likely first cause |
Where Barre Comes From
Causes fall into a few groups. The chart shows an illustrative ranking.
End the Blame Game With Evidence for Every Barre Roll
Book a 30-minute session and iFactory AI will review your barre complaints and linked yarn, machine and dyeing records to show how causes can be traced.
Which Cause Shows Up Where
The matrix, shown as an illustration, links barre causes to where they can be seen first.
| Cause | Greige Fabric | After Dyeing | Yarn Test Data |
|---|---|---|---|
| Yarn count or twist variation | Moderate | High | High |
| Feeder tension difference | High | High | Low |
| Loop length variation from wear | High | High | Low |
| Mixed yarn or dye lots | Low | High | Moderate |
| Dye uptake difference | Low | High | Low |
Opinion-Led or Evidence-Led Root Cause Work
Both teams may be right, but only evidence can say which cause applies.
Why Barre Is Costly
Barre often appears late, after most of the cost has been added. Four costs stack up.
Root Cause Method in Five Steps
A short method keeps the work focused.
Decide whether barre is structural, dye or mixed.
Measure the interval and compare it with feeder and revolution counts.
Join the rolls to yarn, machine and dye lot records.
Run a controlled trial on the suspected cause.
Check that the barre stops on the next lots.
Barre Investigation Checklist
Use this list on every barre complaint. Each box should be answerable from records.
A Composite Scenario: The Stripe That Followed One Feeder
This is a composite example, not a named mill. It shows how a measured interval changes an investigation.
Preventing Barre in the First Place
Finding the cause is good, but never making barre is better. Four controls remove most of the risk before knitting starts.
One yarn lot per machine run
Keeping lots separate removes the most common source of bands in a single roll.
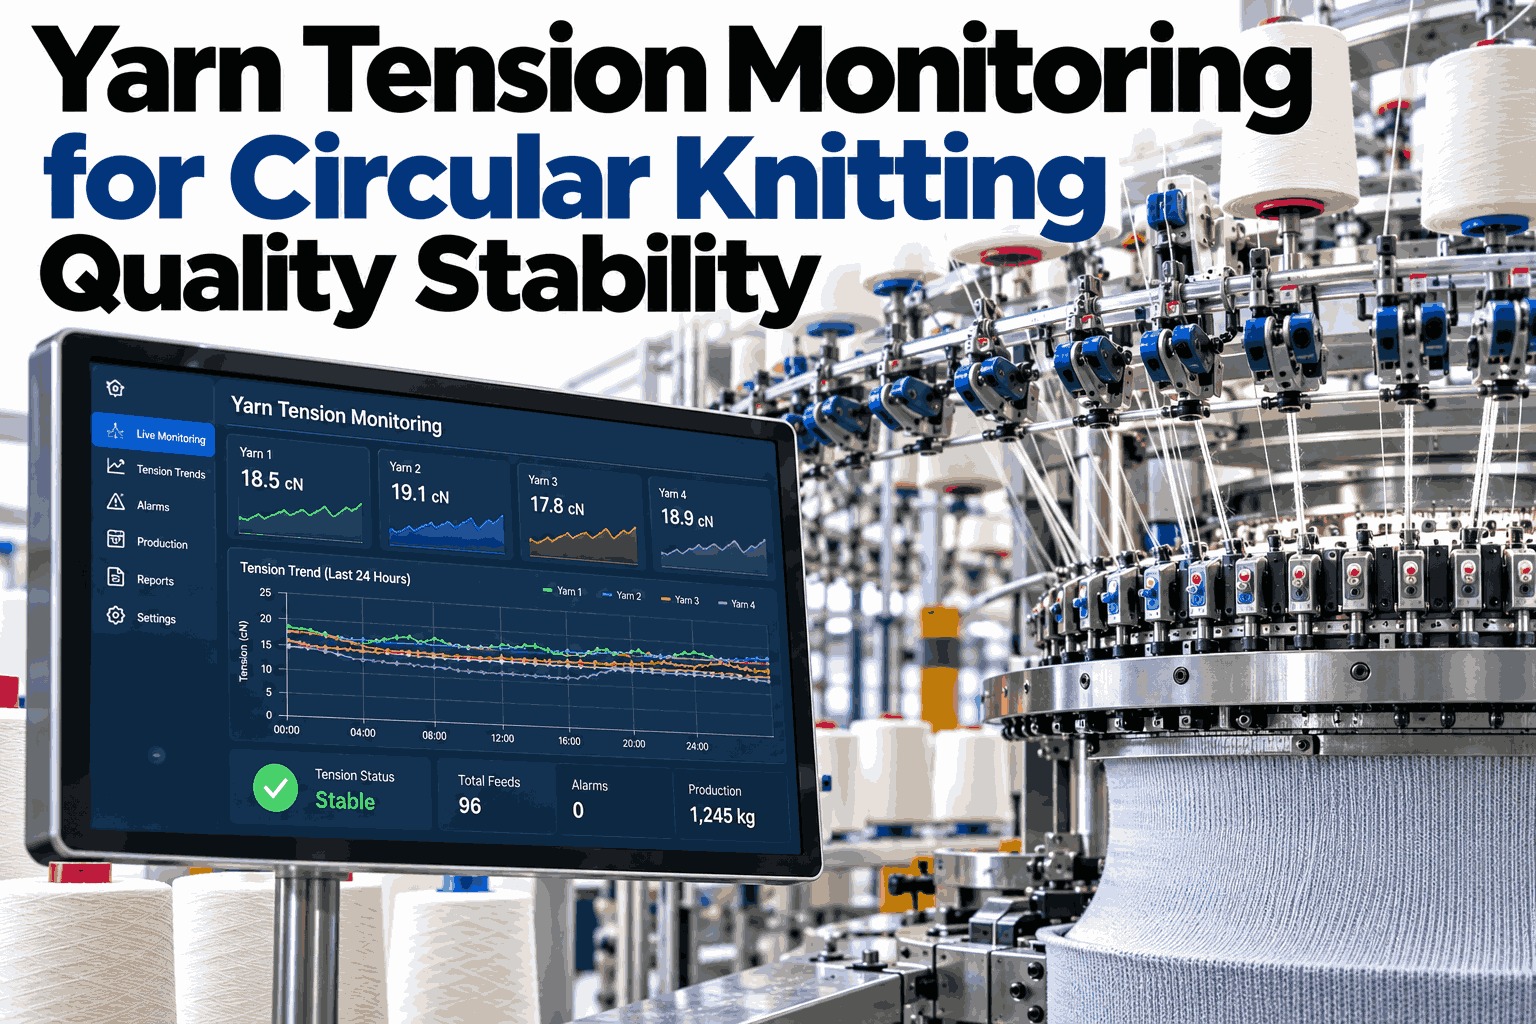
Feeder tension audits
Regular checks of tension and loop length at every feeder catch drift early.
Yarn test limits at receipt
Count and twist limits agreed with suppliers stop poor lots at the gate.
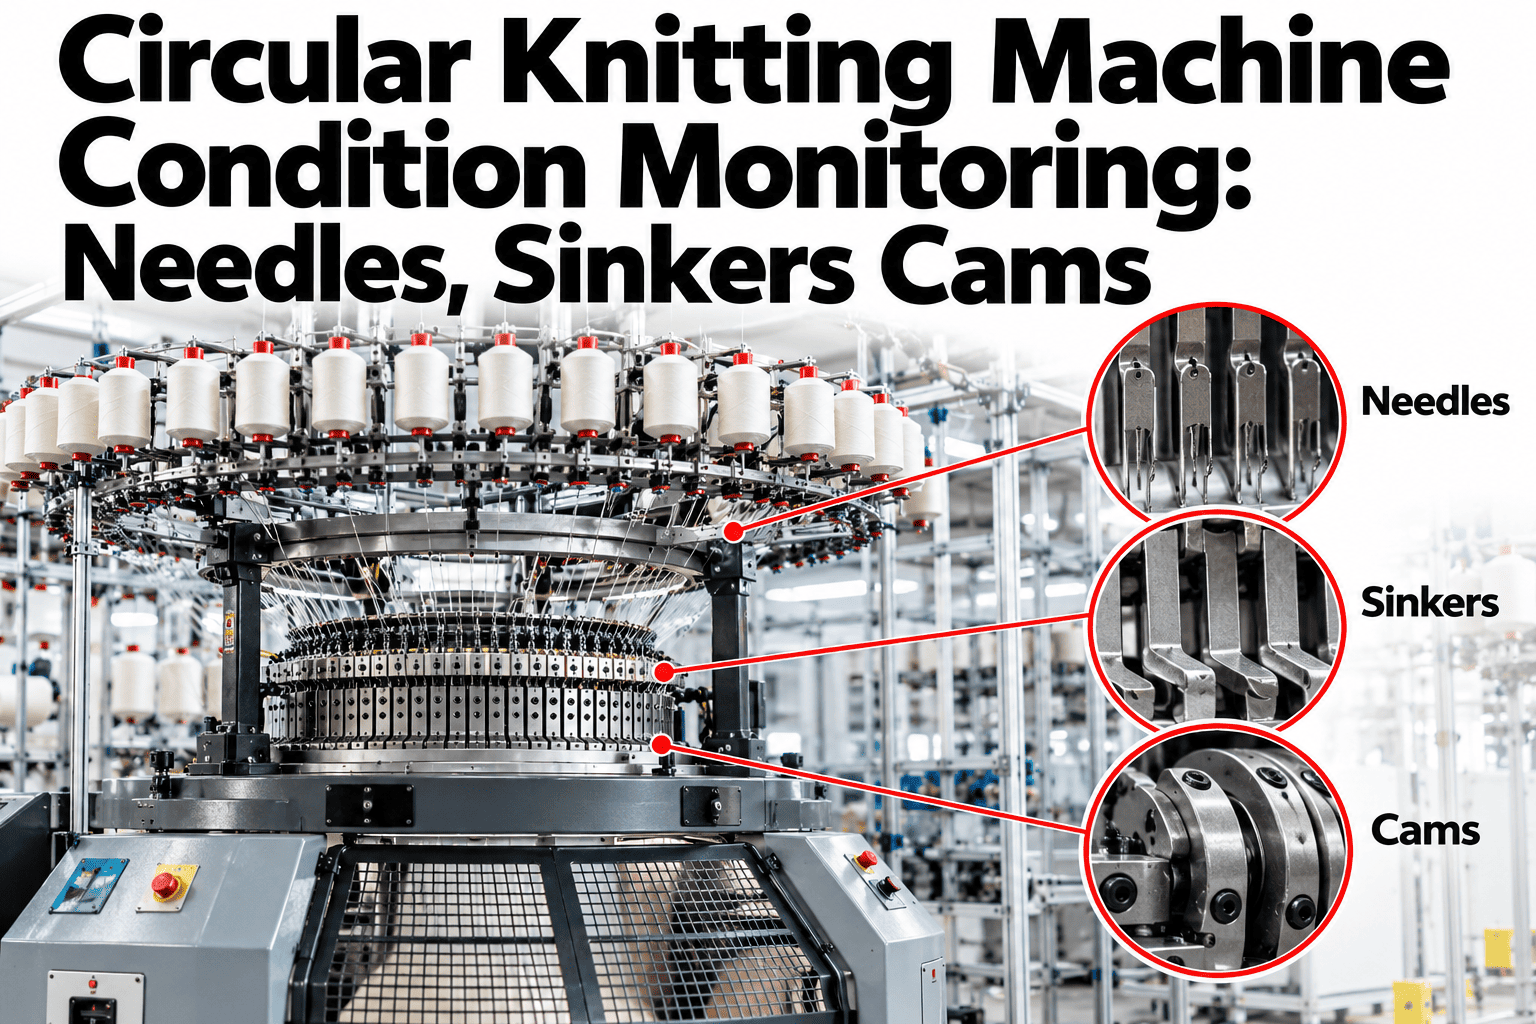
Needle and cam inspection
Worn parts change loop length slowly, so scheduled inspection keeps it steady.
Barre Prevention Habits Checklist
Use this list at every yarn lot change and at shift start. Each box should be answerable from records.
Mistakes That Prolong Barre Investigations
These habits turn weeks into months.
Starting with the dyeing recipe
Many barre defects exist in greige.
Not measuring the repeat interval
The best clue goes unused.
Mixing yarn lots on one machine
Mixed lots create barre by design.
Fixing several things at once
The cause can no longer be identified.
KPIs for a Barre Reduction Program
A few measures show whether prevention and analysis are working. Review them with knitting, yarn and dyeing together.
How Buyers Judge Barre
Customers do not use your internal measures. Knowing how they look at the fabric shapes how you inspect it.
| Buyer Check | What They Look For | How to Prepare |
|---|---|---|
| Visual inspection under standard light | Bands visible at normal viewing distance | Inspect greige and dyed fabric under the same light |
| Garment-level review | Bands across a cut and sewn panel | Check rolls before cutting, not only after sewing |
| Repeat order comparison | Shade or texture difference between lots | Keep lot records so repeats can be matched |
| Complaint follow-up | A clear explanation and corrective action | Keep evidence and a confirmed cause ready |
What iFactory AI Adds to Barre Analysis
iFactory AI is smart manufacturing and industrial software for knitting and other textile operations. Explore barre analysis in a live product tour on realistic knitting and dyeing data.
A 30-Day Plan to Start
A month is enough to build a first barre method on one product.
Review of Knitting Barre Root Cause Analysis
A practical review of what makes barre investigations work, written as editorial guidance rather than a named expert quote.
Classify before you blame
Structural and dye barre have different owners and fixes.
Use the repeat interval
The pattern of repetition is the strongest clue available.
Link the departments
Barre crosses knitting, yarn and dyeing, so the record must too.
Frequently Asked Questions
What causes barre in knitted fabric?
Common causes are yarn count, twist or lot variation, feeder tension and feed rate differences, loop length variation from wear, and dye uptake differences. See barre causes in a live demo with realistic data. The type and the pattern decide which one applies.
How do I tell structural barre from dye barre?
Inspect the greige fabric first. If the band is visible there, check loop length, GSM and yarn data, and if it appears only after dyeing, look at dye lots and the process. Greige inspection is the dividing test.
What does a repeat interval tell me?
An interval equal to the number of courses per revolution points to a single feeder or needle position. Ask support how repeat intervals are measured and compared with machine data. Irregular bands often point to yarn or lots.
Can mixed yarn lots cause barre?
Yes, mixed lots on one machine are a classic cause because small count or dye differences show as bands. Keep lots separate and record them per roll. Mixed lots should be avoided or controlled.
How soon can we improve?
Many mills confirm a first barre cause within weeks of linking yarn, machine and dye records. Book time to scope a barre analysis pilot with your teams. A confirmed cause ends the debate and starts the fix.
Turn Barre From a Blame Game Into a Solved Problem
iFactory AI links yarn, machine and dyeing records so barre causes are found from evidence. Book a walkthrough to see it on your own fabric.