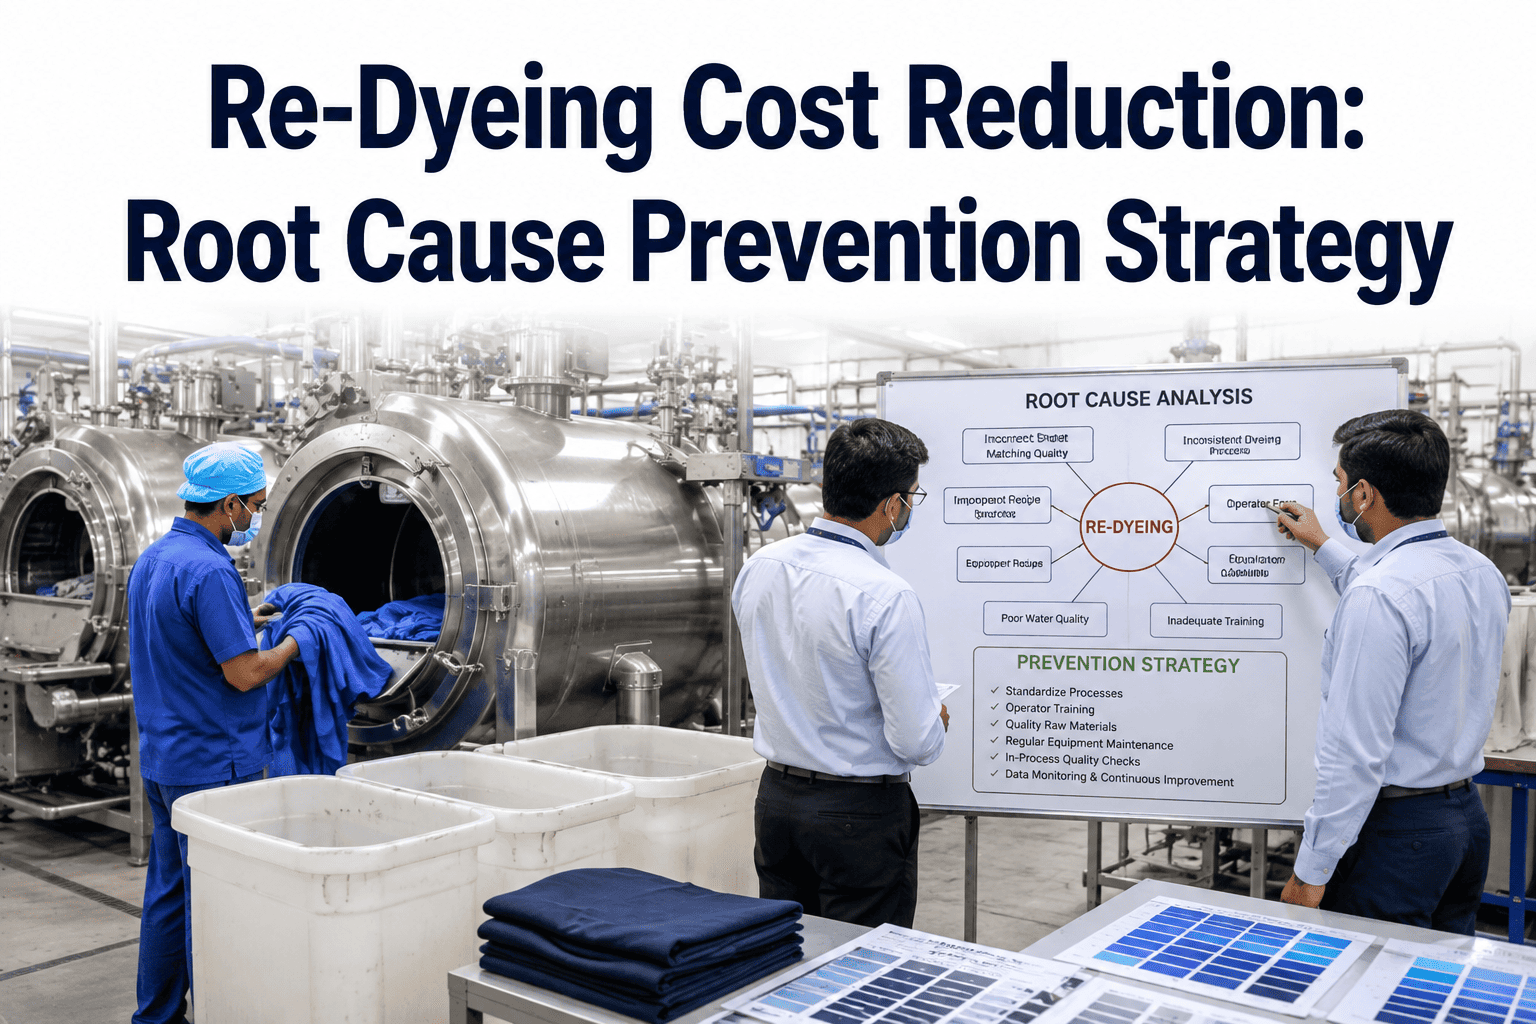
A single re-dyeing cycle rarely shows up as its own line item on a factory's monthly cost report, which is exactly why it survives year after year as one of the largest hidden expenses in wet processing. Industry benchmarking puts re-dyeing rates at 12 to 20 percent of total dyed lots across conventional dye houses, and each corrected lot typically costs two to four times more than getting the shade right the first time once water, energy, chemicals, labor, and lost machine capacity are added together. The pattern repeats because most re-dyeing gets treated as a shade-matching problem to fix in the moment rather than a process signal worth tracing back to its origin. Root cause prevention flips that sequence, and booking a demo shows exactly how the tracing works against your own production data.
Cut Re-Dyeing Before It Ever Reaches the Bath
iFactory Process AI traces every re-dyed lot back to its true root cause, whether that's recipe design, machine variation, or raw material drift, so your team fixes the source instead of repeating the correction next month.
Where a Single Re-Dyeing Cycle Actually Spends Your Money
The visible cost of re-dyeing is the second round of dye and chemicals, but that is usually the smallest piece of the total. The stacked breakdown below shows how a single correction cycle accumulates cost across every stage it touches, using a representative 500-kilogram cotton lot as the reference batch, and the pattern holds directionally across most fiber types and machine configurations.
Machine time is consistently the largest hidden component, because a re-dyed lot displaces the next scheduled batch and the delay cascades through the rest of the week's production plan, not just the corrected lot itself.
Four Categories Behind Almost Every Re-Dyeing Event
When re-dyeing events are traced back systematically rather than corrected in isolation, they consistently sort into four categories. Knowing which category dominates a factory's history determines whether the fix belongs in the recipe lab, on the shop floor, in raw material sourcing, or in how shade decisions get approved.
Recipe Formulation Gaps
Recipes built without accounting for substrate variation, liquor ratio changes, or machine-specific dye uptake behavior arrive at the bath already carrying a mismatch risk. This category is the most preventable because it can be caught before the batch ever loads, yet it remains the single largest source of correction cycles in most conventional dye houses.
Process Parameter Drift
Temperature ramp rate, dosing timing, and liquor circulation all influence final shade, and small deviations from the validated process window accumulate into a visible shift by the end of the cycle. These deviations are rarely intentional and are usually invisible to an operator watching a single gauge rather than the full process curve.
Raw Material Variability
Fiber lot changes, dye strength variation between supplier batches, and inconsistent pretreatment all shift how a proven recipe behaves on a given day. A recipe that performed perfectly on Monday's fabric lot can produce a visible shade deviation on Thursday's lot without a single parameter on the machine changing.
Approval and Communication Gaps
Some corrections trace back not to a technical error at all, but to a shade standard, tolerance, or approval note that was miscommunicated between the lab, the floor, and the buyer, resulting in a batch dyed correctly to the wrong reference. These events are entirely process failures rather than chemistry failures, and they respond to workflow fixes rather than recipe fixes.
The Costs That Extend Beyond the Corrected Lot Itself
The direct cost breakdown above only captures what happens to the single batch being corrected. In practice, a re-dyeing event ripples outward into the surrounding production schedule and the buyer relationship in ways that rarely appear on a per-lot cost report but add up to a meaningful share of total operating cost over a year.
Queue Displacement
A batch pulled back for correction does not simply add its own extra cycle time, it also displaces every lot scheduled behind it on the same machine, forcing planners to either delay downstream orders or scramble to reshuffle the week's production sequence on short notice.
Shipment Delay Exposure
When a correction cycle eats into the buffer built into a shipment schedule, the factory is left choosing between air freight premiums to hold the delivery date or a late shipment penalty, both of which erase margin far beyond the direct dyeing cost of the correction itself.
Buyer Confidence Erosion
A factory with a visibly high correction rate, even when every corrected lot eventually ships within tolerance, accumulates a quality reputation that affects future order allocation and audit scrutiny long after any individual re-dyeing event is forgotten.
Colorist and Supervisor Time
Every correction cycle consumes hours of colorist and shift supervisor attention that could otherwise go toward developing new recipes or improving process capability, meaning the true cost of re-dyeing also shows up as slower innovation elsewhere in the operation.
Where Your First-Time-Right Rate Should Sit
First-time-right rate, the share of lots that pass shade approval without any correction cycle, is the single clearest indicator of how much hidden cost a dye house is carrying. The scale below places typical performance bands against what root cause prevention programs consistently achieve within a year.
Below 70% FTR
70 to 82% FTR
82 to 90% FTR
Above 90% FTR
Most conventional dye houses operate in the 65 to 78 percent range without realizing how much cost that band represents, since re-dyeing gets absorbed into general production cost rather than tracked as its own metric.
Five Steps to Trace and Close a Re-Dyeing Root Cause
Prevention only works when every correction event feeds back into a structured trace rather than being logged as a one-off fix. This is the sequence that converts a repeating re-dyeing pattern into a resolved process gap.
Log the Correction With Full Context
Every re-dyeing event is recorded with the original recipe, the process trend data, the raw material lot, and the specific deviation observed, rather than just a pass or fail note against the shade standard.
Classify Against the Four Root Cause Categories
The event is automatically compared against recipe, process, raw material, and communication signatures from prior corrections to identify which category it most closely matches before a human review begins.
Surface Repeating Patterns Across Lots
Individual corrections are cross-referenced against the growing history so that a pattern repeating across multiple lots, machines, or shade codes is flagged as a systemic issue rather than treated as an isolated event each time.
Assign the Fix to the Right Owner
A recipe-category root cause routes to the color lab, a process-category root cause routes to the shop floor supervisor, and a raw material root cause routes to procurement and incoming inspection, so the fix lands with the team that can actually close it.
Verify the Fix Against the Next Occurrence
Once a fix is applied, the system watches for the same signature reappearing in future lots, confirming whether the root cause was actually closed or whether the correction only masked the symptom temporarily.
The Three Data Sources a Root Cause Model Actually Needs
Accurate root cause classification depends on connecting three data sources that most dye houses already generate but rarely bring together in one place. Understanding what each source contributes clarifies why fragmented systems produce weak classification results even when the underlying data quality is good.
Recipe and Formulation Records
The exact dye combination, concentration, and liquor ratio used for each lot, along with any deviation from the standard recipe, gives the classification model the information it needs to distinguish a formulation-driven correction from a process-driven one.
Machine Process Trend Data
Temperature, dosing timing, and liquor circulation curves captured throughout the dyeing cycle reveal whether the batch actually followed its intended process window or drifted from it in a way that would explain a shade deviation independent of the recipe itself.
Raw Material Lot Traceability
Linking each dyed batch back to the specific fiber and dye lot numbers used allows the model to detect when a correction pattern correlates with a particular supplier shipment rather than anything that happened inside the factory itself.
Reactive Correction vs Root Cause Prevention
The table below contrasts how a typical reactive dye house handles shade deviation against a root cause prevention program built around continuous tracing and closed-loop verification.
| Evaluation Factor | Reactive Correction | Root Cause Prevention |
|---|---|---|
| Response to Shade Deviation | Immediate re-dyeing to fix the specific batch | Re-dyeing plus a structured trace to the originating cause |
| Pattern Visibility | Each correction reviewed in isolation | Corrections cross-referenced to detect repeating signatures |
| Ownership of the Fix | Often stays with the shift supervisor who caught it | Routed automatically to the team that owns the root cause |
| Verification | Assumed resolved once the batch passes | Monitored against future lots to confirm actual closure |
| Cost Tracking | Absorbed into general production cost | Tracked as a discrete, reportable cost category |
| Typical First-Time-Right Rate | 65 to 78 percent | 88 to 94 percent within twelve months |
What a Root Cause Program Delivers in the First Year
Dye houses that move from reactive correction to structured root cause prevention report consistent gains across cost, capacity, and shade consistency within twelve months of adoption.
Recurring root causes get closed instead of re-appearing every few weeks under a new lot number.
Capacity previously lost to correction cycles becomes available for new production without adding equipment.
Fewer second and third dyeing cycles directly reduce total chemical, water, and energy consumption per lot.
Automated classification replaces the multi-week manual investigation that many recurring issues never receive at all.
Bringing Root Cause Prevention Into an Existing Dye House
Adoption does not require pausing production or replacing existing recipe and process control systems. It starts by connecting to the data that already exists and building the trace layer on top of it.
Connect to Existing Correction Records
Historical re-dyeing logs, recipe records, and process trend data are pulled from the CMMS, dye recipe software, and machine data historian to build the initial pattern library before any new process changes are introduced.
Establish the Root Cause Baseline
The first ninety days of historical corrections are classified against the four root cause categories to produce a baseline showing exactly where the dye house's re-dyeing cost is concentrated today.
Prioritize the Highest-Cost Repeating Patterns
Rather than trying to fix every category at once, the team targets the two or three patterns responsible for the largest share of cost, since these typically represent a small number of shade codes or machines.
Deploy Closed-Loop Monitoring Going Forward
New corrections are automatically classified and cross-referenced in real time, and fixes are verified against the next relevant lot rather than assumed resolved once the immediate batch passes inspection.
Signs Your Dye House Is Carrying Hidden Re-Dyeing Cost
Before building a formal tracking program, most factories can already tell they have a problem from a handful of recurring symptoms. Recognizing these patterns is usually enough to justify starting a baseline measurement even before any new tooling is in place.
The Same Shade Code Keeps Reappearing
If a specific shade or shade family shows up repeatedly on the correction log across different weeks and different operators, that recurrence is a strong signal of an unresolved recipe or process root cause rather than a run of unrelated bad luck.
Corrections Cluster Around One Machine
When re-dyeing events concentrate disproportionately on a single dyeing machine relative to its share of total production volume, the root cause is more likely mechanical or process-related than it is a formulation issue affecting the whole plant.
Planning Always Builds in a Buffer
A production schedule that routinely pads shipment dates to absorb an expected correction cycle is quietly admitting that re-dyeing has become normalized, which usually means the true correction rate is higher than anyone has formally measured.
Nobody Can State the Correction Rate
If a plant manager cannot state the current first-time-right rate within a few percentage points from memory, that gap in visibility is itself the clearest sign that re-dyeing cost is not being managed as the discrete category it deserves to be.
Making Root Cause Prevention a Permanent Habit
The single biggest risk to a root cause prevention program is treating it as a one-time cleanup rather than a standing discipline. Factories that see the reduction hold season after season are the ones that keep classifying every new correction as it happens, rather than running one large historical analysis and letting the practice lapse once the initial backlog is cleared. That means the trace, classify, and verify sequence has to become as routine as the shade approval step itself, built into the same workflow rather than sitting as a separate report someone reviews once a month. It also means resisting the temptation to declare a root cause closed the moment the immediate fix is applied, since the real test is whether the same signature stops appearing across the following weeks of production. Dye houses that hold this discipline consistently outperform those that treat root cause analysis as an occasional audit, because every closed pattern compounds against the next one instead of resetting to zero each quarter.
Frequently Asked Questions
What counts as a re-dyeing event versus a normal shade adjustment?
A re-dyeing event is any correction cycle that requires the batch to be returned to the machine for additional dye, chemical, or process treatment after the original cycle was judged complete and measured against the shade standard. Minor top-up additions made within the original cycle, before the batch is unloaded and evaluated, are typically tracked separately as in-process adjustments rather than full re-dyeing events, since they do not carry the same machine time and reload cost. Distinguishing clearly between the two categories matters because blending them together hides the true scale of the re-dyeing cost problem. Book a demo to see how correction events are classified in your own production history.
How long does it take to see a measurable reduction in re-dyeing rate?
Most dye houses see an initial reduction within the first sixty to ninety days, driven by closing the two or three highest-cost repeating patterns identified during the baseline analysis. The full benefit typically builds over six to twelve months as recipe, process, and raw material fixes compound across the shade portfolio, and as the closed-loop verification step confirms that fixes are holding rather than temporarily suppressing the symptom. Factories with a strong existing data trail from their CMMS and process historian tend to reach measurable results faster than those starting with limited historical records. Contact support to estimate a realistic timeline for your operation.
Can root cause prevention work without a full digital recipe management system already in place?
Yes, root cause tracing can begin with the correction records and process data a factory already generates, even if recipe management is still partly manual or paper-based. The initial classification relies on whatever documentation exists for each corrected lot, and gaps in that documentation are themselves useful information, since a high rate of undocumented corrections is often its own root cause pointing toward a workflow and communication gap. Many factories use the early findings from root cause tracing as the business case for digitizing recipe management further, rather than treating full digitization as a prerequisite. Contact support to discuss what data your current systems can already provide.
How does root cause prevention handle re-dyeing caused by raw material variation outside the factory's control?
Raw material variability cannot always be eliminated at the source, since fiber and dye lot differences originate with suppliers, but the impact on re-dyeing can still be reduced significantly once the pattern is visible. When a specific supplier or fiber lot is repeatedly linked to correction events, that information supports a direct conversation with the supplier about consistency, informs incoming inspection criteria, and can trigger a small recipe adjustment margin built specifically for that material's known variability range. Over time, this turns an unpredictable variable into a documented and partially compensated one rather than a recurring surprise, and it also gives procurement teams objective evidence to weigh alongside price when deciding which suppliers to prioritize for future orders. Book a demo to see raw material correlation tracking in action.
Does reducing re-dyeing rate actually reduce the factory's water and chemical usage in a meaningful way?
Yes, and the relationship is close to direct, since a re-dyed lot repeats a large share of the water, chemical, and energy consumption of the original cycle. A factory processing a representative volume of lots with a re-dyeing rate around 15 percent is effectively paying for water, steam, and chemical charges on those lots twice, and reducing that rate by half removes a proportional share of the wasted consumption without requiring any change to the underlying dyeing process itself. This makes root cause prevention one of the more direct paths to sustainability targets that does not depend on new equipment. Book a demo to model the water and chemical savings for your production volume.
Turn Every Correction Into a Fix, Not a Repeat
iFactory Process AI traces re-dyeing events back to their true source and verifies the fix against every future lot, so the same correction never has to happen twice.