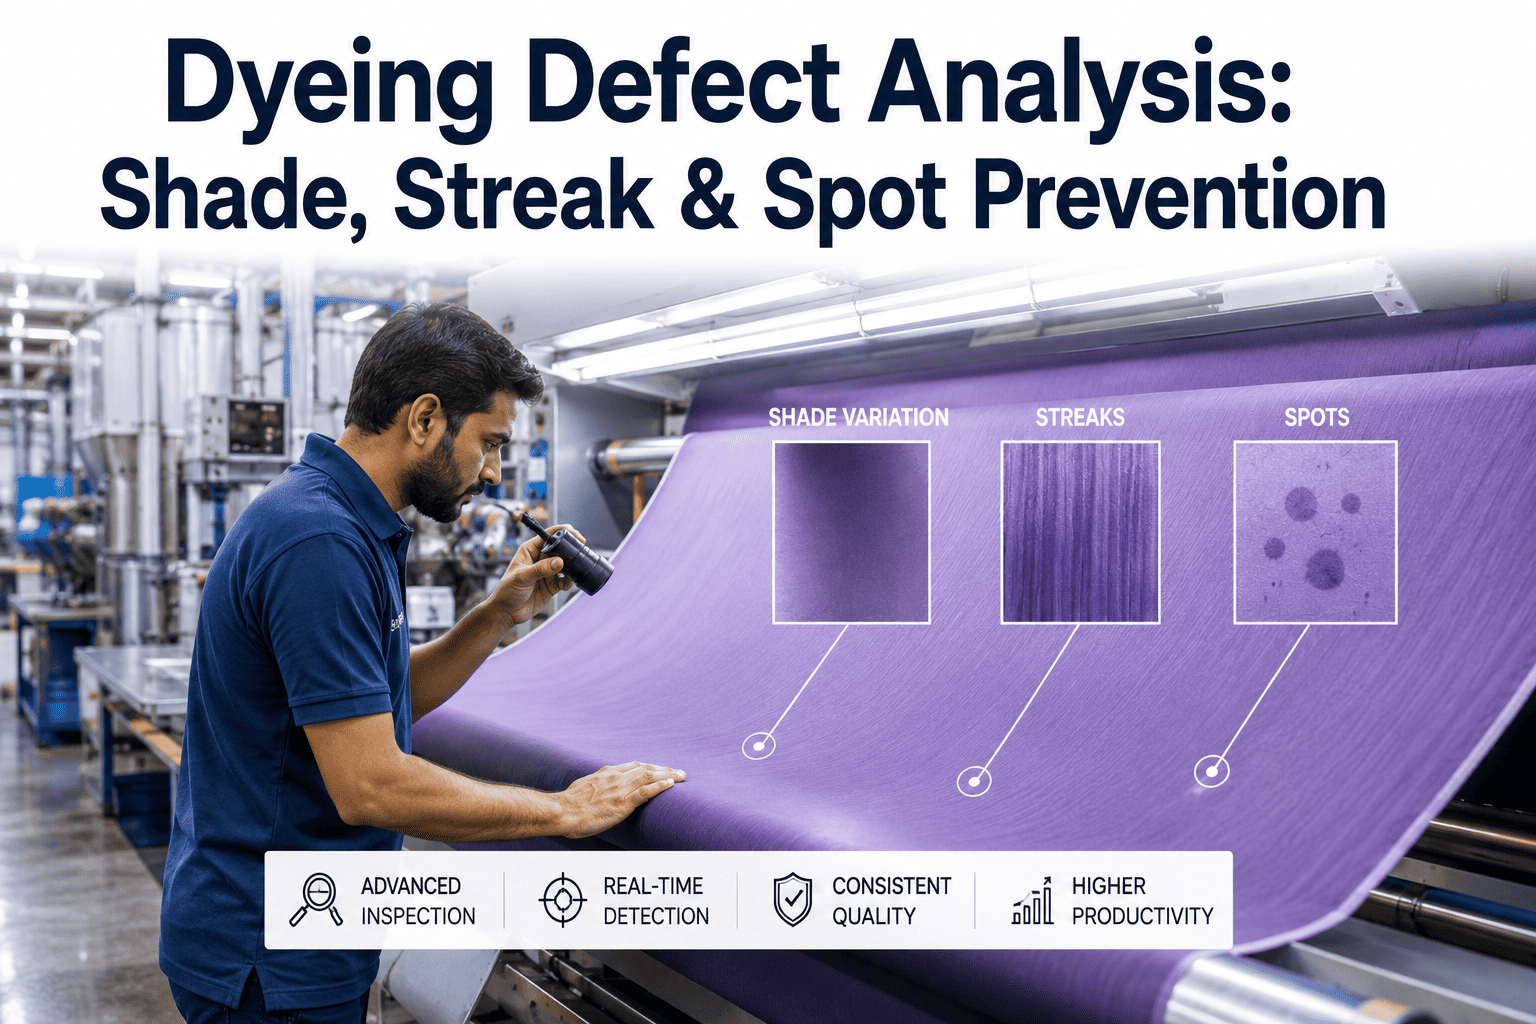
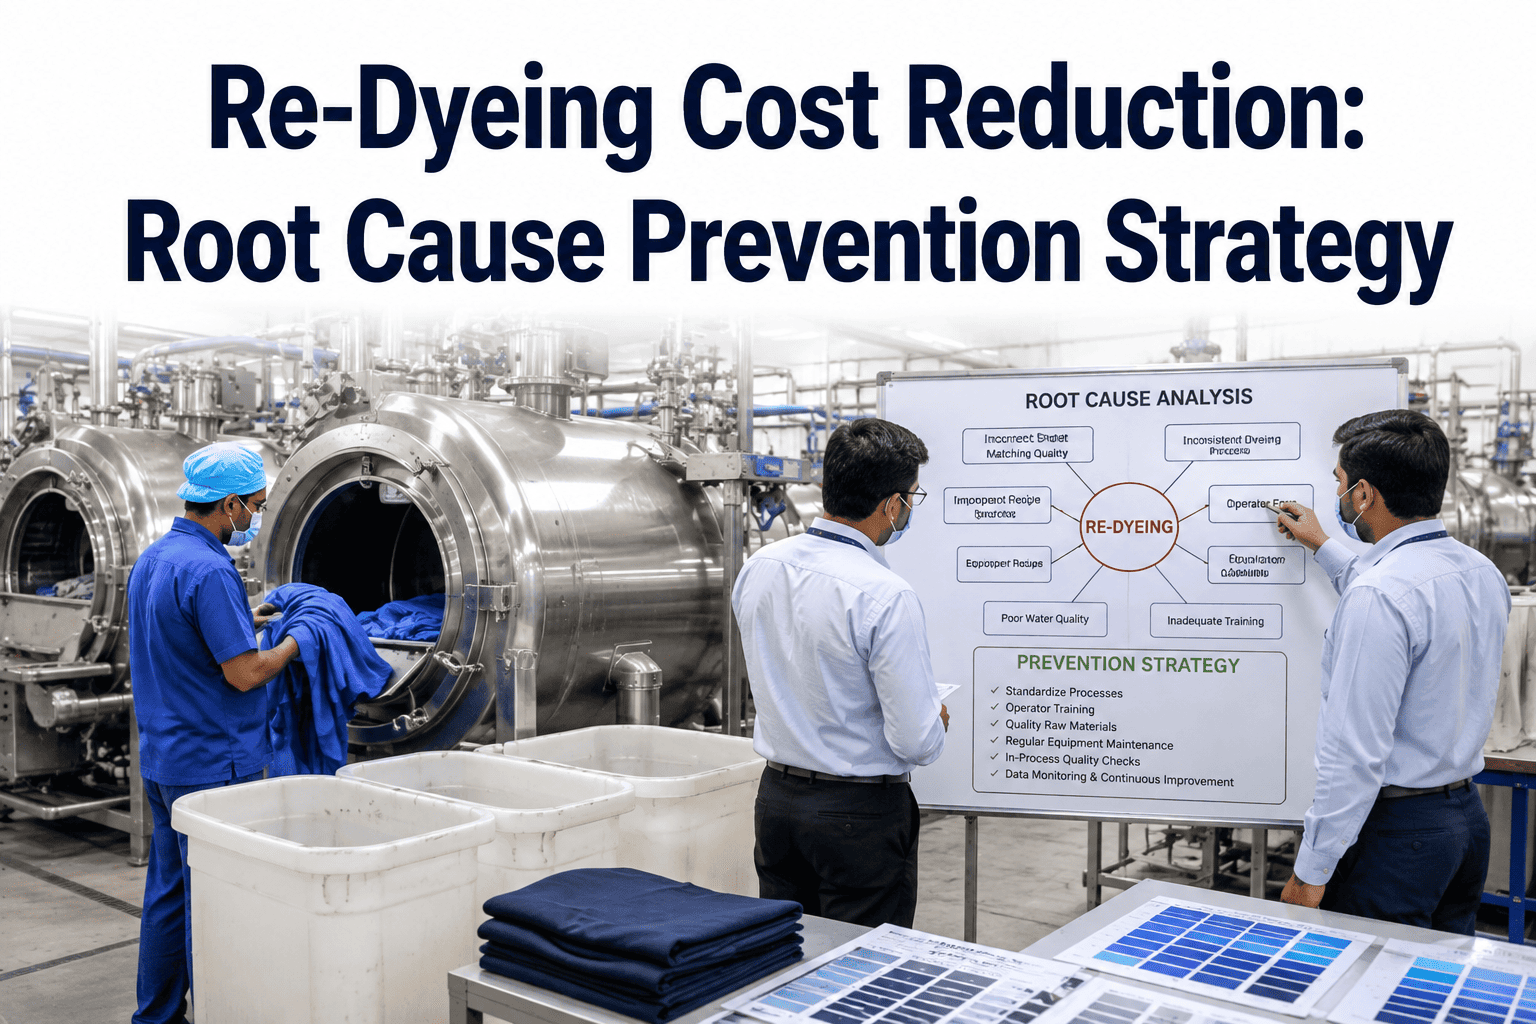
A dyehouse can run a color-matching lab that gets shade approval right on the first try and still send fabric to inspection that comes back with streaks, tailing, or patchy spots nobody predicted from the lab dip. The gap between a correct recipe and a correct roll is where most dyeing rejection actually lives, and it rarely gets closed by re-testing the recipe again, because the recipe was never the problem. Machine loading, liquor flow, temperature ramp rate, and fabric preparation before the dye even touches the goods are usually the real variables at play, and every one of them can drift quietly from batch to batch without anyone noticing until the fabric is already on the inspection table. Without a system that ties defect location back to the specific machine cycle that produced it, every investigation starts from a guess, cycles through the usual suspects, and often lands on a re-dye order instead of an actual fix, which repeats the same cost and delay the next time an identical pattern appears. iFactory logs dyeing machine parameters against the fabric roll they produced and flags the specific cycle stage most associated with shade, streak, and spot defects, and you can book a demo to see it against your own dyehouse data.
DYEING DEFECT RADAR
Four Defect Families Behind Most Dyeing Rejections
Shade Variation
Most frequent
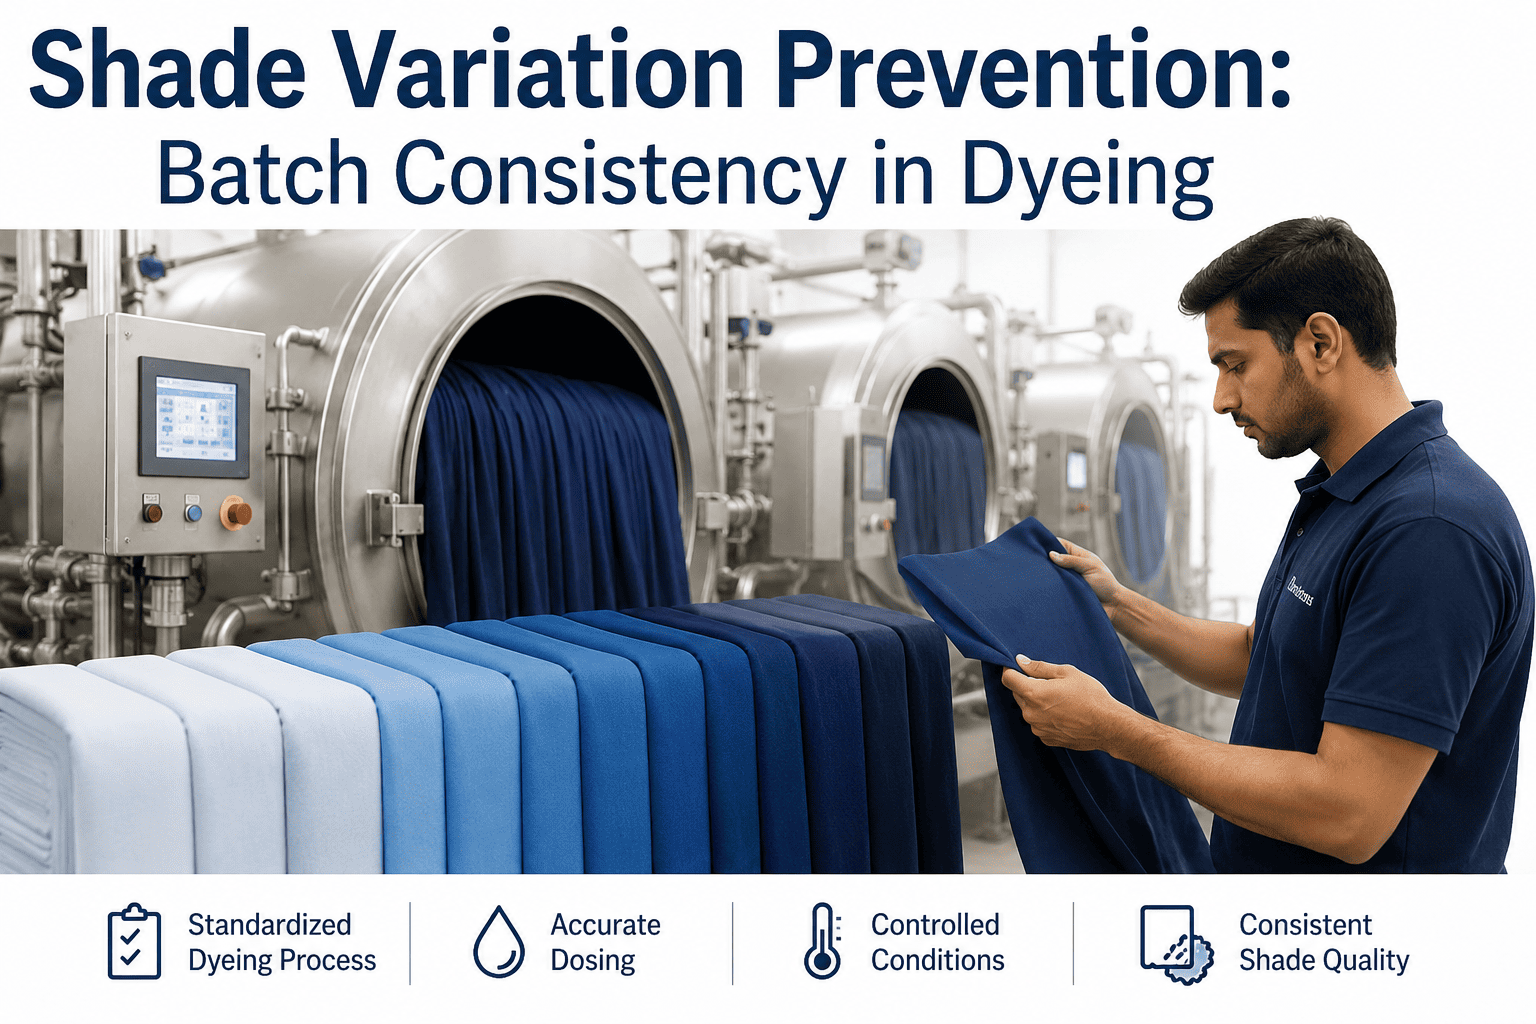
Batch-to-batch or side-to-side color mismatch against the approved standard, often within tolerance on paper but visible to a trained eye or a spectrophotometer.
Dye Streaks
Common
Linear bands of darker or lighter shade running warp-wise or weft-wise, usually traced to uneven liquor flow or fabric tension through the machine.
Spotting
Common
Localized dark or light patches caused by dye precipitation, contamination, or uneven pretreatment absorption at specific points on the fabric.
General Unevenness
Occasional
Diffuse mottled appearance across the whole piece without a clear directional pattern, often the hardest defect type to trace to a single cause.
ROOT CAUSE THINKING
Why the Same Recipe Produces Different Results Batch to Batch
A dyeing recipe defines chemistry, not process discipline, and process discipline is where variation creeps in. Two batches run on the same machine with the identical recipe can still finish differently if liquor ratio drifts, if the heating ramp overshoots on one cycle and undershoots on the next, or if the fabric was not prepared identically before it entered the machine. Because these variables are rarely logged consistently by hand, most dyehouses end up treating shade variation as a mystery to be corrected downstream with re-dyeing rather than a traceable process deviation to be prevented upstream. The technicians running the floor often develop an intuitive sense for which machine tends to run warmer or which shift tends to produce tighter shade consistency, but that intuition rarely gets written down anywhere, which means it walks out the door whenever that technician moves to a different line or leaves the company altogether.
1
Liquor ratio drift between batches changes dye concentration reaching the fabric
2
Uneven heating ramp rate causes premature or delayed dye exhaustion
3
Inconsistent pretreatment leaves variable absorbency across the fabric surface
4
Machine loading beyond rated capacity restricts liquor circulation
5
Water hardness or contamination shifts dye reactivity between lots
THE COST OF NOT TRACING THE CAUSE
Rejection Cost Compounds Long Before It Shows Up on a Report
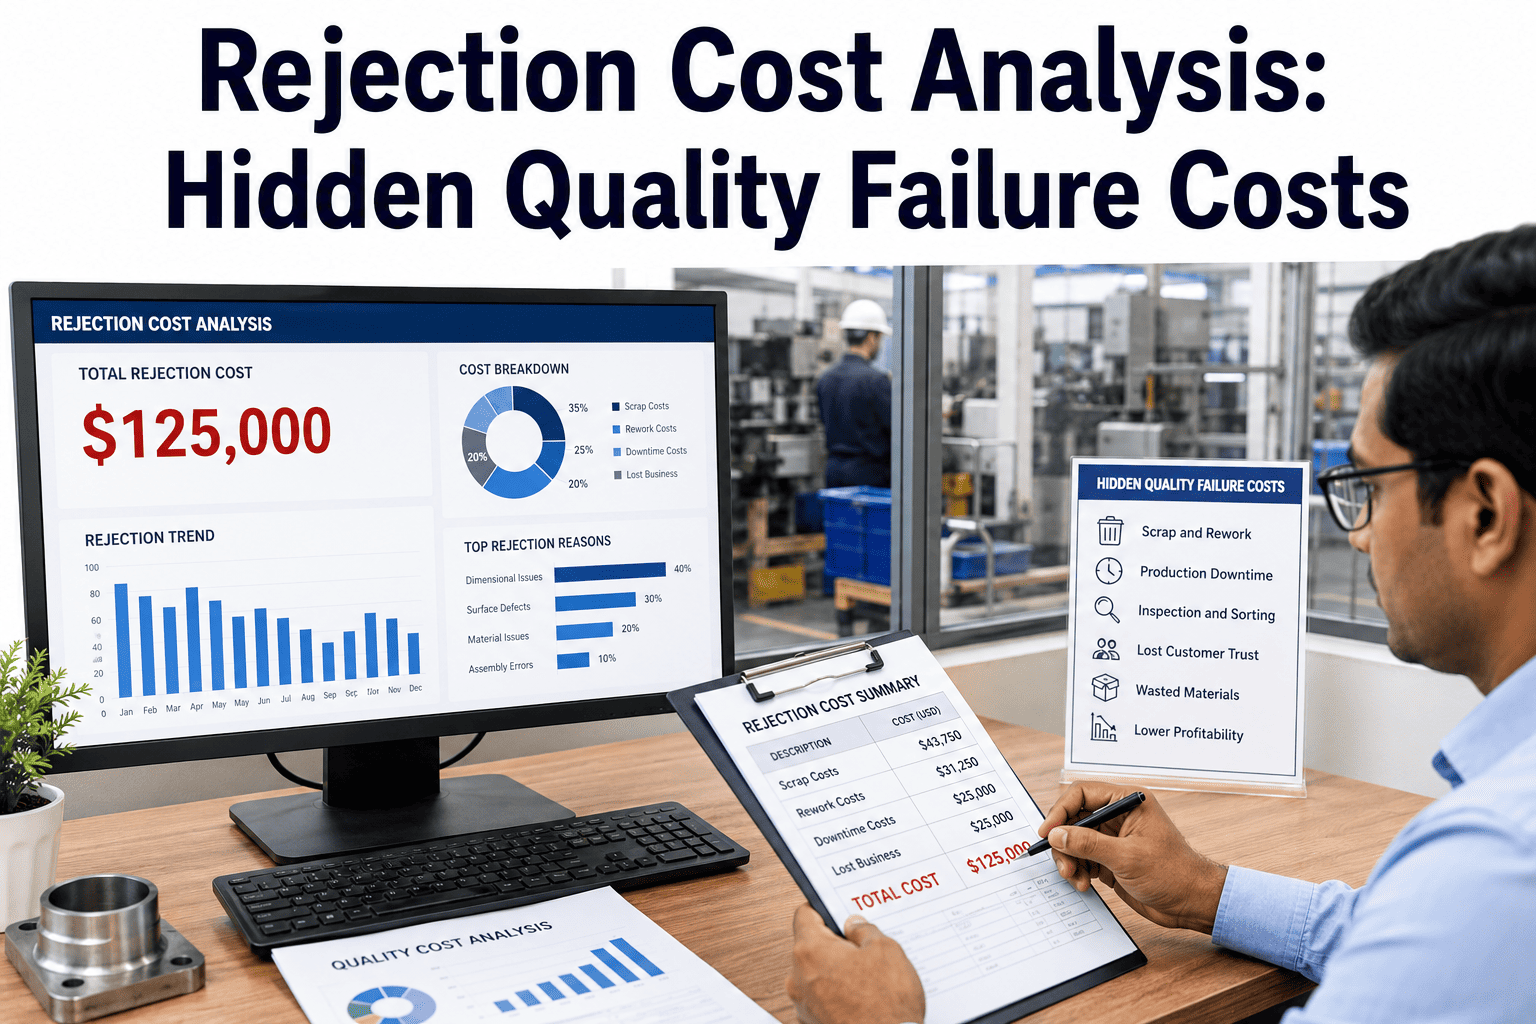
Every roll that fails shade approval and gets sent for re-dyeing or downgraded to a lower quality tier consumes water, energy, chemicals, and machine time a second time, on top of whatever margin was already committed at the original sale price. When the same defect keeps recurring because the root cause was never confirmed, that cost does not show up once, it shows up on a recurring basis, quietly eroding a margin line that looks fine on a monthly summary until someone finally adds up how often re-dyeing is happening.
2-5%
Typical share of total dyed output that requires re-dyeing or downgrading in operations without process-level defect tracing
2x
Approximate water, energy, and chemical cost of a re-dye cycle compared to getting the shade right the first time
Weeks
Typical time a recurring defect pattern persists before an informal, memory-based investigation actually confirms its cause
None of these figures require a defect to be dramatic to matter. A shade variation that stays within a customer's stated tolerance can still trigger a downgrade to second quality if it falls near the edge of that tolerance inconsistently across a roll, which is exactly the kind of borderline case that a documented cycle-to-defect record resolves far faster than a visual re-inspection argument between departments. These borderline cases are also where disputes with buyers tend to be most contentious, because both sides are often working from a subjective visual judgment rather than a shared, timestamped record of what the fabric actually looked like and what conditions produced it. A dyehouse that can produce cycle data alongside an inspection photo is in a materially stronger position during that conversation than one relying on memory and goodwill. You can contact our support team to walk through how rejection cost is typically calculated for a dyehouse of your size.
Trace Every Defect Back to the Cycle That Caused It
iFactory correlates machine parameter logs with inspected fabric rolls so a shade or streak defect can be traced to the specific temperature, flow, or timing deviation that produced it.
STREAK AND SPOT DEEP DIVE
Reading the Pattern Tells You Where to Look
Experienced dyehouse technicians already use defect pattern as a diagnostic clue, and formalizing that pattern-to-cause mapping into a consistent system makes the diagnosis less dependent on any one person's memory being available on a given shift. Treating pattern recognition as a documented reference rather than tribal knowledge also shortens training time for newer inspection staff, who can otherwise take months to build the same intuitive read on what a given streak or spot pattern is usually trying to tell them about the machine that produced it.
Warp-Wise Streaks
Running the length of the fabric, these usually point to uneven fabric tension or a guide roller issue that repeats consistently through the machine cycle.
Weft-Wise Streaks
Running across the fabric width, these more often trace to uneven liquor flow distribution or a nozzle or jet blockage on one side of the machine.
Random Spotting
Scattered with no clear pattern, spotting frequently traces to contamination in the liquor, undissolved dye particles, or foreign material on the fabric before dyeing.
Edge-to-Center Fade
Gradual shade change from selvedge to center typically indicates a circulation dead zone in the machine that the standard liquor path is not reaching evenly, and it tends to worsen as machine loading approaches the upper end of rated capacity.
A REPEATABLE INVESTIGATION SEQUENCE
Five Steps From Defect Report to Confirmed Fix
01
Log the Defect With Location Detail
Record where on the roll the defect appears, its pattern, and the machine cycle and lot it came from at the point of inspection.
02
Pull the Matching Cycle Data
Retrieve temperature, liquor ratio, flow rate, and timing data for the exact cycle that produced the flagged roll, down to the minute-by-minute profile if the equipment supports it.
03
Compare Against a Clean Reference Cycle
Overlay the flagged cycle against a recent defect-free cycle on the same machine and recipe to isolate what actually differed.
04
Test the Suspected Variable
Adjust the single most likely variable identified in the comparison and run a controlled batch to confirm the defect clears.
05
Lock the Corrected Parameter as Standard
Update the standard operating parameter and continue monitoring future cycles against it to confirm the fix holds.
CORRECTIVE ACTION REFERENCE
Matching Defect Type to the Right First Corrective Step
WHO BENEFITS MOST
Built for Teams Chasing Shade Consistency at Scale
Dyehouse Quality Teams
Get a documented trail linking every rejected roll back to the process parameters that produced it, rather than a shrug and a re-dye order.
Process and Machine Operators
See which cycle parameters correlate most with defect-free output so standard settings reflect proven performance instead of habit or tradition passed down between shifts.
Plant Managers Tracking Rejection Cost
Watch shade-related rejection rates trend over time by machine, shift, and recipe to prioritize where corrective investment pays back fastest.
Merchandising and Customer-Facing Teams
Point to a documented root-cause history when a customer questions a shade rejection, replacing a subjective back-and-forth with a data-backed explanation and corrective action plan.
FREQUENTLY ASKED QUESTIONS
Common Questions From Dyehouse and Quality Teams
Can this work alongside our existing spectrophotometer shade approval process?
Yes, spectrophotometer readings remain the standard for shade pass or fail decisions, and the platform sits alongside that process by linking each reading back to the machine cycle data for the batch it came from. This turns a pass or fail number into a traceable record that shows which process conditions produced an approved shade versus a rejected one, which is the missing link most dyehouses do not currently have.
Book a demo to see how it connects with your current shade approval workflow.
Do we need to replace our dyeing machine controllers to capture this cycle data?
Most modern dyeing machine controllers already log temperature, flow, and timing data internally, so the more common starting point is connecting to that existing data rather than replacing controllers outright. Where a machine genuinely lacks logging capability, targeted sensor additions can close specific gaps without requiring a full controller upgrade across the dyehouse.
Contact our support team to review what your current machine controllers already capture.
How quickly can a recurring streak or spotting pattern actually be traced to its cause?
Once cycle data and defect location data are both being captured consistently, a recurring pattern across several batches on the same machine usually surfaces within days rather than the weeks a manual investigation would typically take. The speed depends on how consistently the defect is logged with location and pattern detail at the point of inspection, so tightening that logging habit is often the fastest way to shorten investigation time.
Book a demo to see how pattern correlation works against a sample defect history.
Does this help with recipe standardization across multiple dyehouse locations?
Yes, when the same recipe is run across multiple machines or sites, comparing cycle data and defect rates side by side highlights where one location is consistently outperforming another on the identical recipe, which usually points to a process discipline gap rather than a chemistry problem. That comparison is one of the more common reasons multi-site dyehouse operations adopt this kind of tracking in the first place.
Contact our support team to discuss multi-location recipe comparison.
Can we track corrective actions to confirm a fix actually holds over time?
Corrective actions can be logged against the specific defect and cause they addressed, and subsequent cycles on the same machine and recipe continue to be monitored so a fix that only holds for a few batches before the defect returns gets flagged rather than assumed permanent. This closes the loop that a one-time investigation typically leaves open.
Book a demo to see corrective action tracking in practice.
Stop Guessing Why Shade and Streak Defects Keep Recurring
iFactory ties every inspected roll back to the exact dyeing cycle that produced it, so root cause investigation starts with data instead of a hunch. Book a demo and bring a recent batch of defect reports.