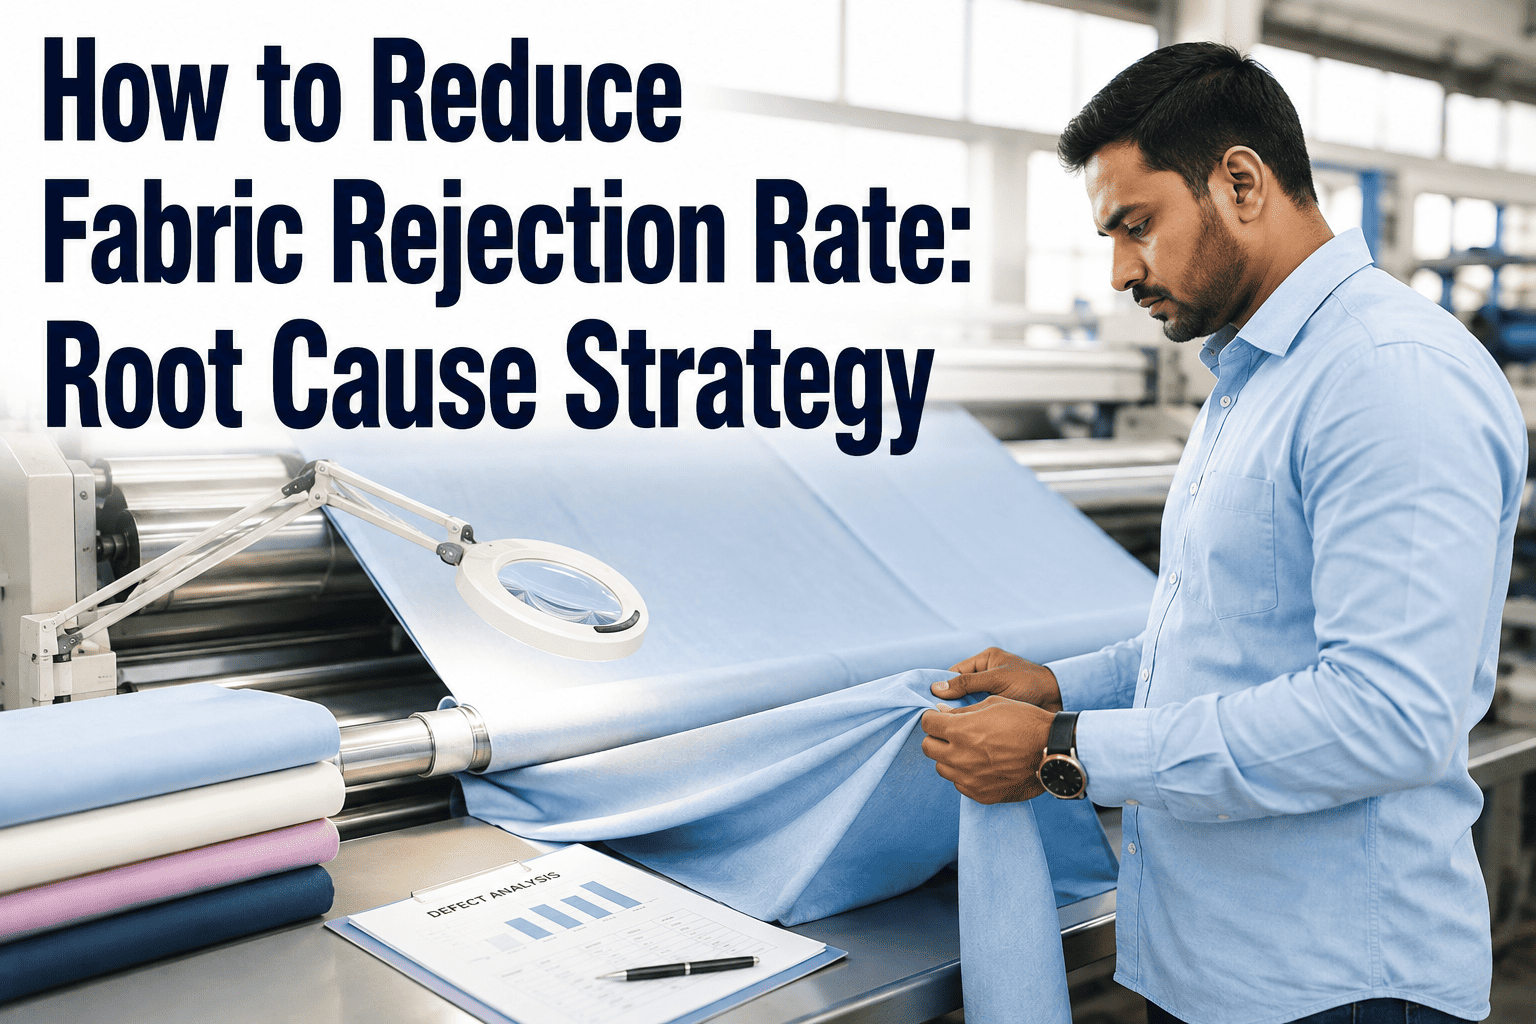
How to Reduce Fabric Rejection Rate: Root Cause Strategy
By James Smith on August 6, 2026
A knit fabric mill running a structured six-sigma root cause program found that yarn quality alone accounted for 51% of all recorded defects — more than every other cause combined. A separate weaving defect study traced roughly 86% of fabric faults back to improper weaving process parameters, not raw material. These aren't isolated findings; they're representative of a pattern that shows up whenever a mill actually runs the analysis instead of assuming defects are evenly distributed across dozens of possible causes. Reducing fabric rejection by 30 to 50% is realistic — but only once the analysis identifies which small number of causes is actually driving most of the losses, rather than launching improvement efforts against causes that only account for a few percentage points each. Most quality teams already know this in principle; the gap is almost always in the discipline of actually logging defect type consistently enough to run the analysis. See how iFactory correlates fabric defects back to specific process parameters automatically, across weaving, knitting, and dyeing.
Textile · Fabric Rejection · Root Cause Strategy
How to Reduce Fabric Rejection Rate: Root Cause Strategy
Defect Pareto analysis, process correlation, and targeted corrective action across weaving, knitting, and dyeing — the systematic method behind documented 30 to 50% rejection rate reductions.
Inspecting Harder Doesn't Reduce Rejection — Finding the Cause Does
The default response to a high rejection rate is usually more inspection: more checkpoints, more inspectors, tighter tolerances at final review. This catches defective fabric before it ships, which matters, but it does nothing to reduce how much defective fabric gets produced in the first place. Inspection sorts good from bad after the fact. Root cause analysis is what actually lowers the rejection rate, because it identifies and corrects whatever is generating the defects upstream.
This distinction explains why some mills invest heavily in inspection infrastructure for years without their rejection rate meaningfully improving — they've gotten very good at catching problems, not at preventing them. The documented case studies with genuine 30 to 50% rejection reductions consistently followed a different pattern: identify the two or three defect categories responsible for most of the loss, trace each back to a specific process parameter, and correct that parameter directly. None of these documented improvements came from tightening inspection standards alone.
The Pareto-First Method
A Small Number of Causes Drive Most of the Rejection
Pareto analysis — ranking defect categories by frequency and looking at where the cumulative percentage concentrates — is the standard first step in every documented fabric rejection reduction case, and for good reason. It converts "we have a rejection problem" into "these two specific defect types account for 60% of our losses," which is an actionable target instead of a vague one. The chart below shows exactly this pattern using a published six-category defect breakdown from a real knit-dye textile facility.
Notice the cumulative line in this chart — it climbs steeply across the first three categories and then flattens noticeably across the remaining three. That shape is the visual signature of a genuine Pareto pattern, and it's exactly what shows up in most real fabric defect datasets: the first handful of categories do most of the work, and everything after that contributes progressively less. A mill spreading equal improvement effort across all six categories in this example would be putting roughly the same resources against a defect responsible for 5.6% of losses as against one responsible for 32.7% — a genuinely inefficient allocation once the actual distribution is visible.
Most Mills Never Run This Analysis
One Documented Case Traced 86% of Weaving Defects to a Single Process Category
iFactory automatically ranks defect categories by frequency and correlates them against process parameters — so the Pareto analysis runs continuously, not as a one-time study.
Documented case studies point toward a different dominant cause category at each production stage, which is a useful starting hypothesis for where to focus the first Pareto analysis — though it should be treated as a hypothesis to confirm, not an assumption to act on directly.
Stage
Commonly Dominant Cause Category
Where to Correlate
Weaving
Improper weaving process parameters — documented as high as 86% of defects in one case study
Fabric handling and tension during downstream processing
Tension meter readings, feeder rate consistency, hardware condition
These are starting points based on commonly documented patterns, not universal rules — every mill's actual dominant cause needs to be confirmed with its own Pareto analysis rather than assumed from someone else's case study, since process setups, material sources, and equipment condition all vary.
The DMAIC Sequence
Applying the Standard Methodology to Fabric Rejection
DMAIC — Define, Measure, Analyze, Improve, Control — is the standard Six Sigma structure underlying nearly every documented fabric rejection case study, and each phase depends on the one before it being done properly.
Define
Set the Specific Rejection Problem and Target
State the current rejection rate, the specific product or line it applies to, and a realistic improvement target — a vague goal like "reduce defects" doesn't focus the analysis the way "reduce hole defects on Line 3 by 40%" does.
Measure
Collect Defect Data Systematically, Not Anecdotally
Build a check sheet or automated log capturing every rejected unit's defect type, location, shift, and machine — the Pareto analysis in the next phase is only as good as the consistency of this data collection.
Analyze
Rank by Pareto, Then Trace With Cause-and-Effect Analysis
Identify the top one or two defect categories by frequency, then use a fishbone or cause-and-effect diagram specifically on those categories to trace the defect back to a process parameter, material source, or equipment condition.
Improve
Correct the Specific Parameter, Not the General Process
Apply a targeted correction to the identified root cause — a tension setting, a yarn lot specification, a temperature control point — rather than a broad process overhaul that touches everything and isolates nothing.
Control
Monitor to Confirm the Gain Holds
Continue tracking the corrected defect category after the fix to confirm the improvement is durable, not a temporary dip — and rerun the Pareto analysis periodically, since fixing the top cause typically promotes a previously smaller category into the new top position.
Getting Started
Building a Root-Cause-Driven Rejection Program
These four steps are the practical starting discipline, addressing the specific gaps that most commonly prevent a mill from running a genuine Pareto analysis in the first place.
01
Log Every Rejection With Defect Type, Not Just a Pass/Fail Count
A rejection rate number alone gives no direction for improvement — the specific defect type is what a Pareto analysis actually needs, so defect-type logging needs to be mandatory, not optional, from the first rejected unit forward.
02
Run the Pareto Analysis Before Assigning Improvement Resources
Resist the instinct to fix whatever defect is most visible or most recently complained about — confirm it's actually a top Pareto category first, since visibility and frequency are frequently not the same thing.
03
Correlate the Top Defect Against Process Parameters, Not Just Shift or Operator
Tension settings, yarn lot, temperature, and machine-specific variables are frequently the actual root cause — correlating defects only against shift or operator tends to produce blame rather than a fixable process variable.
04
Rerun the Analysis After Each Correction
Fixing the top defect category typically reveals a new top category that was previously masked — a root-cause program is a repeating cycle, not a single project with a defined end date.
Field Perspective
“
Every mill I've worked with that struggled to move their rejection rate had the same gap: they were tracking rejection rate as one number, but not tracking defect type consistently enough to actually run a Pareto analysis. Once we started logging defect type properly, the pattern was almost always the same story — two or three categories responsible for the majority of loss, and none of them were what the quality team had assumed going in. The assumption was usually operator error. The data usually pointed at a specific machine setting or a specific yarn lot supplier instead. You cannot fix what you haven't actually identified, and most mills are trying to fix a guess — often a reasonable-sounding guess, but a guess nonetheless.
Ingrid Osei-Castellanos
Textile Quality Manager · 18 years in fabric quality systems across weaving, knitting, and dyeing operations
Common Questions
Frequently Asked Questions
Is a 30 to 50% fabric rejection rate reduction actually realistic, or is that an optimistic figure?
Documented case studies support this range as achievable, though results vary by starting point and how rigorously the root cause methodology is applied — one published knit garment study documented a rejection rate reduction from 9.14% to 6.4% within four months using structured TQM and Pareto analysis, while a separate denim fabric case documented the good-product rate rising from 88.44% to 96.26%. These aren't universal guarantees, but they demonstrate the range is grounded in actual published results rather than marketing exaggeration, provided the underlying methodology — consistent defect logging, genuine Pareto ranking, and targeted correction of the identified root cause — is actually followed rather than skipped in favor of a general process overhaul. Book a rejection analysis review to assess a realistic target for your specific starting rejection rate.
Why does increasing inspection frequency fail to reduce the overall rejection rate?
Inspection identifies and sorts out defective fabric that has already been produced — it improves what ships to the customer, but does nothing to reduce how much defective fabric the process generates in the first place. A mill can add inspectors and tighten checkpoints indefinitely and still see the same underlying defect generation rate, because the actual cause of the defects — a process parameter, a material issue, an equipment condition — was never identified or corrected. Root cause analysis targets the generation of defects directly, which is the only approach that actually moves the rejection rate rather than just catching more of what's already being produced.
How do you know which defect category to focus on first when a mill has many different defect types?
A Pareto analysis — ranking every logged defect type by frequency and looking at where the cumulative percentage concentrates — is the standard way to answer this, and documented case studies consistently show a small number of categories accounting for the majority of total defects rather than losses being evenly spread across many types. One documented case found 32.7% of all rejected fabric attributable to a single defect category, with the top three categories together accounting for well over half of total losses — focusing improvement resources on that handful of categories delivers far more impact than spreading effort evenly across every defect type observed. Talk to solutions engineering about automating defect-type logging and Pareto ranking across your production lines.
What's the difference between a Pareto chart and a cause-and-effect (fishbone) diagram in root cause analysis?
A Pareto chart answers "which defect categories matter most" by ranking them by frequency — it tells you where to focus, not why the defect is happening. A cause-and-effect or fishbone diagram is applied after the Pareto analysis identifies a priority defect category, and it systematically traces that specific defect back to potential root causes across categories like machine, material, method, and manpower. Using them together — Pareto to prioritize, cause-and-effect to diagnose — is the standard sequence in documented textile defect reduction case studies, and skipping either step tends to produce either unfocused effort or effort focused on the wrong category.
How often should a mill rerun its defect Pareto analysis once an improvement program is underway?
Rerunning the analysis after each significant correction is standard practice, since fixing the current top defect category frequently promotes a previously smaller category into the new leading position — a root cause program that treats the Pareto analysis as a one-time study rather than a recurring check will plateau once the first correction is made, missing the next priority category entirely. Many mills settle into a regular cadence, such as monthly or quarterly, for a full re-ranking, with more frequent informal checks during an active improvement push on a specific defect category.
Find the Cause, Not Just the Symptom
Automated Defect Pareto and Process Correlation, Running Continuously
iFactory logs defect type at the point of rejection, ranks categories automatically, and correlates the top causes against process parameters across weaving, knitting, and dyeing — so root cause analysis runs continuously, not as an occasional study.