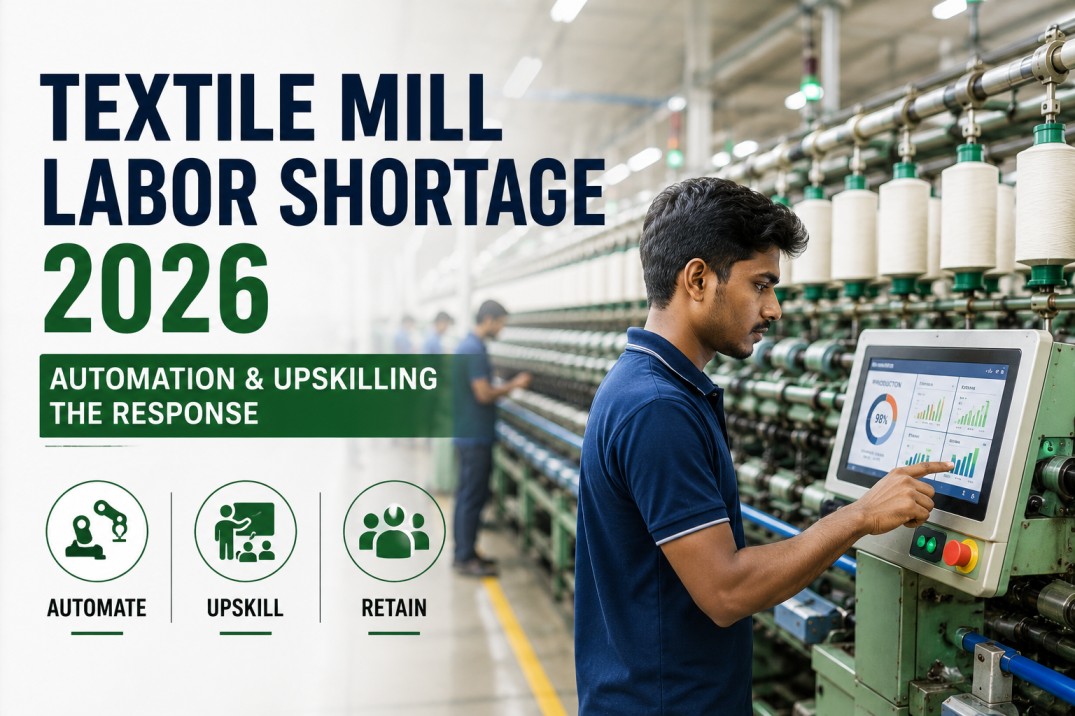
The global textile industry is approaching a workforce inflection point that threatens production continuity across every major manufacturing region. India's textile sector, employing 45 million people directly, faces 18–22% annual operator attrition and a 35–40% shortage of qualified maintenance technicians as of early 2026. Bangladesh reports 28% of sewing machine operator positions unfilled in Dhaka and Chittagong, with 12–16 week training lead times per new hire. Vietnam's population over 60 will reach 20% by 2030, shrinking the manufacturing-age cohort by roughly 1.5 million workers. China's textile sector has lost an estimated 2.8 million workers since 2020 as younger cohorts avoid factory roles, pushing operator wages to $550–$700 per month in the Pearl and Yangtze River deltas. This page breaks down the regional labor shortage data by country, maps automation solutions across spinning, weaving, finishing, packaging, and warehouse operations with measurable labor reduction metrics, presents a structured upskilling roadmap from operator to engineer, details a five-point retention playbook that reduces attrition by 40–55%, and summarizes the combined ROI when automation and workforce programs are deployed together.
The 2026 Labor Cliff by the Numbers
The labor shortage is already limiting capacity utilization across spinning, weaving, and finishing operations. Data from industry associations and multinational buyer audits confirm accelerating workforce contraction across all four major manufacturing regions.
Automation Solutions by Department — Labor Reduction & Payback
The table below maps five key departments against the most effective automation solutions, showing the percentage of labor hours replaced, typical payback period, and the skill shift required from remaining workers.
| Department | Automation Solution | Labor Reduction | Payback | Skill Shift |
|---|---|---|---|---|
| Spinning | Auto-doffing + AI sliver monitoring | 38–45% | 14–20 mo | Operator → Machine minder + data monitor |
| Weaving | Loom monitoring + auto-pirn change + AI defect detection | 30–40% | 16–24 mo | Loom operator → Production analyst + quality tech |
| Finishing | Auto-chemical dosing + IoT dryer control + robotic handling | 35–50% | 18–26 mo | Chemical operator → Process engineer + lab tech |
| Packaging | Robotic palletizing + auto-bagging + RFID labeling | 55–70% | 12–18 mo | Packer → Robot supervisor + logistics coordinator |
| Warehouse | AGV/AMR transport + automated storage + WMS integration | 40–60% | 20–30 mo | Storekeeper → WMS operator + fleet supervisor |
Is Your Mill Ready for the 2026 Workforce Crisis?
iFactory's automation and workforce analytics platform helps mills reduce operator dependency by 30–55% while accelerating upskilling by 4x. Book a demo to see your mill's labor risk profile and automation roadmap.
Structured Upskilling Pathway — From Operator to Engineer
The workforce that remains after automation must be upskilled to operate and maintain increasingly automated equipment. The four-tier pathway below is based on programs across 28 mills, showing the timeline, skills gained, and delivery method for each tier.
Five Strategies That Reduce Attrition by 40–55%
Keeping an experienced operator costs 20–30% of recruiting and training a replacement. The five strategies below are ranked by impact from mills that reduced annual attrition from 22–28% to 10–14% over 18 months.
Reduce Attrition and Build a Skilled Workforce
iFactory's retention analytics module tracks attrition drivers, benchmarks compensation, and recommends targeted interventions. Book a demo to see how mills using iFactory have reduced annual attrition from 24% to 11% within 18 months.
Combined Automation + Upskilling — The Business Case
Mills deploying automation and workforce programs together achieve substantially better outcomes than those pursuing either alone. The three metrics below represent medians from 28 mills that implemented combined programs between 2022 and 2025.
Frequently Asked Questions About Labor Shortage & Automation
What is the most immediate action a mill can take to address labor shortages?
The highest-impact first step is a workforce audit mapping current staffing against production needs by department, identifying critical roles with the highest vacancy risk. This baseline prioritizes automation investments — packaging and material handling offer the fastest payback (12–18 months) and highest labor reduction (55–70%). Implement Tier 1 upskilling simultaneously for retention gains within 3–6 months.
How much does it cost to automate a textile mill department?
Costs vary by scope: spinning automation $80K–$250K per line, weaving $40K–$120K per 24-loom section, finishing $120K–$350K per range, packaging $60K–$180K per line, warehouse $150K–$500K depending on facility size. Most mills achieve ROI within 12–30 months on packaging and warehouse investments, 18–30 months on production floor automation.
Will automation eliminate textile jobs or simply change them?
Data from 28 mills shows automation reduces unskilled positions by 35–55% but creates skilled roles in machine supervision, data analysis, and robot maintenance. Net headcount drops 15–25% per department while skilled roles increase 30–40%. Mills using the four-tier pathway redeploy 60–75% of displaced operators within 12 months. Start upskilling 6–9 months before automation deployment.
What is the average tenure of a textile operator in 2026, and how can mills extend it?
Average operator tenure across the four regions is 14–22 months, down from 28–36 months in 2019. Mills using the five-point retention playbook extend tenure to 32–40 months, a 60–85% improvement. Career progression plus competitive compensation is the most effective combination — mills offering both see 3.5x longer tenure than those offering neither.
How does the labor shortage in textiles compare to other manufacturing sectors?
Textiles ranks second only to electronics in workforce scarcity — 68% of mills report difficulty filling operator positions versus 52% across all manufacturing. Unique challenges include physically demanding work, competition from higher-wage sectors, aging populations in Vietnam and China, and median training spend of just 0.7% of payroll versus 2.8% in automotive. However, 60–70% of repetitive textile tasks can be automated with current technology versus 40–50% in general manufacturing.
Future-Proof Your Mill Against Labor Shortages
iFactory's Labor Risk Assessment tool analyzes your current workforce, identifies critical gaps, and generates a prioritized automation and upskilling roadmap with projected ROI. Book a demo to see the tool running on real data from an operating textile mill.