Zero incidents is not a slogan — it is a measurable target that the best-performing textile mills achieve through systematic safety culture development rather than compliance-driven enforcement. The difference between mills with incident rates of 2.5+ per 200,000 hours and mills operating at 0.3 or below is not the sophistication of their safety equipment but the depth of their safety culture: how hazards are reported, how leaders respond to near misses, how employees are empowered to stop unsafe work, and how continuous improvement is embedded in daily operations rather than reserved for monthly safety committee meetings. Data from the Textile Safety Excellence Network shows that mills with mature safety cultures — defined by leading indicator scores above 80% across five cultural pillars — experience 74% fewer recordable incidents, 68% fewer lost-time injuries, and 52% lower workers' compensation premiums compared to mills relying solely on regulatory compliance programs. Building that culture takes 18–36 months of sustained effort, but the return on investment in safety culture development is 4:1 to 7:1 within three years when direct and indirect incident costs are included. This page defines the five pillars of zero-incident safety culture with specific behaviors and metrics, presents a four-stage safety maturity model that helps mill leadership assess their current culture level and identify the highest-leverage improvement actions, maps a near-miss reporting and analysis workflow that transforms reactive data into proactive prevention, provides a comparison of leading and lagging safety indicators with target values for textile mills, and details a 90-day safety culture kickstart plan that any mill can implement starting next Monday.
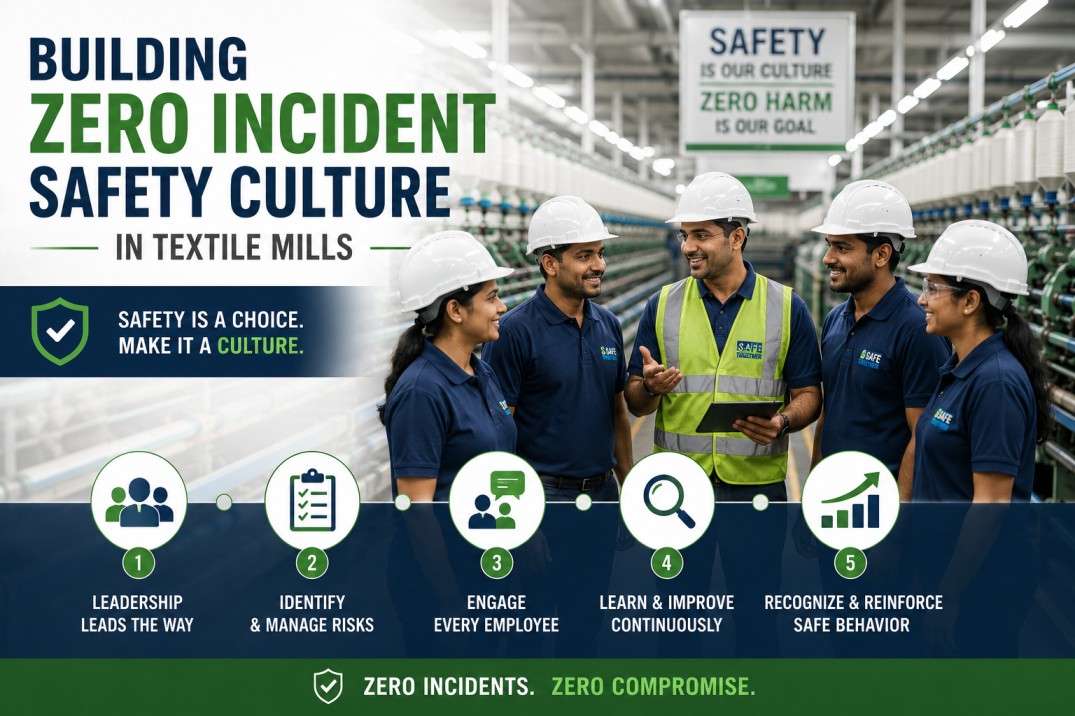
The Five Pillars of Zero-Incident Safety Culture
Safety culture is not a single program — it is the collective result of five interconnected organizational pillars. Each pillar must be developed and maintained for the culture to sustain itself. The metrics shown are targets based on top-quartile textile mills in the Safety Excellence Network.
Four-Stage Safety Culture Maturity Model
Most textile mills operate at the Compliant or Proactive levels — they meet regulatory requirements and may have pockets of good practice, but lack the systematic culture that drives zero incidents. The four-stage model below helps leadership assess current maturity and identify the specific actions needed to advance to the next level.
Where Does Your Mill's Safety Culture Stand Today?
iFactory's safety culture module includes a maturity assessment tool, leading indicator dashboards, near-miss tracking with photo reporting, and automated corrective action follow-up. Book a demo to see your mill's safety culture score across all five pillars.
Near-Miss Reporting Workflow — From Observation to Prevention
The single strongest predictor of a mature safety culture is the near-miss reporting ratio — the number of near-miss reports submitted relative to recordable incidents. Mills at the Zero Incident level maintain ratios of 20:1 or higher, meaning 20 near misses are reported and analyzed for every recordable injury. The workflow below transforms raw observations into systemic prevention.
Leading vs Lagging Safety Indicators — Target Values for Textile Mills
Lagging indicators tell you what has already happened. Leading indicators tell you whether your safety culture is strong enough to prevent future incidents. The table below shows both types with target values based on top-quartile textile mill performance.
| Indicator Type | Metric | Formula | Target |
|---|---|---|---|
| Leading | Hazard identification rate | Hazards reported ÷ employee-hours × 100 | 12+ per 100 hrs |
| Near-miss reporting ratio | Near-miss reports ÷ recordable incidents | 20:1 or higher | |
| Safety observation completion | Completed observations ÷ scheduled observations | 90%+ | |
| Corrective action closure rate | Actions closed on time ÷ total actions × 100 | 95%+ within 30 days | |
| Lagging | Total recordable incident rate | Recordable incidents × 200,000 ÷ employee-hours | Below 0.5 |
| Lost-time injury rate | Lost-time injuries × 200,000 ÷ employee-hours | Below 0.2 | |
| Days away from work | Total lost days ÷ number of lost-time injuries | Below 10 | |
| Workers' comp premium ratio | Premium as % of payroll | Below 2.5% |
Know Your Safety Culture Score — Measure What Matters
iFactory's safety analytics platform calculates your mill's leading indicator scores across all five pillars, benchmarks against industry peers, and generates a prioritized improvement roadmap. Book a demo to see the culture assessment dashboard.
90-Day Safety Culture Kickstart Plan
Building a zero-incident culture takes 18–36 months, but the foundation can be laid in 90 days. The plan below focuses on the highest-leverage actions that create visible momentum and generate early wins — essential for building leadership and employee buy-in for the longer journey.
Frequently Asked Questions About Safety Culture in Textile Mills
How long does it take to build a zero-incident safety culture in a textile mill?
The Safety Excellence Network data shows that mills moving from Level 2 (Compliant) to Level 4 (Zero Incident) typically require 18–36 months of sustained, focused effort. The first 90 days establish the foundation and generate early wins. Months 4–12 build momentum as leading indicators improve and near-miss reporting becomes embedded. Months 13–24 see incident rates drop significantly as proactive hazard identification prevents injuries. Months 25–36 achieve the cultural maturity where safety behaviors are automatic and self-sustaining. The speed of progression depends primarily on leadership commitment — mills where the plant manager personally leads the culture change advance twice as fast as those delegating it to the EHS manager alone.
What is the single most important action leadership can take to improve safety culture?
The single highest-impact action is the plant manager conducting a visible, documented weekly safety walk that includes stopping to talk with at least three frontline operators about safety, asking open-ended questions, and personally following up on identified hazards. When employees see the plant manager prioritize safety over production in visible, consistent actions, the cultural message is far more powerful than any safety policy, training program, or poster campaign. Mills where the plant manager spends at least 2 hours per week on safety engagement activities have 60% lower incident rates than those where safety leadership is delegated exclusively to the EHS department.
How do you measure safety culture if it is not a physical thing?
Safety culture is measured through a combination of leading indicators, behavioral observations, and perception surveys. The most validated framework uses five dimensions: leadership commitment (measured by frequency and quality of management safety interactions), employee engagement (measured by near-miss reporting rates and safety suggestion submission rates), hazard identification (measured by proactive identification rate per 100 employee-hours), incident investigation quality (measured by corrective action closure rate and time-to-completion), and continuous improvement (measured by culture pulse survey scores and improvement project completion rates). These five dimensions produce a composite safety culture score from 0–100% that correlates strongly with lagging incident rates.
What is the biggest barrier to building a safety culture in a textile mill?
The biggest barrier is the persistent belief that safety and productivity are in conflict. When production pressure overrides safety considerations — even occasionally — the cultural message is that safety is a priority rather than a value. Priorities change based on circumstances; values do not. The second most common barrier is inconsistent leadership behavior — when one shift supervisor enforces safety rules strictly while another looks the other way, employees learn that safety compliance depends on who is watching rather than what is right. The third barrier is failure to close the feedback loop — when employees report hazards or near misses and see no follow-up action, they stop reporting. Digital systems that automate corrective action tracking and reporter notification directly address this third barrier.
Can a textile mill achieve zero incidents without investing in digital safety tools?
Yes — several mills in the Safety Excellence Network have achieved Level 4 culture using paper-based systems and strong leadership. However, digital tools accelerate the journey by 12–18 months on average. The specific advantages of digital platforms include: real-time near-miss reporting with photo evidence that improves investigation quality, automated trend analysis that identifies patterns humans miss, corrective action tracking with automated escalation that improves closure rates from 60% to 95%+, and leading indicator dashboards that make culture visible to all employees. The ROI of digital safety tools in textile mills averages 3:1 within the first year, driven by incident reduction, lower workers' comp premiums, and reduced audit preparation time.
Start Your Zero-Incident Journey Today
iFactory's safety culture platform includes maturity assessment, leading indicator dashboards, near-miss tracking with photo reporting, automated corrective action workflows, and culture pulse surveys. Book a demo to see your mill's current safety culture score and the 90-day kickstart plan tailored to your facility.