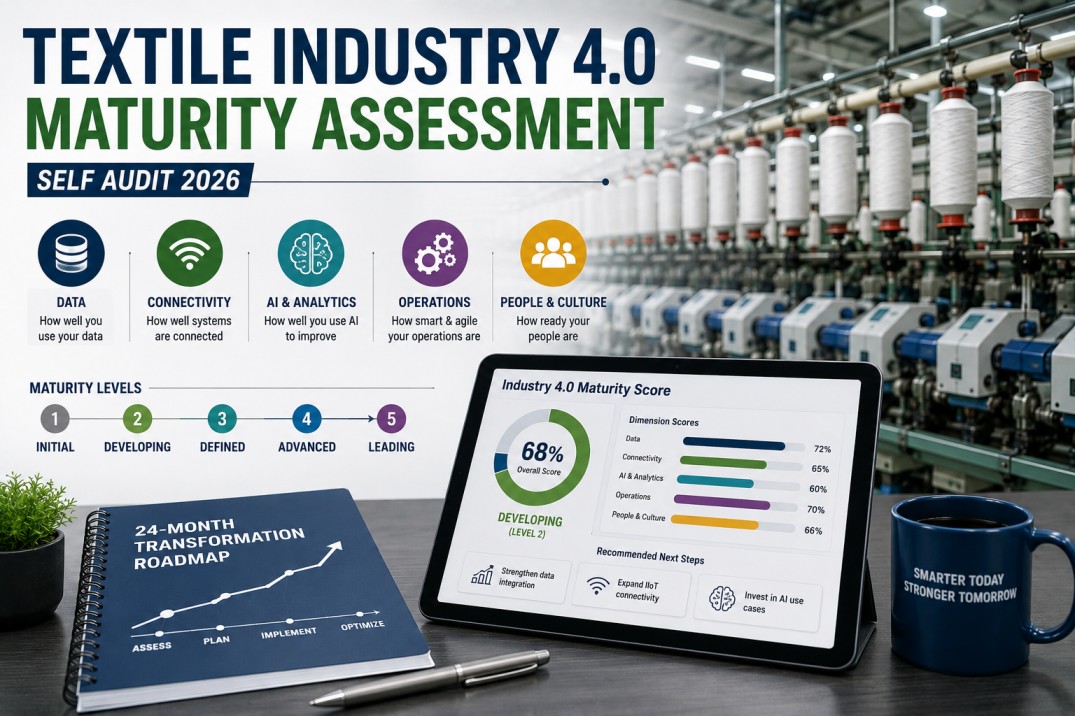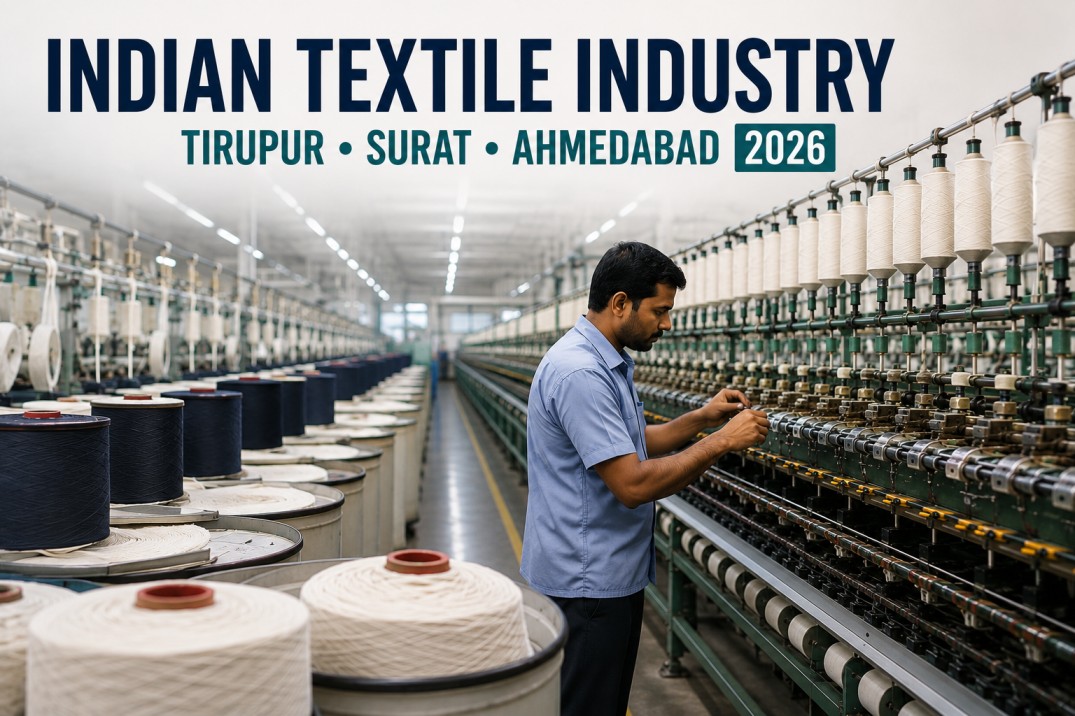
India's textile and apparel industry generates $165 billion in annual value, employs 45 million workers directly, and exports $35 billion in products across cotton, man-made fiber, and technical textile segments. Three clusters anchor this ecosystem — Tirupur in Tamil Nadu, the knitwear capital producing 60% of India's knitted garment output with $4.2 billion in exports; Surat in Gujarat, the synthetic fabric hub weaving 30 million meters daily and processing 75% of India's polyester yarn; and Ahmedabad, the denim capital where 34 mills produce 800 million meters annually. Each cluster faces distinct challenges and opportunities shaped by its fiber specialization, labor market, power costs, ZLD compliance status, and digital adoption level. This page compares these three clusters across ten key operating metrics, ranks the six growth drivers — PLI schemes, mega textile parks, FTAs, technical textiles, MMF shift, and sustainability compliance — that will shape cluster trajectories through 2030, presents a five-step opportunity roadmap for mills seeking to capture the next wave of industry growth, and summarizes the national industry context with key production, employment, and export statistics. Mills using iFactory's textile analytics platform gain real-time visibility into cluster-specific OEE, energy consumption, quality, and labor productivity benchmarks.
Three-Cluster Metrics — Tirupur vs Surat vs Ahmedabad
India's three largest textile clusters each occupy a distinct position in the global textile value chain. Tirupur specializes in cotton knitwear with extreme vertical integration and 21–28 day turnaround. Surat produces woven synthetic fabrics at $0.35–$0.55 per meter, making it the lowest-cost synthetic fabric producer globally after China. Ahmedabad's 34 denim mills produce 800 million meters annually — 65% of India's total denim output — with growing focus on premium and sustainable denim segments. The table below compares the three clusters across ten operating metrics that determine competitiveness and growth trajectory.
Benchmark Your Mill Against Cluster Peers
iFactory provides real-time OEE, energy, quality, and labor productivity dashboards with cluster-specific benchmarking for Tirupur, Surat, and Ahmedabad mills. Book a demo to see how your mill compares to the top quartile in your cluster.
Ten Metrics — Tirupur vs Surat vs Ahmedabad
The comparison table below captures the key operating metrics that define the competitive position of each cluster. Color-coded tags highlight compliance status, digital readiness, and strategic positioning across the three hubs.
| Metric | Tirupur Cotton Knitwear |
Surat MMF Woven Fabric |
Ahmedabad Denim & Cotton |
|---|---|---|---|
| Annual export value | $4.2B | $2.8B | $3.5B |
| Total units | 8,500+ | 40,000+ | 250+ |
| Direct employment | 600,000+ | 1,200,000+ | 400,000+ |
| Primary fiber | Cotton | Polyester / Nylon | Cotton / Denim |
| Avg operator wage | $180–$250/mo | $200–$280/mo | $190–$260/mo |
| Power cost | ₹7.5–₹8.5/kWh | ₹6.8–₹7.5/kWh | ₹6.5–₹7.2/kWh |
| ZLD compliance | 92% | 58% | 72% |
| Digital adoption | 34% | 22% | 31% |
| Key strength | Speed & integration | Scale & low cost | Denim expertise |
| Key challenge | High power cost | Low ZLD compliance | Commodity pressure |
Six Growth Drivers Reshaping Indian Textile Clusters
Six interconnected growth drivers are reshaping the competitive landscape of Indian textile clusters. The ranking below reflects each driver's measurable impact on mill-level profitability, investment attractiveness, and export competitiveness through 2030.
Is Your Mill Positioned for the Next Growth Wave?
iFactory's textile analytics platform helps mills across Tirupur, Surat, and Ahmedabad optimize production, reduce waste, and improve OEE. Schedule a demo to see how digital tools help mills in your cluster stay competitive.
Five-Step Cluster Opportunity Roadmap for Textile Mills
Mills across Tirupur, Surat, and Ahmedabad can follow this five-step roadmap to capture growth opportunities created by PLI schemes, FTAs, mega textile parks, and the global shift toward sustainable and traceable textile supply chains. Each step builds on the previous one to create a comprehensive digital and operational transformation.
Indian Textile Industry — Key National Metrics
India is the world's second-largest textile exporter after China with a 5.2% share of global textile and apparel trade. The national metrics below provide context for the cluster-level analysis and represent the consolidated performance of the entire textile value chain from fiber production through finished garment exports.
Frequently Asked Questions About Indian Textile Industry Clusters
Which Indian textile cluster offers the best investment opportunity in 2026?
The answer depends on the investment thesis and target market. Tirupur remains the strongest cluster for cotton knitwear garment manufacturing due to its vertically integrated ecosystem, 21–28 day turnaround, and 92% ZLD compliance. However, labor costs are rising faster than other clusters and power costs are the highest. Surat offers the largest opportunity for MMF garment manufacturing given its massive synthetic fabric production base and PLI incentives for MMF apparel, but the lack of garmenting expertise and 58% ZLD compliance are significant risks. Ahmedabad is best for denim and premium cotton apparel investment, with moderate costs and strong denim expertise. The optimal strategy for larger investors is multi-cluster presence — fabric sourcing from Surat, garment manufacturing in Tirupur, and denim operations in Ahmedabad — to capture the distinct advantages of each hub while mitigating cluster-specific risks.
Why is Surat's ZLD compliance significantly lower than Tirupur's?
Surat's lower ZLD compliance (58% vs Tirupur's 92%) stems from three structural factors. First, Surat's textile ecosystem is dominated by thousands of small weaving and processing units (2–20 looms) that lack the capital and space for ZLD infrastructure. A typical ZLD plant costs ₹2–5 crore for a medium-sized processing unit — prohibitive for small operators. Second, Surat processes synthetic fibers that generate different effluent profiles than cotton processing, requiring specialized treatment technologies that are more expensive and complex to operate. Third, regulatory enforcement in Gujarat has historically been less aggressive than in Tamil Nadu, where the 2011 Noyyal River pollution case and subsequent NGT orders created intense pressure on Tirupur's processing units. However, the Gujarat Pollution Control Board has intensified enforcement since 2024, and Surat's compliance rate is expected to reach 70% by 2028 driven by common ZLT infrastructure in the upcoming Surat Mega Textile Park.
How will the India-UK and India-EU free trade agreements affect textile cluster exports?
FTAs are the single most impactful external factor for Indian textile exports in 2026–2030. The India-UK FTA, expected for ratification in 2026, will eliminate the 8–12% duty on Indian garment exports to the UK — India's third-largest textile export market — creating a potential $2–3 billion export opportunity. Tirupur's knitwear and Ahmedabad's denim are best positioned to capture UK FTA benefits. The India-EU FTA, targeted for completion by 2027, would be transformative — the EU is the world's largest textile import market at $180 billion annually, and Indian exports currently face 6–12% duties that Bangladesh and Vietnam avoid. Surat's MMF fabric and Ahmedabad's denim will benefit most from EU FTA access. Mills that are Higg FEM verified and can demonstrate sustainable production with supply chain traceability will be first in line for FTA-driven orders, as both the UK and EU are implementing deforestation regulation and carbon border adjustment mechanisms that require documented supply chain sustainability.
What is the biggest infrastructure gap holding back Indian textile cluster growth?
The two biggest infrastructure gaps are reliable power at competitive rates and common effluent treatment infrastructure. Power costs across the three clusters range from ₹6.5/kWh in Ahmedabad to ₹8.5/kWh in Tirupur, compared to ₹4–5/kWh in competing countries like Bangladesh and Vietnam. Power availability is also inconsistent, with mills reporting 15–30 hours of grid outages per month depending on the season and location. The second gap is common ZLD infrastructure — while Tirupur has achieved 92% compliance through centralized effluent treatment plants, Surat's thousands of small units lack access to affordable common treatment facilities. The PM MITRA mega textile parks are designed to address both gaps by providing dedicated power substations with renewable energy integration and common ZLD plants. However, the first parks will not be operational until 2027, leaving a 12–18 month gap during which mills must invest in captive infrastructure or risk losing export orders to competitors in clusters with better infrastructure.
How does digital technology adoption differ across the three clusters and why does it matter?
Digital adoption correlates strongly with average unit size and export orientation. Tirupur leads at 34%, driven by export-oriented garment units that must meet buyer compliance requirements for traceability and quality data — ERP systems, production tracking, and quality management platforms are widely used among Tirupur's mid-size and large units. Ahmedabad is close behind at 31%, with denim mills investing in automated dyeing systems, shade monitoring, and laboratory information management systems. Surat lags at 22% because the cluster is dominated by thousands of small weaving units where the unit economics do not justify digital investment — a 4-loom weaving shed operating on thin margins cannot afford a ₹5 lakh OEE monitoring system. The gap matters because mills with digital adoption above 40% consistently achieve 12–18% higher OEE, 8–12% lower energy costs, and 15–20% faster order-to-dispatch cycles than those below 20% adoption. iFactory's platform is designed to bridge this gap with affordable, modular solutions that scale from single-machine monitoring to full-plant digital transformation, with cluster-specific benchmarks that help mills prioritize the highest-ROI digital investments.
Data-Driven Decisions for India's Textile Clusters
iFactory's analytics platform provides real-time OEE, energy, quality, and labor productivity dashboards with cluster-specific benchmarking for Tirupur, Surat, and Ahmedabad mills. Book a demo to see how your mill's metrics compare to the top quartile in your cluster.