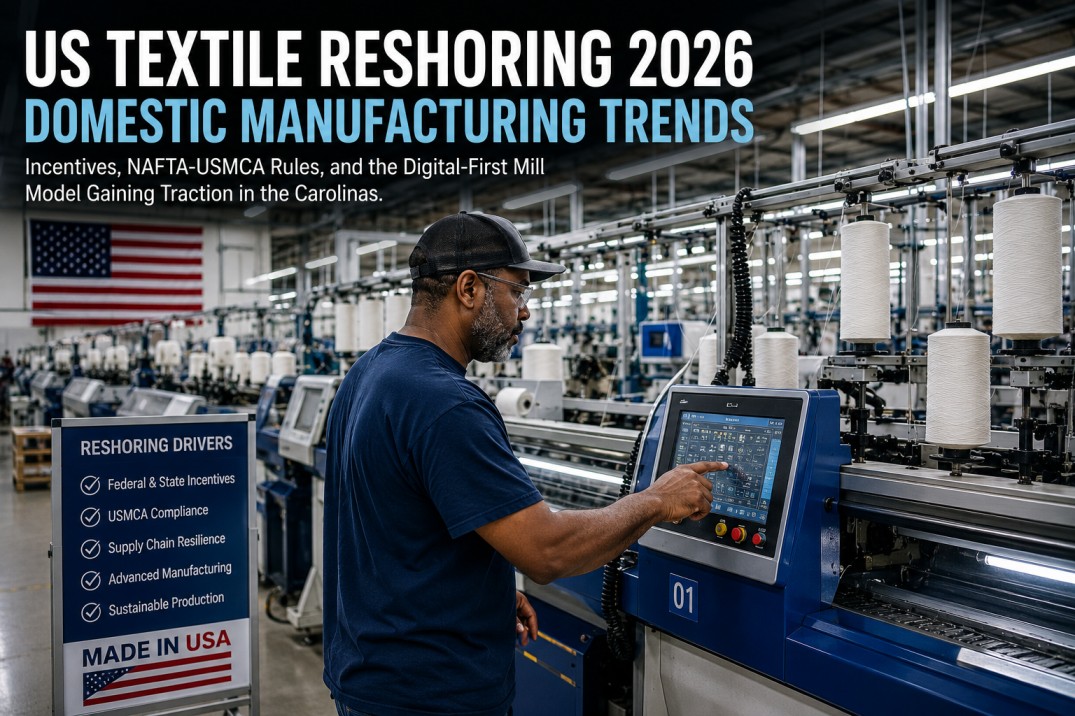
United States textile and apparel manufacturing is experiencing a modest but meaningful resurgence driven by a convergence of policy incentives, trade rule changes, and technology advancements that are gradually shifting the cost and risk calculus for brands and retailers sourcing for the North American market. The reshoring movement — more accurately described as nearshoring to the broader USMCA region — has accelerated since the trade agreement's stricter yarn-forward rules of origin took full effect in 2024, requiring apparel to use yarn and fabric produced within the bloc to qualify for duty-free access. Total US textile and apparel production reached approximately $65 billion in 2025, up from a low of $55 billion in 2020, while textile industry employment stabilized at 220,000 workers after decades of decline, with major investments announced in automated spinning mills in South Carolina, digital weaving facilities in North Carolina, and vertical garment manufacturing operations in Georgia and Alabama. This page presents six key reshoring momentum indicators with directional trend arrows, maps the four-stage USMCA production chain requirements from fiber through garment assembly, compares US and Asian manufacturing costs across six components using a head-to-head factor format, profiles six state-level incentive programs supporting textile investment, and examines the five-layer digital-first mill technology stack that is reshaping the competitive landscape for domestic textile production in the Carolinas and the broader Southeast.
US Textile Reshoring — Domestic Manufacturing Trends 2026
US textile reshoring is not a return to the 1990s manufacturing landscape — it is a fundamentally different model driven by automation, digital integration, just-in-time proximity to brands, and trade policy advantages that offset parts of the labor cost gap with Asian producers. The six momentum indicators below capture both the progress and the scale of the challenge facing domestic textile manufacturing expansion.
Evaluate Nearshoring Opportunities for Your Supply Chain
iFactory's textile analytics platform provides real-time production benchmarks across US, Mexican, and Central American mills, helping brands and manufacturers assess nearshoring viability with data-driven cost and quality comparisons. Book a demo to model your reshoring scenarios.
Six Key US Textile Reshoring Momentum Indicators
The six indicators below track the current state and trajectory of US textile reshoring across production value, employment, capital investment, trade deficit, regional sourcing share, and factory automation rates. Each indicator includes a directional arrow showing whether the metric is trending favorably (green up arrow) or requires attention (red down arrow), with the most recent data from 2025.
Increased $10 billion from the 2020 low of $55 billion, driven by capacity additions in nonwovens, technical textiles, and automated knitwear facilities across the Southeast.
Stabilized after three decades of decline from 1.2 million in 1990. Average textile manufacturing wage of $22.50 per hour remains below the overall manufacturing average of $34 per hour.
18 major projects across eight states with an average investment of $178 million per facility. Largest projects include automated nonwovens lines, digital knitting, and recycled fiber facilities.
Ninety-seven percent of apparel consumed in the US is imported, with 83% originating from Asia. The deficit persists despite reshoring gains, reflecting the scale of domestic consumption.
Increased from 9% in 2022 as brands shift sourcing to Mexico and Central America to comply with USMCA yarn-forward rules and to reduce lead times from 12 weeks to 3–4 weeks.
Compared to 12% in existing legacy mills. New facilities deploy collaborative robotics, automated material handling, and AI-based inspection from day one, achieving 3x higher labor productivity.
USMCA Yarn-Forward Rule — Production Chain Requirements
The USMCA yarn-forward rule of origin is the most consequential trade policy driving textile reshoring in North America. It requires that all textile and apparel products claiming duty-free status under the agreement use yarn and fabric produced within USMCA territory at every stage of production, from fiber extrusion or cotton cultivation through yarn spinning, fabric forming and finishing, and final garment assembly. The four-stage chain below shows each production step, its origin requirement, and the key compliance documentation needed to qualify for preferential tariff treatment.
Cotton grown in Texas, California, Georgia, and Mississippi. Polyester and nylon fiber from US chemical producers. Rayon and lyocell from domestic manufacturers. Origin verified by USDA certificates for cotton and manufacturer affidavits for synthetic fibers.
Cotton yarn spun by US mills including Parkdale Mills, Frontier Yarns, and Milliken in the Carolinas. Synthetic yarn extruded in US or Mexican facilities. Blended yarns must be spun within USMCA territory from USMCA-origin fibers.
Knit fabric produced in US or Mexico mills. Woven fabric from US or Mexican facilities with finishing processes including dyeing, printing, and chemical treatments performed within USMCA territory.
Cut-and-sew operations in the US, Mexico, or Central America. Non-originating trims and findings limited to 7–10% of garment value. Full supply chain traceability documentation required for USMCA certification.
Simplify USMCA Compliance With Digital Traceability
iFactory's platform provides end-to-end production traceability from fiber receipt through garment shipment, with prebuilt USMCA origin certification reports and supply chain documentation management. Book a demo to see how leading nearshoring mills manage compliance.
US vs Asia Manufacturing Cost — Six-Factor Comparison
The cost comparison between US/USMCA manufacturing and Asian production varies significantly by factor. Labor costs remain substantially higher in the US, but the gap narrows when accounting for automation productivity, logistics savings, tariff avoidance, and energy costs. Each factor below shows the US range and the Asia range side by side with a color-coded advantage indicator — purple when the US has a favorable position and teal when Asia has the advantage.
State-Level Incentive Programs for Textile Manufacturing
Six states in the US Southeast have established dedicated textile manufacturing incentive programs, offering a combination of capital grants, tax credits, workforce training subsidies, and infrastructure support to attract new facilities. The table below summarizes each state's flagship program, maximum incentive value, and priority investment sectors.
| State | Key Incentive Program | Max Value | Priority Sectors |
|---|---|---|---|
| South Carolina | Textile Community Revitalization Fund | $50M | Spinning Nonwovens |
| North Carolina | Manufacturing Extension Partnership | $30M | Digital Weaving Knitting |
| Georgia | Georgia Manufacturing Initiative | $25M | Vertical Garment Auto Textiles |
| Alabama | Alabama Industrial Development Program | $40M | Advanced Fabrics Technical Textiles |
| Tennessee | Tennessee Textile Innovation Fund | $20M | Automation Dyeing and Finishing |
| Texas | Texas Enterprise Fund | $15M | Cotton Processing Distribution |
Five-Layer Digital-First Mill Technology Stack
The digital-first textile mill represents a fundamentally different production model from legacy US mills, integrating IoT-connected machinery, automated material flow, manufacturing execution systems, AI-based process optimization, and direct-to-brand digital fulfillment into a unified technology stack. The five-layer model below is structured as a pyramid — each layer builds on the capabilities of the layers beneath it, with the widest foundation layer being the physical connected machinery and the narrowest top layer being the brand-facing digital integration that differentiates US nearshoring mills from Asian competitors on speed, transparency, and service.
IoT sensors on spinning, weaving, knitting, and finishing equipment provide real-time data on machine speed, power consumption, temperature, vibration, and production counts. Foundation layer enabling all digital capabilities above. Typical new mill deploys 800–1,200 connected machines with OEE dashboards from day one.
AGV and AMR systems transport materials between fiber bale opening, carding, spinning, winding, weaving, and finishing stages. Automated guided vehicles reduce manual handling labor by 60–80% and eliminate material tracking errors through RFID-enabled load verification at every transfer point.
Manufacturing execution system integrating production scheduling, real-time machine monitoring, quality tracking at each process stage, and automated reporting. Provides brand customers with secure portal access to production status, quality data, and shipment tracking. Average MES deployment in new US mills: 14 months from order to full operation.
Machine learning models optimize spinning parameters, weaving tension, and dyeing formulas in real time based on sensor data. AI vision inspection systems scan 100% of fabric at 120 meters per minute, detecting defects with 97%+ accuracy. Predictive maintenance models reduce unplanned downtime by 35–50%.
API-connected platform providing brand customers with real-time visibility into order status, production progress, quality metrics, and sustainability data. Enables short-run, quick-turn production cycles with 3–4 week lead times versus 12–20 weeks from Asia. The top differentiator for US nearshoring mills competing on speed and service.
Frequently Asked Questions About US Textile Reshoring
Is US textile reshoring actually happening, or is it mostly hype?
US textile reshoring is real but modest in scale and concentrated in specific sectors. Total US textile and apparel production grew from $55 billion in 2020 to $65 billion in 2025 — a real increase of 18% but still far below the $110 billion peak in 1995. The growth is concentrated in four sub-sectors: nonwoven fabrics (driven by hygiene, filtration, and medical demand, up 32% since 2020), technical textiles and industrial fabrics (automotive, aerospace, construction, up 22%), automated knitwear (seamless garment knitting, up 40% driven by new investments in North Carolina and Georgia), and recycled fiber production (mechanical and chemical recycling facilities, up 55%). Traditional commodity apparel manufacturing — basic t-shirts, woven shirts, denim — has seen minimal reshoring because the labor cost gap of approximately 10:1 between US ($22.50/hr) and Bangladesh ($1.80–$2.50/hr) cannot be fully offset by automation for labor-intensive cut-and-sew operations, even with tariffs and logistics factored in. The reshoring that is happening follows a specific pattern: it requires high automation rates (35–70% depending on product category), serves proximity-sensitive market segments (fast fashion replenishment, just-in-time retail, US government procurement), and often leverages state incentive programs that cover 15–25% of capital investment. The long-term trajectory depends on continued automation cost reduction, USMCA enforcement consistency, and the evolution of brand sourcing strategies away from pure cost optimization toward total cost models that factor in speed, sustainability, and supply chain resilience.
How does the USMCA yarn-forward rule affect apparel sourcing decisions?
The USMCA yarn-forward rule requires that all textile and apparel products claiming duty-free status use yarn and fabric produced within USMCA territory at every stage of production, from fiber through final assembly. This has three practical effects on apparel sourcing. First, it eliminates the ability to use low-cost Asian fabric for garments assembled in Mexico or Central America — the most common cost-saving strategy before USMCA. A garment that uses Chinese fabric and is assembled in Mexico now faces a 16–32% duty when imported to the US, effectively negating the labor cost advantage of Mexican assembly. Second, it has driven fabric mill investment in Mexico and Central America — since 2022, over $800 million has been invested in new knitting and weaving capacity in Mexico, Honduras, and Guatemala to supply USMCA-qualifying fabric to regional garment factories. Third, it creates a competitive advantage for vertically integrated US mills that can supply US-produced fabric to Mexican and Central American assembly operations, positioning them as strategic partners rather than just fabric vendors. The practical implication for brands is that USMCA sourcing requires careful supply chain mapping and documentation — each production stage must be traceable to a USMCA-origin supplier with verifiable certificates of origin. Brands that have not mapped their Western Hemisphere supply chain for USMCA compliance face duty costs that can add 10–25% to the landed cost of goods. iFactory's platform helps mills and brands maintain the digital traceability records needed to generate USMCA certificates of origin with auditable supporting documentation for every production batch.
How does US manufacturing cost compare to Asia after factoring in tariffs, logistics, and automation?
The total landed cost comparison between US/USMCA manufacturing and Asian sourcing varies significantly by product category, automation level, and supply chain configuration. For basic cut-and-sew garments like t-shirts and woven shirts assembled in Mexico or Central America with USMCA-qualifying fabric, the total landed cost is approximately 5–15% higher than China and 15–25% higher than Bangladesh. The gap narrows substantially for automated product categories. For seamless knit garments produced on automated knitting machines — where US mills achieve 70%+ automation — the landed cost is within 2–8% of Asian production. For nonwovens and technical textiles where automation rates exceed 80%, US production is frequently cost-competitive with Asia on a total landed cost basis. The breakeven analysis depends on six variables: the labor content of the specific product (lower labor content favors reshoring), the automation level achievable (higher automation narrows the gap), the tariff rate on Asian imports (7.5–25% depending on product category and origin), the logistics cost differential ($2.50–$5.00 per unit from Asia versus $0.50–$1.00 from USMCA), the inventory carrying cost of longer lead times (12–20 weeks from Asia versus 3–4 weeks from USMCA, reducing working capital requirements by 15–30%), and the premium buyers place on speed, sustainability, and supply chain resilience. Industry models suggest that at current automation trajectories, reshoring becomes cost-neutral for 25–35% of current apparel import categories by 2028, up from approximately 15% in 2025.
What state incentives are available for textile manufacturing investment in the US?
US states in the Southeast have established competitive incentive programs specifically targeting textile and advanced manufacturing investment. The six most active states offer a mix of capital grants, tax credits, workforce training subsidies, and infrastructure support. South Carolina's Textile Community Revitalization Fund provides up to $50 million per project for new spinning and nonwoven facilities in designated textile communities, with a focus on replacing capacity lost to offshore migration. North Carolina's Manufacturing Extension Partnership offers up to $30 million in matching grants for digital weaving and knitting facilities that demonstrate industry 4.0 technology integration, including smart machinery, IoT platforms, and MES deployment. Georgia's Manufacturing Initiative provides up to $25 million in combination with the state's Quick Start workforce training program — rated the top workforce training program in the US — offering customized training for textile production workers at no cost to the company. Alabama's Industrial Development Program provides up to $40 million for advanced fabric and technical textile facilities, with additional incentives for facilities locating in distressed rural counties. Tennessee's Textile Innovation Fund offers up to $20 million specifically for automation and digital dyeing and finishing investments, targeting modernization of the state's remaining textile base. Texas provides up to $15 million through the Texas Enterprise Fund for cotton processing and distribution facilities, leveraging the state's position as the largest cotton-producing state. Beyond state programs, the federal government's Advanced Manufacturing Tax Credit provides a 30% investment tax credit for domestic production of critical textiles and fibers under the CHIPS and Science Act framework. Manufacturers should engage with state economic development authorities at least 12 months before planned facility startup to negotiate incentive packages, as most programs require pre-approval and have specific job creation and capital investment thresholds.
What does a digital-first textile mill look like in practice, and how is it different from legacy US mills?
A digital-first textile mill differs from a legacy US mill in virtually every dimension of operations. Legacy mills, many of which were built between 1960 and 1990, typically operate with machines that are 15–25 years old, manual data collection via clipboards and whiteboards, paper-based quality inspection, and siloed production stages with material transported by forklifts and handcarts. A digital-first mill built after 2022 operates on fundamentally different principles. The mill floor is equipped with IoT-connected machines — typically less than 3 years old — that continuously stream production data to a central MES platform. Material moves between stages via AGVs guided by RFID tags that automatically log each transfer, eliminating manual tracking. Quality inspection is performed by AI vision systems at every critical control point, with defect data feeding back to upstream processes for real-time adjustment. Production scheduling is optimized by machine learning algorithms that consider order priorities, machine availability, material inventory, and maintenance schedules simultaneously. Brand customers have direct digital access to production status through a secure portal, reducing the need for customer visits and third-party audits. The workforce profile is also different — a legacy mill might employ 300–500 operators with 5–10 engineers, while a digital-first mill of comparable output employs 80–150 operators and 15–25 engineers, data scientists, and automation specialists. The capital cost per job created is higher — approximately $350,000–$500,000 per position versus $100,000–$150,000 in legacy mills — but the labor productivity is 3–5 times higher, making the unit cost competitive despite higher wages. iFactory's platform is designed for both mill types but delivers the highest ROI in digital-first facilities where the connected machine infrastructure enables real-time OEE, energy, and quality dashboards without manual data entry.
Future-Proof Your Mill With Real-Time Production Data
iFactory's textile analytics platform helps US and USMCA mills deploy the same digital infrastructure used by the most advanced nearshoring facilities — real-time OEE, automated quality tracking, supply chain traceability, and brand-facing production dashboards. Book a demo to see how iFactory supports reshoring competitiveness.