Global textile supply chains are restructuring faster than at any point since the 1990s shift to Asia. Brand buyers now demand multi-country sourcing portfolios, regulatory mandates require supply chain transparency, and geopolitical disruptions keep exposing the fragility of single-region concentration. The tier 1 benchmark has shifted from lowest unit cost to a composite resilience score balancing cost, geographic diversification, response time, digital traceability, and sustainability compliance. Brands increasingly require at least three sourcing countries and the ability to fulfill replenishment orders within four weeks from order to shipment. This page maps six major disruptions since 2020, profiles five sourcing regions with risk ratings, compares regional lead times against the four-week target, presents the six capabilities brands require through 2030, and outlines a four-phase supply chain redesign process for manufacturers serving North American and European markets.
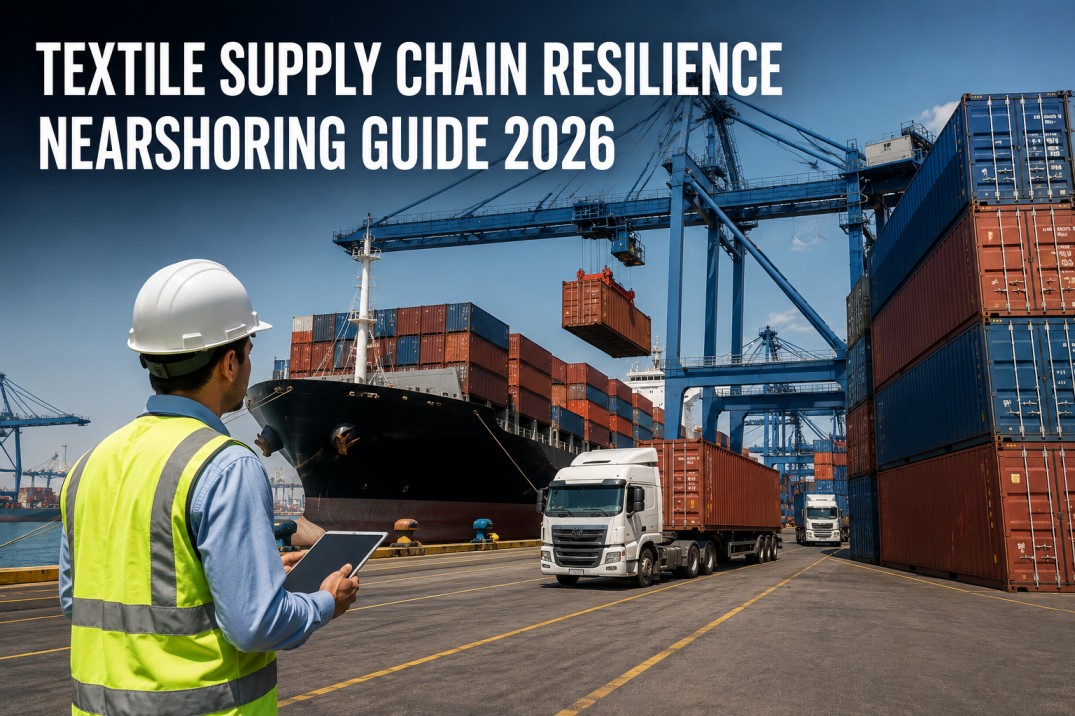
Textile Supply Chain Resilience and Nearshoring — 2026 Guide
The textile supply chain resilience imperative is not a temporary response to recent disruptions — it is a structural shift in how brands evaluate, select, and manage their supplier networks. Manufacturers that adapt their sourcing footprint, operational capabilities, and digital infrastructure to meet the new resilience benchmarks will secure tier 1 positions on buyer lists through 2030 and beyond, while those that maintain single-region, long-lead-time models face progressive exclusion from major brand sourcing portfolios.
Assess Your Supply Chain Against 2026 Benchmarks
iFactory's platform provides real-time visibility across multi-country production networks, with lead time tracking, supplier performance dashboards, and compliance documentation management. Book a demo to evaluate your supply chain readiness for tier 1 buyer requirements.
Six Major Supply Chain Disruptions — 2020 to 2026
The six disruptions below have reshaped global textile supply chain strategy since 2020, each exposing a different dimension of vulnerability — pandemic-related factory closures, maritime chokepoint disruption, government policy risk, labor unrest, trade rule changes, and regulatory compliance escalation. Together they have driven brand sourcing requirements from single-region cost optimization toward multi-country resilience as the primary criterion for tier 1 supplier selection.
Five Major Sourcing Regions — Risk and Capability Profiles
The resilience profile of each sourcing region is determined by three factors: lead time agility, cost competitiveness, and quality consistency, combined with a risk assessment covering geopolitical stability, regulatory environment, labor conditions, and infrastructure reliability. The risk bar at the bottom of each profile card provides a visual summary of the overall risk level — green for low, purple for medium — while the three metrics give a quantitative basis for sourcing portfolio decisions.
United States, Mexico, Central America. Strongest nearshoring option for US market. USMCA duty-free access. Rapidly growing fabric and garment capacity. Labor costs $2.50–$22.50/hr depending on country. Lead time advantage of 3–4 weeks vs 10–16 from Asia.
Portugal, Turkey, Eastern Europe, Morocco. Primary nearshoring option for EU market. EU DPP compliance ready. Higher automation levels. Geopolitically stable. Lead time advantage of 4–6 weeks for EU buyers vs 10–14 from South Asia.
Vietnam, Cambodia, Indonesia, Philippines. Strong cost advantage. Growing fabric production capacity. Political and regulatory risks moderate. Digital adoption improving. Best positioned to capture China-plus-one volume in Asia.
Bangladesh, India, Pakistan, Sri Lanka. Lowest cost globally. Largest garment workforce. Higher political and labor risk. Infrastructure challenges. Digital adoption lowest among major regions. Primary source for ultra-low-cost commodity apparel.
World's largest textile producer. Highest digital adoption among Asian producers. Geopolitical and tariff risk elevated. Automation levels rising rapidly. Best for complex, high-quality products. Increasingly focused on premium rather than commodity segments.
Build Your Multi-Country Sourcing Network
iFactory's platform provides real-time production tracking across multiple sourcing countries, enabling brands and manufacturers to monitor lead times, quality, and compliance across their entire supplier network from a single dashboard. Book a demo to see how multi-country visibility drives resilience.
Regional Lead Times vs the 4-Week Target
Brand replenishment requirements have shifted from 12–16 week lead times pre-pandemic to 4–6 weeks in 2025, with the most demanding buyers targeting a four-week ceiling from order placement to shipment. The chart below shows each region's average lead time as a horizontal bar, with the red dashed line marking the four-week target. Bars extending past the target line represent the vulnerability gap that nearshoring and digital process optimization must close.
Six Capabilities Brands Require for Tier 1 Status Through 2030
Brands have consolidated their tier 1 supplier requirements into six measurable capabilities that collectively define the resilience and performance standard for preferred supplier status through the end of the decade. Each capability below includes the current industry average readiness level, shown as a gradient meter at the bottom of each card, based on assessments conducted by major brand compliance teams across their supplier bases in 2025.
Brands require suppliers to maintain production capacity in at least three countries. Single-region suppliers face progressive volume reduction. Target: No more than 60% of volume from any single country.
Replenishment orders must ship within 4 weeks of order placement. Requires excess capacity, raw material buffer, and expedited production protocols. Current industry average: 8–12 weeks.
DPP-ready data systems covering material origin, processing history, environmental footprint, and social compliance. Data must be machine-readable and API-accessible by brand platforms.
EU DPP readiness, carbon footprint reporting, chemical management certification, and recycled content capability. Regulatory alignment with both EU and US requirements.
Sub-2% defect rate target across all product categories. AI-based inspection adoption for 100% production screening. Statistical process control data shared with brand quality teams monthly.
Capacity for pre-financing raw material purchases, 60–90 day payment terms, and capital investment in automation and digital infrastructure. Audited financial statements reviewed annually.
Four-Phase Supply Chain Redesign Process
Redesigning a textile supply chain for resilience follows a structured four-phase process that begins with network assessment and ends with continuous optimization. The timeline below shows the recommended duration for each phase based on implementation experience from 40+ brand and manufacturer supply chain transformation projects since 2023.
- Map current sourcing countries and single-region dependencies
- Document lead times, cost structure, and risk concentration per region
- Identify critical vulnerabilities in current supply chain configuration
- Define optimal country mix balancing cost, lead time, risk, and compliance
- Evaluate nearshoring options for US and EU markets separately
- Establish qualification criteria and scorecard for new supplier onboarding
- Qualify and onboard suppliers in target nearshoring and diversification countries
- Deploy digital traceability systems with DPP-ready data collection
- Establish multi-country production tracking and reporting infrastructure
- Continuous lead time and total cost optimization across all sourcing regions
- Real-time supply chain visibility dashboards for brand customers
- Annual network re-evaluation against evolving brand requirements and regulations
Frequently Asked Questions About Supply Chain Resilience
What does multi-country sourcing mean in practice for a textile manufacturer?
Multi-country sourcing means having production capacity in at least three countries, with no single country exceeding 60% of total volume. A Bangladesh-based manufacturer might add a Vietnamese factory, partner with a Turkish supplier for EU access, and develop a Mexican facility for USMCA-qualifying production. Each additional country adds logistics, currency, compliance, quality, and technology standardization complexity. Brands verify through facility audits and production mapping, not contractual relationships. Verified multi-country suppliers receive 10–25% higher order volume than single-region alternatives.
How can manufacturers achieve a four-week response time?
Proximity to market is the critical enabler. Mexican and Central American manufacturers serving the US achieve 3–4 weeks via truck transport alone, while Asian manufacturers need 10–16 weeks due to 25–45 day ocean transit plus production time. For Asian producers, reaching four weeks requires five changes: maintain 4–6 weeks of raw material inventory for core categories, dedicate 15–20% capacity for quick-turn orders, implement real-time digital production scheduling to compress order-to-production from 5–7 days to 24–48 hours, use air freight for urgent replenishment (15–25% premium), and optimize factory-to-port logistics to reduce inland transit and customs from 5–7 days to 2–3 days. The most successful model blends standard 10–14 week base load with a 15–20% quick-turn reserve at a 10–15% price premium.
What digital capabilities do brands require from tier 1 suppliers?
Brands require four digital capabilities as a condition of preferred supplier status. Real-time production visibility — secure portal access to live order progress, machine utilization, quality metrics, and shipment readiness, updated daily from the MES. Digital traceability — each batch must have a digital record of material origin, processing history, quality tests, and social compliance documentation. Quality data integration — defect tracking, yield rates, and audit results in a structured format for cross-supplier analysis. Supply chain documentation management — certificates of origin, chemical declarations, audit reports, and permits in a centralized digital repository. About 28% of suppliers currently meet all four requirements (up from 12% in 2022). Manufacturers without digital traceability and production visibility by 2027 will face exclusion from tier 1 programs.
Is nearshoring cost-competitive with Asian production?
Cost competitiveness varies by product category, automation level, and destination market. For basic cut-and-sew garments in Mexico or Central America, total landed cost is 5–20% higher than Asian production — driven by labor cost differences ($2.50–$4.50/hr in Mexico vs $1.80–$3.50 in Bangladesh) — partially offset by lower logistics ($0.50–$1.00/unit vs $2.50–$5.00 from Asia), zero USMCA tariff vs 7.5–25% on Asian imports, and 15–30% lower inventory carrying costs from shorter lead times. For highly automated categories (seamless knitwear, nonwovens, technical textiles with 60–80%+ automation), the gap narrows to 0–10%. For the EU market, Turkey, Portugal, and Eastern Europe carry a 5–15% premium vs Asia. Nearshoring competes on total value — 3–4 week lead times, lower carbon footprint, reduced geopolitical risk, and audit flexibility — not pure unit cost.
How should manufacturers prioritize supply chain resilience investments?
Start with digital traceability and production visibility infrastructure — it addresses the most brand requirements simultaneously (DPP data collection, production visibility, quality data, compliance documentation). Cost for a mid-sized manufacturer (500–2,000 workers): $80,000–$200,000 with 6–12 month deployment. Second: geographic diversification — add a second or third country ($5M–$25M for a new factory, or 6–12 months for partnership). Third: lead time compression to 4–6 weeks for a portion of production. Fourth: automation in high-labor processes to narrow the nearshoring cost gap. Sequence investments based on your brand customer base. Start with your annual brand compliance assessment and close at least two gaps per year to maintain tier 1 status through 2027–2028.
Strengthen Your Supply Chain Resilience With Real-Time Data
iFactory's platform helps textile manufacturers and brands build resilient, multi-country supply chains with real-time production visibility, digital traceability, lead time tracking, and compliance documentation management across all sourcing regions. Book a demo to see how leading suppliers are meeting tier 1 resilience requirements for 2026 and beyond.