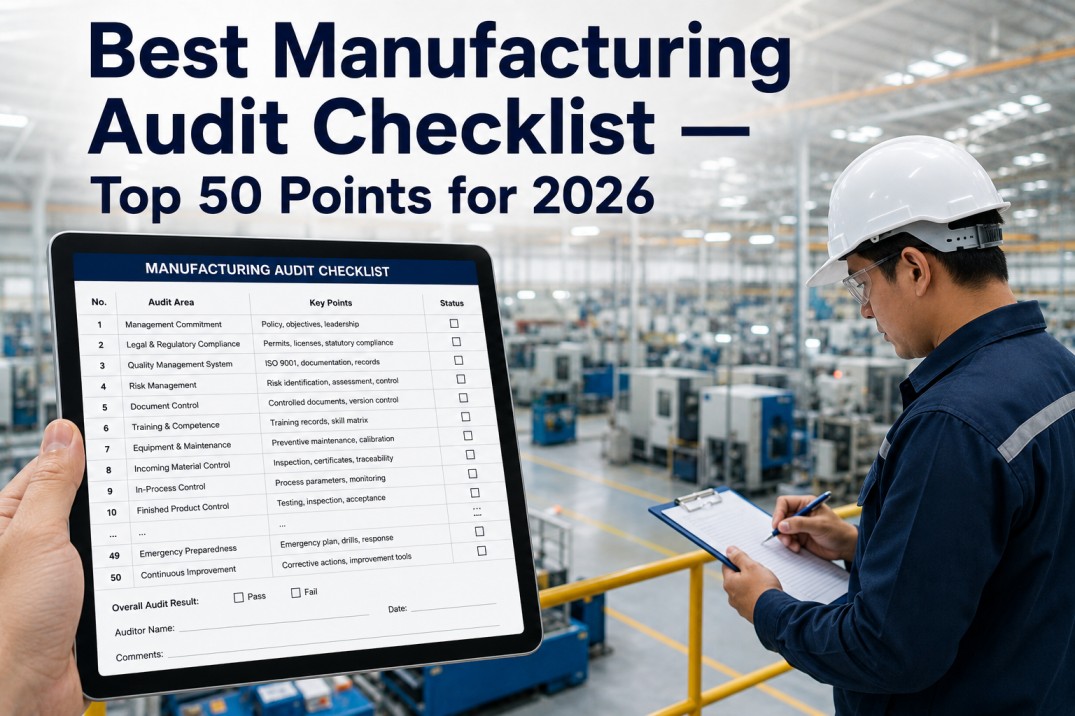
A manufacturing audit is no longer a once-a-year clipboard walk. In 2026, plant leaders are auditing against tighter customer specs, IATF 16949 and ISO 9001:2015 surveillance cycles, ESG disclosures, FSMA 204 traceability, and AI-driven quality expectations - all at the same time. This is the top 50-point manufacturing audit checklist for 2026, built from iFactory's anonymized data across 1,000+ digitized plants in automotive, food and beverage, pharma, electronics, and discrete manufacturing.
Use it as a self-audit before a customer or registrar arrives, or run it inside iFactory where every failed point auto-creates a CAPA with owner, due date, and evidence trail.
The 50 audit points that separate top-quartile plants from the rest
Based on 1,000+ plants, 4.2M inspections, and 380K CAPAs closed on iFactory in the last 24 months.
What the data says about manufacturing audits in 2026
The 10 categories of a complete 2026 manufacturing audit
Quality management system
5 points - ISO 9001 / IATF 16949 alignment, document control, management review.
Process control
6 points - SPC, control plans, FMEA, setup approval, first-piece inspection.
Incoming and supplier quality
5 points - PPAP, COA review, supplier scorecards, receiving inspection.
Equipment and calibration
5 points - PM compliance, MSA, calibration recall, OEE tracking.
Traceability and lot control
5 points - FSMA 204, genealogy, recall test, batch records.
People and training
5 points - skills matrix, training records, qualification renewals.
EHS and compliance
5 points - OSHA, SDS, LOTO, PPE, environmental permits.
5S and visual factory
4 points - housekeeping, shadow boards, andons, visual standards.
Data, digital, and cyber
5 points - MES, ERP integration, OT security, AI/ML governance.
Continuous improvement
5 points - kaizen, CAPA effectiveness, audit follow-up, KPI trending.
Top 10 audit failures across 1,000+ plants (2025-2026)
Source: iFactory benchmark, 1,000+ plants, Jan 2025 - Mar 2026. Percentage = plants where the finding appeared in at least one audit.
The 50-point manufacturing audit checklist for 2026
Quality management system (5)
- Quality manual and policy reviewed within last 12 months
- Document control - all SOPs at current revision on the floor
- Management review minutes show action items with owners
- Internal audit schedule for the year is complete and on track
- Customer-specific requirements (CSRs) mapped to processes
Process control (6)
- Control plans match the current process flow
- SPC charts maintained for all critical characteristics
- Cp and Cpk above customer-specified thresholds
- First-piece inspection signed off before each run
- Setup approval records signed by quality and operator
- PFMEA updated within 12 months and after each change
Incoming and supplier quality (5)
- Approved supplier list current with expiry dates
- PPAP on file for every active part number
- COA review documented for incoming raw material
- Supplier scorecards reviewed quarterly
- Receiving inspection plan reflects risk-based sampling
Equipment and calibration (5)
- 100% of measurement equipment within calibration date
- MSA studies (GR&R) completed for critical gauges
- Preventive maintenance compliance above 90%
- OEE tracked, trended, and reviewed weekly
- Tooling and fixture records with cycle counts
Traceability and lot control (5)
- Lot genealogy traceable from raw material to shipped product
- Annual mock recall completed within 4 hours
- Batch records signed, complete, no white space
- FSMA 204 (or equivalent) compliance for applicable SKUs
- Hold and quarantine areas physically separated and labeled
People and training (5)
- Skills matrix exists and is current for every operator
- Job-specific training records signed and on file
- Qualification renewals tracked with reminders
- New-hire onboarding includes quality, safety, and FOD training
- Contractor and temp workers held to same training standard
EHS and compliance (5)
- OSHA 300 log current with no unrecorded incidents
- SDS available within 30 seconds at every workstation
- LOTO procedures posted and matched to equipment
- PPE compliance verified during walkthrough
- Environmental permits current and limits not exceeded
5S and visual factory (4)
- Workstations clean, organized, no excess WIP
- Shadow boards and tool locations match standard
- Andon and escalation triggers visible and used
- Visual standards posted at each station (limit samples, OK/NG)
Data, digital, and cyber (5)
- MES or digital production system in use on critical lines
- ERP and MES data reconcile within 1% variance
- OT network segmented from corporate IT, documented
- User access reviewed quarterly, no shared logins on the floor
- AI / ML models in production have governance and retraining logs
Continuous improvement (5)
- CAPA effectiveness verified 60-90 days after closure
- Kaizen events tracked with hard-dollar savings
- Internal audit findings closed within target timeline
- KPIs trended monthly with action when off-target
- Lessons learned shared cross-plant within 30 days
How top-quartile plants score versus the rest
| Audit category | Top quartile | Median plant | Bottom quartile |
|---|---|---|---|
| QMS and document control | 98% | 84% | 62% |
| Process control (SPC, Cpk) | 96% | 78% | 54% |
| Calibration compliance | 100% | 88% | 67% |
| Training currency | 97% | 72% | 48% |
| CAPA on-time closure | 94% | 69% | 41% |
| Traceability mock-recall (4 hr) | 100% | 76% | 43% |
| OT cybersecurity | 89% | 57% | 22% |
iFactory benchmark across 1,000+ plants, score = % of audit points passed first time.
Paper audit vs digital audit on iFactory
Paper audit binder
- Findings lost between walkthrough and write-up
- CAPAs assigned by email, no due-date enforcement
- No photo evidence attached to findings
- Effectiveness checks rarely performed
- Trend analysis takes weeks to compile
- Customer auditor sees stale, hand-written records
iFactory digital audit
- Findings created on mobile with photo and location
- CAPAs auto-routed to owner with due-date timer
- Photo, signature, and timestamp on every entry
- Effectiveness checks scheduled automatically at 60 days
- Live dashboards by plant, line, category, owner
- Customer auditor sees audit-ready data on demand
Audit cadence recommended for 2026
| Audit type | Frequency | Owner | Evidence required |
|---|---|---|---|
| Layered process audit (LPA) | Daily / shift | Supervisor | Mobile checklist, photo |
| 5S and visual factory | Weekly | Area lead | Score sheet, before/after |
| Internal QMS audit | Monthly (rotating) | Quality manager | Findings log, CAPA |
| Full 50-point self-audit | Quarterly | Plant manager | Scorecard, trend report |
| Customer / registrar audit prep | 30 days prior | Quality director | Document pack, gap CAPAs |
| OT cybersecurity audit | Annually | IT + plant | Network diagram, access log |
Frequently asked questions
Is this checklist aligned to ISO 9001 and IATF 16949?
Yes. Each of the 50 points maps to one or more clauses of ISO 9001:2015 and IATF 16949:2016. In iFactory the mapping is built into the template so a finding automatically references the relevant clause for your registrar.
How long does a full 50-point audit take?
On paper, plants in our benchmark take 12-18 hours spread across 3-5 days. On iFactory, with mobile entry and pre-loaded evidence links, the same audit completes in 4-6 hours with higher data quality.
Can we customize the 50 points for our industry?
Yes. The 50 points are the cross-industry baseline. iFactory ships industry packs for automotive (IATF), food (FSMA, SQF, BRC), pharma (GMP), and electronics (IPC) that add or replace points where required.
What happens to a failed point inside iFactory?
The failed point immediately creates a CAPA with owner, due date, root-cause template, and effectiveness-check trigger. The CAPA stays open on a dashboard until evidence is uploaded and verified.
How does iFactory help us prepare for customer audits?
iFactory continuously runs the 50-point audit in the background, so when a customer or registrar arrives you already have a live scorecard, evidence pack, and CAPA history - no scramble, no binder, no surprises.
Walk into your 2026 audits already passing
See how iFactory turns the 50-point audit into a live, mobile, evidence-backed workflow on your plant floor.