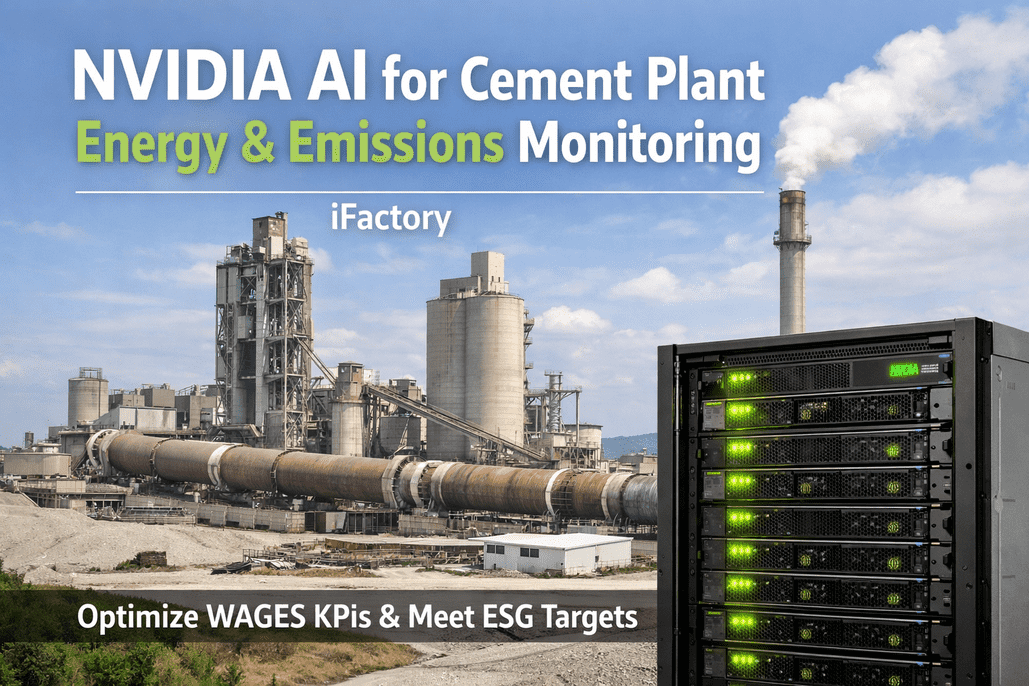
Energy accounts for 30-40% of every dollar spent producing cement — the single largest controllable cost in any plant. A typical 2,000 TPD facility spends $8-12M annually on fuel and electricity flowing through kilns, grinding circuits, and auxiliary systems with significant waste hiding in plain sight. Yet most plants still track energy through quarterly audits and monthly Excel reviews — by the time a problem surfaces, thousands of dollars have already been wasted. NVIDIA GPU-accelerated AI processes thousands of live sensor readings to continuously optimize kiln thermal profiles, mill loading, and waste heat recovery — delivering 10-20% reductions in specific energy consumption without replacing equipment. For an industry responsible for 8% of global CO2 emissions and facing intensifying carbon pricing, AI energy monitoring addresses both the bottom line and ESG compliance simultaneously. Book a 30-minute demo to see real-time WAGES KPI tracking and AI energy optimization on cement plant data.
Energy Breakdown Across Cement Plant Operations
| Process Area | Energy Type | % of Total Plant Energy | Best-Practice Benchmark | AI Optimization Potential |
|---|---|---|---|---|
| Rotary Kiln | Thermal (fuel) | 40-50% | 3.0-3.3 GJ/ton clinker (SHC) | 6-15% fuel reduction through combustion optimization |
| Calciner | Thermal (fuel) | 12-18% | Integrated with kiln SHC | Optimal fuel split; alternative fuel maximization |
| Finish Mill | Electrical | 20-25% | 28-35 kWh/ton cement | 5-10% kWh reduction via AI separator/pressure control |
| Raw Mill | Electrical + thermal (drying) | 10-15% | 12-18 kWh/ton raw meal | Load optimization; moisture-adaptive control |
| Clinker Cooler | Thermal (heat recovery) | N/A (recovery system) | >75% heat recovery to preheater | Optimize grate speed/airflow for max recovery |
| Fans & Blowers | Electrical | 8-12% | Variable speed drives on ID/FD fans | Draft optimization tied to kiln conditions |
| Auxiliaries | Electrical | 5-8% | Compressed air, lighting, conveyors | Load shedding during peak pricing periods |
Want to know exactly where your plant's energy waste is hiding? Book a free energy assessment — we'll benchmark your SHC, kWh/ton, and heat recovery against best-practice targets and identify the top 5 savings opportunities.
NVIDIA GPU for Real-Time WAGES KPI Tracking
WAGES — Water, Air, Gas, Electricity, Steam — represents the full utility consumption picture of a cement plant. Traditional tracking aggregates monthly utility bills. AI-powered WAGES monitoring tracks consumption at sub-minute intervals across every process area, correlating energy use with production parameters to identify waste in real-time.
Specific Heat Consumption
kcal/kg clinker — the primary kiln efficiency metric. AI tracks continuously vs. 2-4 hour lab-based calculation. Every 10 kcal/kg reduction = $100K-$300K/year savings for a 5,000 TPD plant.
Specific Electrical Consumption
kWh/ton cement — tracks grinding, fans, and auxiliaries. AI adjusts separator speed, grinding pressure, and fan draft to minimize kWh while maintaining Blaine targets. 5-10% improvement documented.
Thermal Substitution Rate
% of kiln fuel from alternative sources (RDF, tires, biomass). AI enables 20-40% higher substitution by dynamically adjusting kiln parameters as fuel quality varies.
Clinker Factor
Clinker-to-cement ratio — lower = less energy per ton of cement. AI optimizes SCM (fly ash, slag, calcined clay) blending while maintaining 28-day strength targets.
Carbon Intensity
kg CO2 per ton of cement — combining Scope 1 (kiln fuel + calcination) and Scope 2 (grid electricity). The KPI that ties operational efficiency directly to ESG compliance.
Waste Heat Recovery
% of kiln exhaust heat recovered for preheating or power generation. AI optimizes cooler airflow and preheater draft to maximize recovery. Target: >75% recovery rate.
Kiln Fuel vs. Electrical Energy Optimization
The kiln and the grinding circuits represent two fundamentally different optimization challenges — thermal vs. electrical — but they are deeply interconnected. Clinker quality from the kiln determines grindability in the finish mill. Over-burning wastes fuel AND increases grinding energy. AI optimizes both simultaneously.
| Optimization | Kiln (Thermal) | Grinding (Electrical) | Interconnection |
|---|---|---|---|
| Primary AI Lever | Combustion control: fuel rate, air-fuel ratio, kiln speed | Load control: separator speed, grinding pressure, feed rate | Consistent clinker = predictable grindability |
| Savings Range | 6-15% fuel reduction (30-100 kcal/kg clinker) | 5-10% electrical reduction (3-8 kWh/ton cement) | Combined: $1-3M/year for 5,000 TPD |
| Response Time | Seconds (fuel, air) to minutes (kiln speed) | Seconds (separator) to minutes (feed rate) | Kiln changes affect mill 2-6 hours later |
| Peak Management | Fuel switching to cheaper alternatives during price spikes | Load shedding and shift to off-peak grinding hours | Coordinated scheduling maximizes total savings |
| GPU Requirement | NVIDIA L40S for real-time combustion optimization | NVIDIA L4 for mill load optimization | H100 for training cross-process models |
Carbon Emissions Monitoring & ESG Reporting
Cement accounts for 8% of global CO2 emissions. Carbon pricing mechanisms are expanding globally — California's SB 596 mandates 40% emissions reduction by 2035. EU ETS carbon prices have exceeded €90/ton. AI energy optimization directly reduces both Scope 1 (kiln fuel combustion + calcination) and Scope 2 (grid electricity) emissions while generating the audit-ready data that ESG reporting frameworks require.
Need ESG-ready energy monitoring for your cement plant? Schedule a demo to see real-time CO2/ton tracking, WAGES dashboards, and automated ESG reporting powered by NVIDIA GPU analytics.
AI-Driven Energy Anomaly Detection
Energy waste in cement plants isn't always obvious. A preheater cyclone slowly fouling adds 10 kcal/kg over weeks. False air infiltration through a worn expansion joint wastes 3% of kiln energy continuously. A finish mill separator running 2% above optimal speed over-grinds every ton. AI builds dynamic energy baselines that account for raw material variability, ambient temperature, product mix, and equipment wear — then flags deviations within minutes, not months.
Kiln Thermal Drift
AI detects when SHC rises above the dynamic baseline adjusted for current raw meal chemistry and ambient conditions. Flags root cause: false air, burner tip degradation, refractory wear, or sub-optimal air-fuel ratio. Alerts operator and auto-generates CMMS work order if maintenance-related.
$50K-$200K per undetected drift event (per month)Grinding Over-Consumption
Detects when kWh/ton exceeds baseline for current feed rate, moisture, and Blaine target. Common causes: classifier wear, grinding media depletion, air slide blockage, false air in mill circuit. AI distinguishes between process drift and equipment degradation.
$30K-$150K per month of undetected over-grindingCooler Heat Recovery Loss
When secondary air temperature drops below target, the kiln compensates with additional fuel — a hidden energy loss. AI correlates cooler grate speed, airflow distribution, and clinker bed depth to identify root cause (worn grate plates, air channeling, over-speed).
$80K-$300K annually from suboptimal heat recoveryPeak Demand Spikes
EAF-start sequences, simultaneous mill starts, or uncoordinated compressor loads create demand peaks that trigger punitive utility charges. AI schedules high-load operations to avoid coincident peaks and shifts energy-intensive processes to off-peak periods automatically.
$100K-$500K annually in demand charge avoidanceBenchmarking Plant Energy Performance
| Performance Tier | SHC (kcal/kg clinker) | SEC (kWh/ton cement) | CO2 Intensity (kg/ton) | Characteristics |
|---|---|---|---|---|
| World-Class | <700 | <85 | <550 | AI closed-loop optimization, high AFR, low clinker factor, WHR power generation |
| Above Average | 700-750 | 85-100 | 550-650 | Some AI/advanced process control, moderate AFR, standard clinker factor |
| Industry Average | 750-850 | 100-120 | 650-750 | DCS control with manual optimization, limited AFR, standard equipment |
| Below Average | >850 | >120 | >750 | Reactive operations, no AFR program, outdated equipment, manual reporting |
Most plants operate 10-15% above their theoretical minimum energy consumption. The gap between current performance and best-in-class isn't a mystery — it's an optimization problem that AI solves continuously, not quarterly. Every percentage point improvement in kiln efficiency translates to $400K-$600K annually for a 5,000 TPD plant.
See Where Your Plant Sits — and What AI Can Recover
iFactory deploys NVIDIA GPU-powered energy monitoring across the full cement flowsheet — kiln, mills, cooler, and auxiliaries. Real-time WAGES tracking, ESG reporting, anomaly detection, and continuous optimization from one platform.
Frequently Asked Questions
Every Calorie and Kilowatt Tracked Is a Dollar Recovered
Plants operating 10-15% above theoretical minimum are leaving $1-3M on the table annually. Real-time AI monitoring finds it, quantifies it, and helps you close the gap — continuously.