Every production line runs two factories at the same time. The first one is visible — the machines that hum, the parts that come off the end, the breakdowns loud enough to call a supervisor over. The second one lives in the cracks. A 45-second jam that the operator clears before anyone notices. A filler that quietly runs at 89% of rated speed because that is what keeps the labels straight. A changeover that was supposed to take 35 minutes but took 52, written up as "standard." Research across 3,500+ manufacturing operations consistently shows that this hidden factory consumes 8–15% of total production time — capacity that never appears in any report, is never investigated, and costs millions annually in invisible losses. AI loss analysis is the flashlight. It sees every micro-stop, times every cycle, spots every bottleneck as it shifts from one station to the next, and walks backwards from every loss to the specific root cause that produced it. Plants that finally see the whole factory typically unlock 8–15 OEE points within the first six months — not by working harder, but by finally seeing what was there all along.
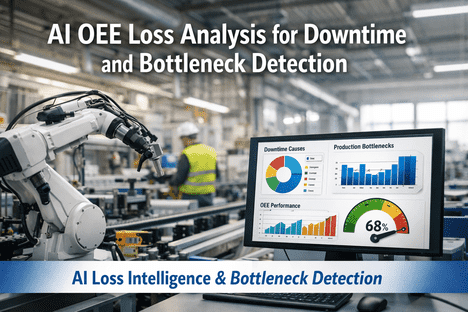
AI Loss Intelligence & Bottleneck Detection
The Hidden Factory Inside Your Factory — And the AI That Finally Finds It
iFactory's AI loss analysis sees every micro-stop, every speed loss, every shifting bottleneck — traces each back to its real root cause, and shows your team exactly where to fix the leak.
8–15%
Of production time hidden as undetected micro-stops
80/20
Of downtime traced to just 3 root causes most plants never see
4 of 6
Of the Six Big Losses silently missed by manual logging
$2.3M
Typical first-year recovery from finding hidden losses
Sources: TEEPTRAK Six Big Losses Analysis · iFactory Steel Plant Case Study · VDMA 2025 Benchmark · Accenture Micro-Stop Research
What Manual Logs See vs. What AI Sees
Here is the same production shift viewed through two different lenses. The left side shows what your current paper-based or clipboard system captures. The right side shows what iFactory's AI actually detects from the same machines, in the same shift, with the same team. The gap between them is your hidden factory — and your single biggest opportunity.
Manual System
What Gets Logged
Major Breakdowns
100% caught
Planned Changeovers
80% caught
Startup Rejects
15% caught
Bottleneck Shifts
5% caught
iFactory AI
What Gets Detected
Major Breakdowns
100% caught
Planned Changeovers
100% caught
Startup Rejects
100% caught
Bottleneck Shifts
100% caught
Want to see what your own hidden factory looks like? Book a free loss audit.
Your Losses, Ranked by Real Dollar Impact
Most loss reports rank events by frequency. That is almost always the wrong lens. A loss that happens 80 times a day but takes 10 seconds each is worth far less than a loss that happens 3 times a week but takes 90 minutes. iFactory ranks every loss by its actual impact on OEE and its direct translation to lost revenue — so the first thing your team fixes is the thing worth fixing first.
01
Changeover Overruns
$184K / yr
4.2 hrs/wk lost · 52-min avg vs 35-min standard
02
Feed Jams on Line 3
$142K / yr
380 events/mo · avg clearance 2.8 min
03
Filler Speed Loss
$118K / yr
Running 89% of rated · compounds every shift
04
Startup Scrap (SKU-4482)
$67K / yr
12% first-pass reject after changeover
05
Labeler Minor Stops
$38K / yr
23 stops/shift · sensor trip recurring
06
Inspection Rework
$22K / yr
2.1% rework rate · trending upward
Top 3 losses = 78% of total OEE gap. Fix these first.
The Bottleneck That Never Stands Still
A bottleneck is not a place — it is a role that moves from station to station depending on product, speed, and conditions. At 9 AM it lives at the filler. By lunch it has migrated to the labeler. By night shift it is sitting on the palletizer. Traditional analysis finds the bottleneck of last quarter. AI tracks it live, all shift, every shift — so your team works on the constraint that is actually constraining, not the one that used to.
Filler
Warning — trending up
Labeler
Active bottleneck
Palletizer
Starved — waiting
AI Insight
Labeler is the line's rate-limiter right now. Downstream stations are 54–58% starved. Expected gain from resolving: +19% line throughput, +7.2 OEE points this shift.
Every Micro-Stop — Counted, Timed, Clustered
A 90-second jam feels too small to log. Thirty of them per shift is not. iFactory captures every state change regardless of duration — revealing the cluster patterns that tie invisible stops to a specific machine, hour of day, operator, or material batch. This is where most of the 8–15% hidden loss actually lives.
Line 3 · 8-Hour Shift
Micro-stop density over time
07:0009:0011:0013:0015:00
Short (<1 min)
Medium (1–3 min)
Long (3–5 min)
Cluster detected
Pattern Found
Two stop clusters around 09:30 and 12:45 — both correlate with SKU-4482 runs on Line 3. AI recommends investigating feed-auger calibration for this product family.
From Symptom to Root Cause — AI Walks the Tree
A reported symptom like "Line 3 OEE dropped 12%" is the start of a question, not an answer. iFactory's AI walks the loss tree automatically — correlating machine, material, man, and method variables until a single actionable root cause is identified. What takes a reliability engineer three days of investigation takes the system under two minutes.
Symptom
Line 3 OEE dropped 12%
Observed 14:32 shift
Availability
-1.1 pts
Stable · not the cause
Performance
-9.8 pts
Primary loss driver
Quality
-1.1 pts
Stable · not the cause
Machine
Feed auger speed drift
Detected over last 2 hrs
Material
Within spec
Batch verified
Method
No SOP deviation
Standard run
Root Cause
Auger bearing wear on Motor M-3
Correlates with vibration signature uptick over 72 hrs · 94% confidence
Recommended Action
Schedule bearing replacement within 48 hrs
Prevents ~4.2 hours of projected downtime · Work order draft ready
See a live loss tree built from your own production data. Book a 30-minute demo.
The Four Ms — Where Every Loss Hides
Every production loss traces back to one of four variables — Man, Machine, Material, or Method. Most plants only instrument the machine. iFactory's AI correlates all four, which is why it finds losses that human investigators miss: the operator shift that runs 8% slower, the specific lot of raw material that causes spikes in rejects, the changeover method that varies 30% between crews.
M
Man
Operator shift, crew composition, training level, and procedural adherence — correlated to OEE by individual and team.
"Night shift averages 6% below day shift on Line 2 — training gap on changeovers."
M
Machine
Condition signals, cycle deviation, micro-stops, and degradation patterns fused from every sensor on every asset.
"Bearing vibration trend on Motor M-3 driving 9.8 pt Performance loss."
M
Material
Input variability, lot-level behavior, supplier correlation, and SKU-specific loss patterns tracked across runs.
"SKU-4482 generates 12% startup scrap — consistent across 6 runs."
M
Method
Process parameters, recipe deviations, SOP adherence, and changeover variance timed to the second.
"Changeover averages 52 min vs 35 min standard — 48% overrun."
What Plants Actually Recover
+8–15 pts
OEE recovered within 6 months of enabling AI loss analysis
3x
More loss events captured vs. manual systems — every shift
< 2 min
From symptom detected to root cause identified by AI
80/20
Of losses trace to the top 3 causes — find them first
Frequently Asked Questions
What is AI-driven OEE loss analysis and how does it differ from standard reporting?
Standard OEE reporting tells you the score. AI loss analysis tells you the why. iFactory continuously captures every state change — down to single-digit-second micro-stops — then uses machine learning to correlate losses across machine signals, operator shifts, material lots, and process methods until the single actionable root cause is surfaced.
Book a demo to see it work on live data.
How much hidden loss does a typical plant actually have?
Research across thousands of manufacturing operations consistently shows 8–15% of total production time is lost to undetected micro-stops, speed losses, and bottleneck inefficiencies that manual systems cannot capture. One steel plant documented 12% of their annual capacity was invisible until automated tracking made it visible — that single insight translated to $2.3M in first-year recovery.
Can AI really find the bottleneck when it moves throughout the shift?
Yes — this is where AI significantly outperforms human analysis. iFactory calculates starvation and blocking states at every station in real time, identifying which asset is the current line constraint and how that role migrates as products, speeds, and conditions change. Static bottleneck analysis misses shifting constraints entirely; AI tracks every handoff.
How quickly does AI identify root causes compared to a human investigation?
A skilled reliability engineer typically needs 2–5 days to correlate data across maintenance logs, operator reports, and machine sensors for a single loss event. iFactory's AI completes the same correlation in under two minutes — and continues running analysis 24/7 across every line simultaneously. The engineer's job shifts from investigation to acting on prioritized findings.
Ask support about our root cause methodology.
Will this require replacing our existing OEE or MES system?
No. iFactory sits as an intelligence layer on top of whatever data sources you already have — PLCs, SCADA, MES, existing OEE tools. Most deployments run alongside current systems for the first 30 days, with AI insights augmenting (not replacing) your existing reporting. Migration is only done if and when your team decides to consolidate.
How does the ROI typically work out?
The math is straightforward: a 10-point OEE recovery on a single line typically unlocks 10–15% of existing capacity without any new equipment. For a plant generating $50M in annual production, that is $5–7M in incremental throughput against a platform cost that is a small fraction of one OEE point. Most customers validate full payback within 8–10 months.
Stop Guessing. Start Finding.
Every Plant Has a Hidden Factory. iFactory Shows You Exactly Where It Is.
Book a 30-minute walkthrough of iFactory's loss analysis engine on your own data — see your real bottlenecks, your invisible micro-stops, and the three root causes driving most of your OEE gap.
99.5%
Loss capture rate vs. 38% from manual logs
4 Ms
Correlated simultaneously for true root cause
5 Layers
Symptom to action tree walked automatically
6 Months
Typical time to 8–15 OEE point recovery