OEE, TEEP, OOE—if these acronyms are blurring together, you're not alone. Every manufacturing metric measures availability, performance, and quality—but the difference lies in what "available time" actually means. Choose wrong, and you'll optimize for the wrong goal. This guide breaks down each metric visually, shows you exactly when to use each one, and explains how tracking all three together reveals your plant's true potential.
Manufacturing KPIs Compared
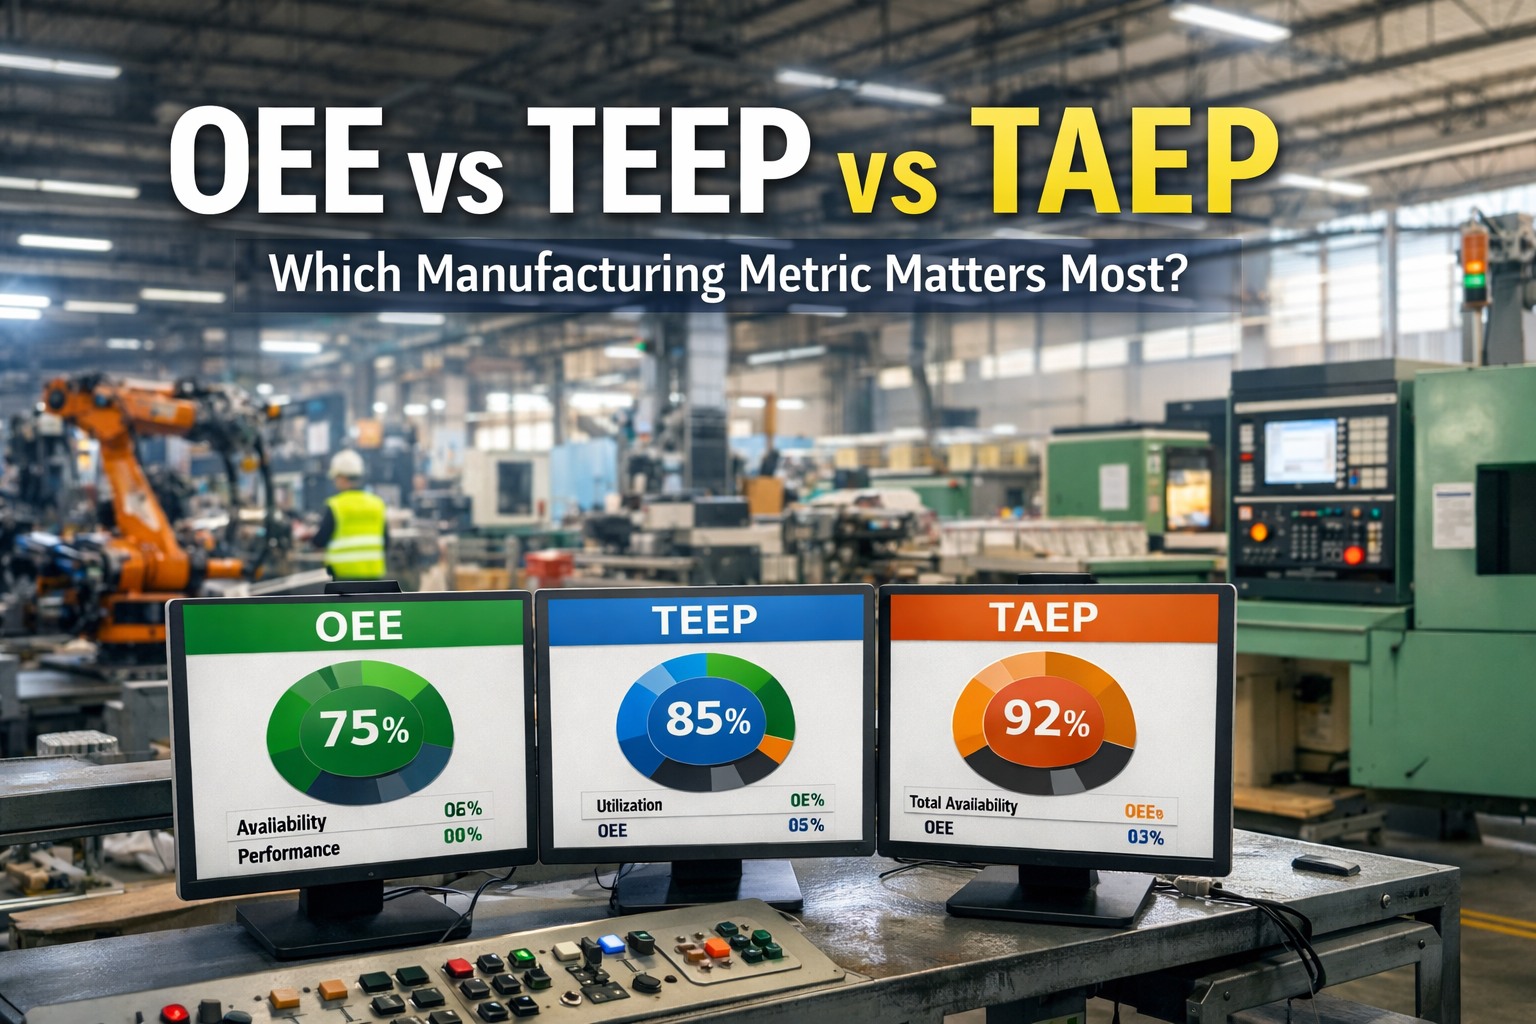
OEE vs TEEP vs OOE
Which Manufacturing Metric Matters Most for Your Goals?
The Core Difference: How Each Metric Defines "Available Time"
All three metrics multiply Availability × Performance × Quality. The only variable that changes is how you define availability. Think of them as nested layers—each one expands the time window you're measuring against.
TEEP: All Calendar Time (24/7/365)
OOE: Operating Time
OEE: Scheduled Production Time
OEE excludes planned downtime
OOE includes unscheduled time
TEEP measures against 24/7 max
Quick Comparison: OEE vs OOE vs TEEP
Here's the essential breakdown of what each metric measures, how to calculate it, and when it's most useful.
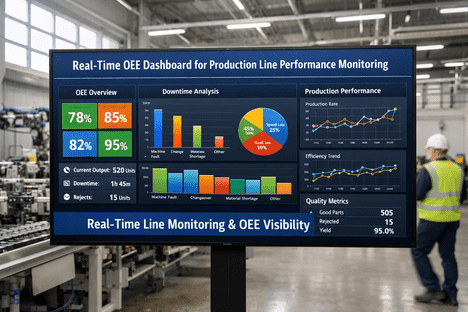
Track All Three Metrics on One Dashboard
iFactory calculates OEE, OOE, and TEEP automatically—giving operators real-time insights and executives strategic visibility.
Understanding Each Metric
"When we're scheduled to run, how well are we running?"
Availability: Run Time ÷ Planned Production Time
Performance: Actual Output ÷ Theoretical Max
Quality: Good Parts ÷ Total Parts
When to Use
Real-time monitoring, shift comparisons, identifying immediate improvement opportunities, benchmarking equipment performance
"How well are we using our operating hours?"
Availability: Actual Production ÷ Operating Time
Includes: Unscheduled downtime, changeovers
Falls between: OEE and TEEP
When to Use
Workforce planning, resource management, identifying if unplanned downtime is eating into operations
"What's our equipment's maximum potential capacity?"
Utilization: Scheduled Time ÷ All Calendar Time
Baseline: 24 hours × 7 days × 365 days
Reveals: Hidden factory capacity
When to Use
Capacity expansion decisions, investment justification, determining if you need new equipment vs. more shifts
Not sure which metric to prioritize? Book a demo and we'll help identify your biggest improvement opportunities.
Real-World Example: Same Equipment, Three Scores
Here's how the same production line can have vastly different scores depending on which metric you measure.
Scenario: Two-Shift Operation
Scheduled Production: 16 hours/day, 5 days/week = 80 hrs
Actual Run Time: 72 hours (8 hrs downtime)
Performance Rate: 92%
Quality Rate: 97%
OEE
90% × 92% × 97%
80%
Good operational performance
OOE
Accounts for changeover gaps
~72%
Room for tactical improvement
TEEP
80% × 48% utilization
38%
Significant hidden capacity
The 80% OEE shows the production team is performing well. The 38% TEEP reveals the equipment sits idle more than half the time—a strategic opportunity if demand exists.
When to Focus on Each Metric
You have production gaps or quality issues
Equipment frequently breaks down unexpectedly
You need daily/shift-level performance visibility
Operators need real-time feedback
Workforce planning needs improvement
Changeovers are eating into production time
You're optimizing shift schedules
Resource allocation is inefficient
You're considering capacity expansion
Evaluating if you need new equipment
Planning additional shifts or 24/7 operation
Justifying capital investments to leadership
Expert Perspective
"TEEP reveals that the fastest and cheapest way to increase output is often not buying new machines—but better utilizing the ones already installed. A modest TEEP improvement can unlock significant production capacity without additional capital investment."
— FlowFuse Manufacturing Analytics, 2025
85%
World-class OEE target
48%
Max TEEP for 2-shift ops
3
Metrics for full visibility
Ready to see your OEE, OOE, and TEEP in one view? Book a demo for a personalized walkthrough.
Frequently Asked Questions
What's the main difference between OEE and TEEP?
OEE measures effectiveness during scheduled production time—when you planned to run. TEEP measures against all available time (24/7/365), revealing how much of your total equipment capacity you're actually using. A plant can have 85% OEE (excellent) but only 40% TEEP because it only runs two shifts.
Which metric should I focus on first?
Start with OEE to fix operational issues. Once OEE is strong (75%+), examine TEEP for strategic capacity decisions. If OEE is already good but you're considering expansion, look at TEEP first—you may have hidden capacity available without buying new equipment.
What is a good TEEP score?
TEEP benchmarks vary dramatically by industry and shift strategy. Continuous process plants (24/7) target 80-90%. Two-shift operations typically see 40-60% TEEP—even with excellent operational performance, because the math caps at 48% theoretical max. Single-shift operations may see 25-35%.
Where does OOE fit in?
OOE sits between OEE and TEEP. It measures from shift start to shift end—including changeovers and unscheduled gaps that OEE excludes. Use OOE when you want to understand if workforce planning, resource management, or excessive changeovers are limiting your productivity.
Can I track all three metrics simultaneously?
Yes, and you should. Each metric answers different questions for different audiences. Modern analytics platforms like iFactory calculate all three from the same data source—giving operators real-time OEE visibility while providing executives strategic TEEP insights for capacity planning.
One Platform. All Your Manufacturing Metrics.
iFactory automatically calculates OEE, OOE, and TEEP—giving every stakeholder the right metric for their decisions, from the shop floor to the boardroom.