Most plants measure Overall Equipment Effectiveness the same way they did in 1984 — a clipboard, an end-of-shift spreadsheet, and a meeting on Thursday to argue about what the numbers actually meant. The result is an OEE score that is always a week late, always a little optimistic, and almost never tied to a specific action anyone can take before the next stop happens. The industry benchmark for world-class OEE has sat at 85% for four decades, and yet the average discrete manufacturer still operates between 55% and 65% — meaning roughly one-third of every scheduled production hour simply disappears. AI-driven OEE analytics finally closes that gap. Instead of reporting what already went wrong, it watches Availability, Performance, and Quality update second-by-second, flags the root cause before the shift ends, and hands the operator a corrective action while it still matters. Plants that make the switch report OEE gains of 15–25 percentage points within the first year — entirely without adding equipment, shifts, or headcount.
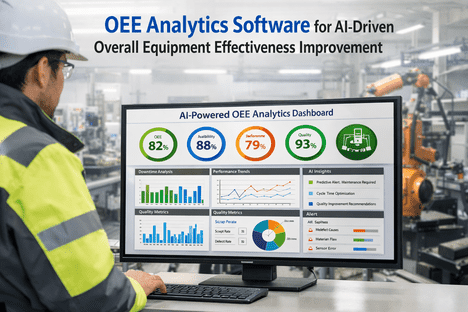
AI-Powered OEE Analytics Dashboard
OEE Analytics Software That Turns Production Data Into Daily Wins
Track Availability, Performance, and Quality in real time across every line — iFactory's AI engine surfaces root causes, predicts the next shift's OEE, and tells your team exactly what to fix before the score drops.
85%
World-class OEE benchmark for discrete manufacturing
15–25 pts
Typical OEE lift in first 12 months with AI analytics
$1.7M
Average cost of one hour of unplanned downtime
2 wks
Live dashboard on first production line — contract to data
Sources: Seiichi Nakajima (TPM, 1984) · Tractian 2026 · Excellerant Manufacturing Benchmarks · iFactory Deployment Data
The OEE Formula, Broken Open
OEE is a single percentage, but it is not a single thing. It is the product of three independent metrics — and knowing the score alone tells you almost nothing about what to fix. A plant running at 60% OEE could be 90/90/74 (a quality crisis) or 70/90/95 (a downtime crisis), and the corrective action in each case is completely different. iFactory decomposes every OEE score into its three drivers automatically, every second, so teams always know where to push.
Want to see your plant's A / P / Q breakdown live? Book a dashboard walkthrough.
Where Your Plant Sits on the OEE Ladder
There is a predictable path from paper-based tracking at 40% to automated, AI-driven excellence at 85%+. Most plants land somewhere in the middle — and most stay there because the leap from one tier to the next requires more than effort. It requires a new class of data. Here is where the journey goes, and what separates the tiers.
Manual tracking, clipboard logs, end-of-shift guesswork. Losses are under-reported and root causes are a mystery.
Basic digital OEE tracking. Dashboards exist but data lags by hours. Teams react to yesterday's problems, not today's.
Real-time OEE, automated loss categorization, Pareto analysis. Top losses known — but mitigation is still reactive.
AI-driven analytics with predictive OEE, automated root cause, and prescriptive action. Losses are prevented, not just logged.
The Six Big Losses — Mapped to Every Pillar
Every point of OEE you lose traces back to one of six specific causes defined in the TPM framework. iFactory's AI automatically categorizes every minute of lost production into the correct bucket — so your team stops arguing about why the line was down and starts fixing it.
Availability Losses
Biggest impact on: Uptime
01
Equipment Failure
Unplanned breakdowns and stoppages that halt production without warning. Usually the most visible loss category.
02
Setup & Changeovers
Planned stops for product changes, tool swaps, and machine adjustments. High-mix plants lose 20%+ of time here.
Performance Losses
Biggest impact on: Speed
03
Minor Stops & Idling
Jams, sensor trips, and 30-second interruptions that rarely get logged — the classic "hidden factory" loss.
04
Reduced Speed
Running below rated cycle time to avoid jams or quality issues. Silently erodes capacity every single shift.
Quality Losses
Biggest impact on: Yield
05
Startup Rejects
Scrap and rework produced between startup and stable running state. Often hides behind changeover losses.
06
Production Defects
Rejects and rework during steady-state production. Directly hits first-pass yield and customer satisfaction.
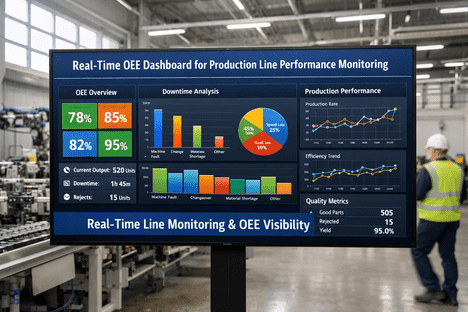
What Live iFactory Dashboards Actually Show You
A static OEE report tells you the race is over. A live OEE dashboard puts you inside the race. This is a snapshot of what operators and supervisors see when they open iFactory — every tile refreshes in real time, every number is clickable, and every anomaly is one tap away from the corrective action.
Overall OEE — Plant Rollup
78.4%
+3.2 pts vs. last shift
AI Alert · 14:32
Line 3 speed dropped 12% over last 20 min — recommend operator check on feed auger. Estimated OEE impact if unaddressed: -4.1 pts.
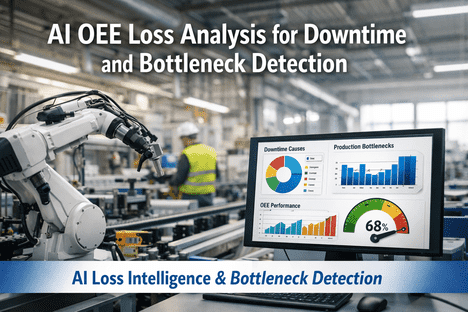
From Raw Signals to Prescriptive Actions
The difference between OEE analytics and OEE intelligence is whether the system tells you what happened or what to do about it. iFactory operates across all four layers — turning millions of raw data points into a single next-best-action your team can execute inside the shift.
04
Prescriptive
What should we do right now? AI recommends specific corrective actions with expected OEE impact.
"Reduce line speed 8% on Line 3 until torch tip replaced — prevents 42 min of downtime."
03
Predictive
What is going to happen? Forecast next-shift OEE based on equipment health and schedule.
"Thursday 2nd shift OEE predicted at 71% — vibration trend on Motor 3."
02
Diagnostic
Why did OEE drop? Automated root cause analysis with Pareto and waterfall breakdowns.
"62% of last week's availability loss traced to 3 changeover events on Line 2."
01
Descriptive
What happened? Real-time OEE score, A / P / Q breakdown, loss categorization.
"Plant OEE today: 78.4%. Availability 91%, Performance 90%, Quality 96%."
The Same Shift — With and Without AI Analytics
Here is how a single production shift actually plays out in each world. Same line, same crew, same product — two completely different outcomes, driven entirely by how quickly the plant sees and acts on OEE signals.
Without iFactory
The Traditional Shift
07:00
Shift starts. OEE from yesterday reviewed in morning huddle.
09:30
Line 3 micro-stops begin. Operator logs on clipboard.
11:45
Supervisor notices slowdown — no root cause visible.
14:00
Line goes down. 90 minutes to diagnose and repair.
15:30
Shift ends. OEE calculated tomorrow morning.
With iFactory
The AI-Powered Shift
07:00
Shift opens with live OEE dashboard and AI priority list.
09:32
AI flags Line 3 micro-stop pattern — operator notified instantly.
09:45
Root cause identified — feed alignment. Fix takes 6 minutes.
13:15
Bearing vibration trend detected — PM auto-scheduled.
15:30
Shift ends. OEE, losses, and gains visible to every stakeholder.
See exactly how this shift comparison would look on your lines. Schedule a 30-min demo.
What Real Teams Gain in 90 Days
+15–25 pts
OEE improvement within first 12 months of deployment
50%
Reduction in unplanned downtime through live anomaly alerts
3–5 days
To live OEE dashboard on your first production line
Zero
Clipboard hours — every loss captured automatically
Frequently Asked Questions
What is OEE analytics software and how is it different from a traditional OEE report?
OEE analytics software continuously collects data from your machines, calculates Availability × Performance × Quality in real time, and surfaces the root cause of every loss through AI models. Traditional OEE reports are manual, end-of-shift snapshots that tell you what already happened. Analytics software tells you what is happening right now and what to do about it.
Book a demo to see the difference live.
What is a good OEE score, and is 85% always the right target?
85% is the world-class benchmark for discrete, high-volume manufacturing, based on Seiichi Nakajima's original TPM research. Most plants realistically sit between 55% and 75%. The right target depends on your process — a high-mix, low-volume job shop may peak at 70–75% due to changeovers, while a continuous-process line can reach 90%+. Focus on improving your own baseline by 2–4 points per quarter rather than chasing a universal number.
Do we need to replace our existing machines to track OEE with iFactory?
No. iFactory connects to both modern PLCs and legacy machines using OPC-UA, MQTT, REST APIs, and plug-and-play IoT gateways. Even 1980s-era CNCs with only relay contacts or voltage signals can be integrated without modifying controllers. Most plants are fully connected without any hardware replacement.
How quickly can we start seeing OEE data after deployment?
A single production line typically goes live in 3–5 days. A full facility with multiple lines, SCADA integration, and custom dashboards is usually operational in 2–4 weeks. Multi-site rollouts complete in 6–10 weeks. iFactory is cloud-native, so there are no on-premise servers to provision.
Talk to our implementation team.
Can AI really identify root causes, or is it just another dashboard?
iFactory's AI engine correlates downtime events, cycle speed, quality deviations, vibration, temperature, and environmental data across hundreds of variables simultaneously. It surfaces causal patterns no human could spot in a Pareto chart — for example, linking a specific operator shift and product SKU combination to a 12% speed loss. Every finding is delivered in production language with a specific recommended action.
How does OEE analytics software pay for itself?
A 10-point OEE improvement on a single line typically unlocks 10–15% of existing capacity without new equipment. For a plant generating $50M in annual production, that is $5–7M of incremental throughput — against a platform cost that is a small fraction of one point of OEE. Most iFactory customers validate full ROI within 90 days of go-live.
Stop Measuring Yesterday. Start Winning Today.
Your OEE Is Hiding 15 Points in Plain Sight. Let AI Find Them.
iFactory's OEE analytics platform turns raw machine data into live Availability, Performance, and Quality scores — plus the root cause and next best action your team needs to act on them before the shift ends.
3 Pillars
Availability, Performance, Quality — tracked live
6 Losses
Auto-categorized every minute of lost production
4 Layers
Descriptive to prescriptive intelligence stack
90 Days
Typical time to validated full-platform ROI