Every manufacturing plant has hidden capacity—time, speed, and quality losses that silently drain your bottom line. The typical factory operates at just 60% OEE, meaning 40% of potential production is lost every single day. The difference between manufacturers who thrive and those who struggle? Real-time visibility. This guide breaks down what OEE really means, why the three-factor formula matters, and how real-time tracking transforms reactive firefighting into proactive optimization.
Manufacturing KPIs Explained
What Is OEE?
The Single Metric That Reveals Your Plant's True Potential
$260K
Avg Downtime Cost/Hour
OEE: The Manufacturing Gold Standard
OEE stands for Overall Equipment Effectiveness—a metric developed by Seiichi Nakajima as part of Total Productive Maintenance (TPM) in the 1980s. It answers one critical question: what percentage of your scheduled production time is actually producing quality output at full speed?
OEE measures how effectively equipment converts scheduled production time into quality output. A 100% OEE means you're producing only good parts, as fast as possible, with zero downtime.
OEE = Availability × Performance × Quality
The Three Pillars of OEE
Each OEE component targets a specific type of production loss. Understanding these three factors helps you diagnose exactly where your plant is bleeding efficiency—and where to focus improvement efforts.
Is the machine running?
Run Time ÷ Planned Production Time
Losses include:
Equipment breakdowns
Changeover & setup time
Material shortages
Is it running at full speed?
(Ideal Cycle Time × Total Count) ÷ Run Time
Losses include:
Reduced speed operation
Minor stops (<5 min)
Idling and hesitation
Are parts meeting spec?
Good Count ÷ Total Count
Losses include:
Production defects
Startup rejects
Rework required
Not sure where your biggest OEE losses are hiding? Get a free OEE assessment from our manufacturing experts.
OEE Calculation Example
Let's see how OEE works with real numbers. Even small losses in each component compound significantly—which is why tracking all three factors matters.
Example: 8-Hour Shift
Planned Time:480 minutes
Downtime:50 minutes
Ideal Cycle:1 min/part
Parts Made:400 parts
Defects:8 parts
Availability
(480-50) ÷ 480
89.6%
×
Performance
(1×400) ÷ 430
93.0%
×
=
Even with "good" numbers in each category (89%, 93%, 98%), you're still losing 18.4% of potential production.
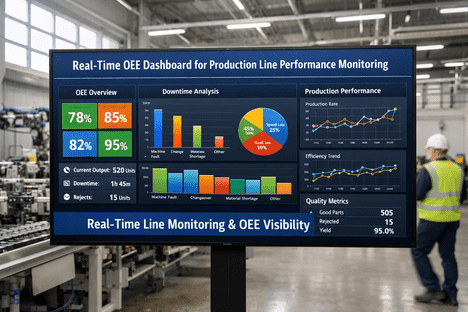
Why Real-Time Tracking Beats End-of-Shift Reports
The difference between knowing your OEE was 65% yesterday and seeing it drop to 65% right now is the difference between analysis and action. Real-time tracking transforms OEE from a historical report into an operational tool.
Stop Guessing. Start Knowing.
iFactory's real-time OEE dashboards show availability, performance, and quality the moment they change—so your team can act before losses compound.
OEE Benchmarks: Where Do You Stand?
OEE benchmarks vary by industry. Use these as targets, not absolutes—your specific process complexity, product mix, and equipment age all factor into what's achievable.
Below 60%Significant losses
60-75%Typical range
75-85%Above average
85%+World-class
Medical Devices78%
Electronics80%
Automotive75%
Food & Beverage72%
Discrete Mfg67%
Want to know how your OEE compares to industry leaders? Schedule a benchmarking session with our team.
The Six Big Losses Framework
TPM identifies six loss categories that drain OEE. Every production problem falls into one of these buckets—making it easier to categorize, prioritize, and address systematically.
1Equipment Breakdowns42% of downtime
2Setup & Changeover29% of losses
3Minor StopsOften undercounted
4Reduced SpeedHidden capacity loss
5Startup DefectsWarmup scrap
6Production DefectsSteady-state rejects
Expert Perspective
"Most manufacturers focus on breakdowns because they're visible. But small stops and reduced speed often account for 40-50% of total losses—despite being far less obvious. Real-time tracking exposes these hidden losses that manual methods consistently miss."
— OEE Industry Best Practices, 2025
$1.4T
Global downtime cost (Fortune 500)
800
Hours downtime/year avg
11%
Revenue lost to downtime
Ready to uncover your hidden losses? Talk to our OEE specialists about automated tracking.
Frequently Asked Questions
What is a good OEE score?
An OEE of 85% is considered world-class for discrete manufacturing. Most plants operate between 60-75%. However, "good" depends on your industry—automotive assembly targets 85-92%, while custom fabrication may consider 70% excellent. Focus on continuous improvement from your current baseline rather than arbitrary targets.
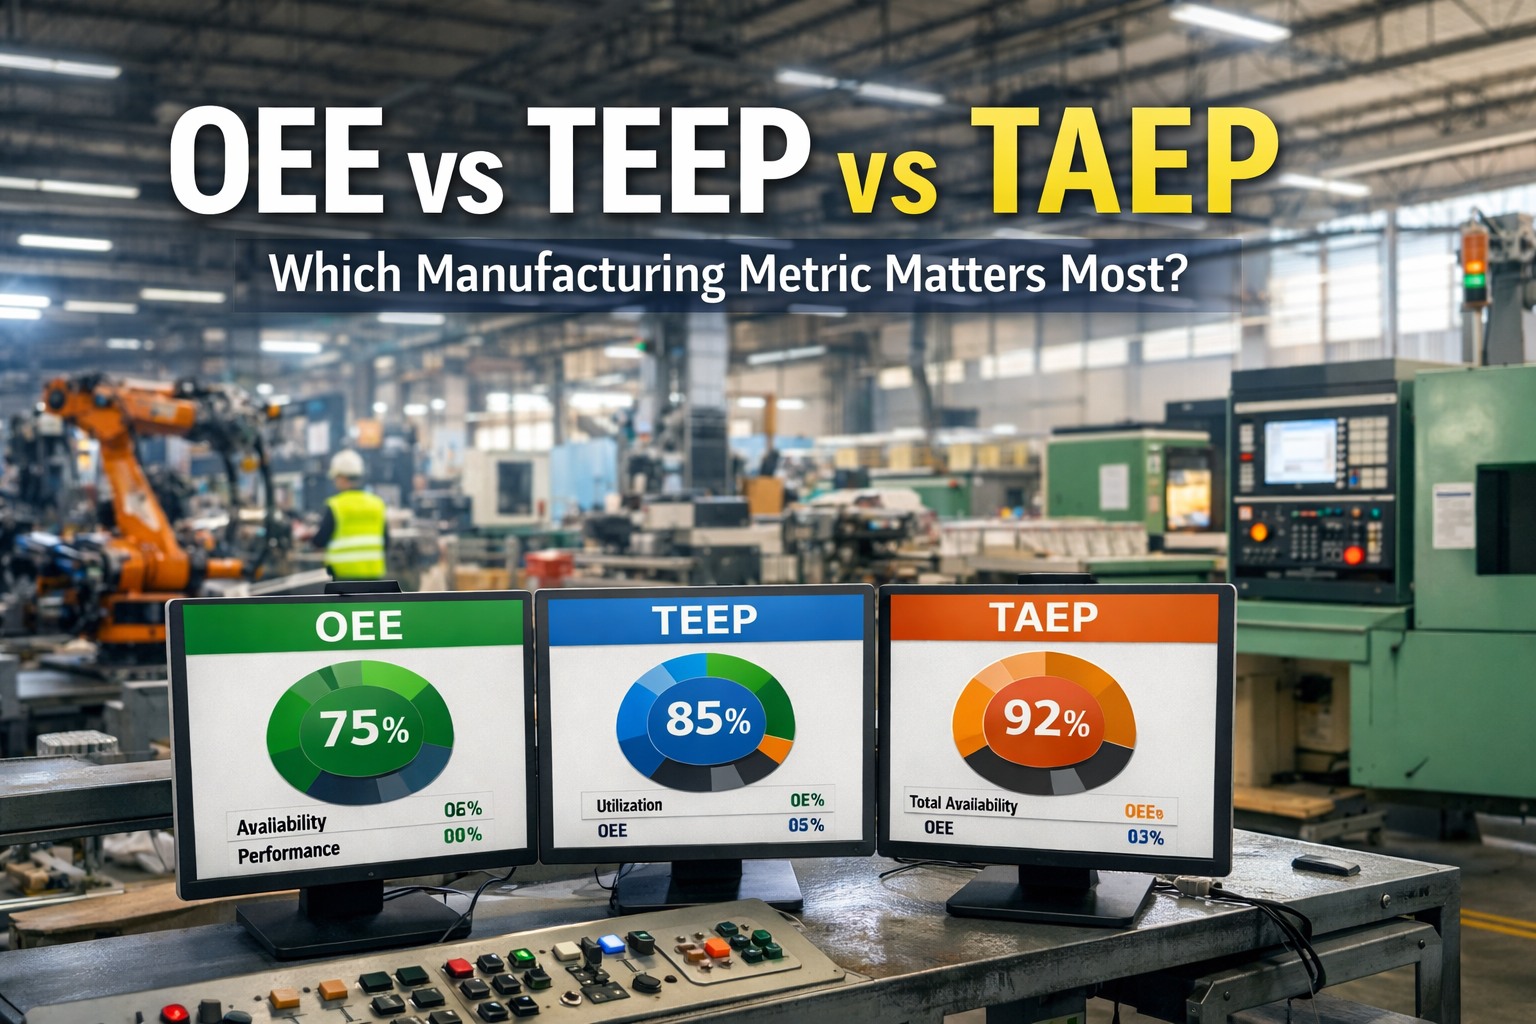
What's the difference between OEE and TEEP?
OEE measures effectiveness during scheduled production time. TEEP (Total Effective Equipment Performance) measures total calendar time—24/7/365. TEEP = OEE × Loading Factor. Use OEE for process improvement; use TEEP for capacity planning and asset investment decisions.
How often should we calculate OEE?
With automated systems, OEE should be calculated and displayed in real-time. For manual tracking, calculate per shift at minimum. Daily tracking helps spot trends; weekly and monthly rolls ups inform strategic decisions. The more frequently you measure, the faster you can respond to losses.
Why does manual OEE tracking miss so many losses?
Manual tracking relies on operators remembering and recording every stop. Micro-stops under 5 minutes are frequently missed because they seem insignificant—but they add up to hours of lost production. Manual logs also lag by hours or days, making root cause analysis difficult. Automated sensors capture every event instantly.
Can OEE exceed 100%?
Yes, if equipment runs faster than the "ideal cycle time" you've set. This usually means your ideal cycle time is too conservative and should be updated to reflect actual capability. When OEE consistently exceeds 100%, recalibrate your standards and continue improving from the new baseline.
Turn OEE Data Into Action
iFactory's AI-powered platform delivers real-time OEE tracking, automatic loss categorization, and predictive maintenance—so you can move from measuring problems to preventing them.