A production line at 2:47 PM is a different machine than it was at 2:45 PM. In those two minutes the feed rate can drift, a bearing can start whining, a downstream jam can form, and a quality drift can begin that won't be visible in the morning's report until Tuesday. The tragedy of most OEE programs is that by the time a human sees the number, the moment to act on it is already gone. The industry has moved past dashboards that refresh hourly — that is reporting, not monitoring. A genuine real-time OEE dashboard updates every second, reaches the person who can actually fix the problem, and compares the current shift against where it should be at this exact point. When operators, supervisors, and plant managers finally see the same live truth on the same screen, the feedback loop between signal and corrective action collapses from 24 hours to under 60 seconds. That single change is worth more than any new piece of equipment you could buy this year.
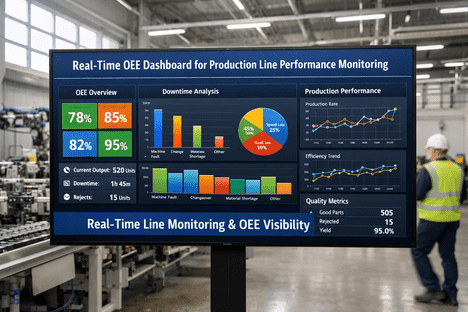
Real-Time Line Monitoring & OEE Visibility
See Every Line, Every Shift, Every Second — Before Small Problems Become Production Crises
iFactory's real-time OEE dashboards turn your production floor into glass — live availability, performance, and quality updates every second, with instant alerts the moment a line starts drifting from target.
1 sec
Dashboard refresh rate — from shop floor to screen
< 60 sec
From anomaly detection to alert on operator screen
3 sec
Time for a glance at the dashboard to grasp plant status
140+
Pre-built metrics accessible through drill-down views
Sources: TEEPTRAK Dashboard Research · Factbird Production Data · iFactory Deployment Benchmarks 2026
Why "Real-Time" Actually Matters
Most OEE tools call themselves real-time. Very few actually are. The difference between a one-hour refresh and a one-second refresh is not cosmetic — it is the difference between reacting to problems and preventing them. Here is how quickly different monitoring systems deliver the bad news to the person who could have fixed it.
Paper Logs
Clipboard + Spreadsheet
24+ hrs
End-of-Shift Reports
Daily dashboard refresh
8 hrs
Hourly Batch Dashboards
Basic MES monitoring
60 min
Per-Minute Refresh
Entry-level IoT dashboards
1 min
iFactory Real-Time
Second-by-second streaming
1 sec
Bar length = time between event occurring and becoming visible to the person who can fix it
Find out what your current monitoring latency actually is. Book a free assessment.
Your Live Plant Floor, At a Glance
When an iFactory dashboard is running on your shop floor display, here is what anyone walking past sees in three seconds — overall plant pulse, every line's current status, and any active anomaly in need of attention. Color, motion, and a single dominant number do the cognitive work so operators don't have to hunt for meaning.
Plant OEE Right Now
79.6%
Shift Target: 82%
Line 1 · Packaging
Running
Line 3 · Mixing
Stopped · 4m 12s
One Dashboard, Three Different Views
A screen that is useful for an operator is a distraction for a plant director, and vice versa. iFactory gives every role the exact level of detail they need to do their job — and nothing else. Here is what each person sees when they open the same underlying system.
01
Operator View
On the line. Needs to act on this shift.
My Line · OEE
87%
Target 85%
Good Parts1,284
Cycle Time4.2s
Shift Progress61%
Log Downtime Reason
Current line OEE vs. shift target
Stop reason entry with one tap
Live cycle time and good count
02
Supervisor View
Walking the floor. Needs to prioritize.
Alert · Line 3 feed jam · 4m
Active Alerts2
Shift vs. Target-2.4 pts
All lines at a glance with status colors
Active alerts ranked by business impact
Shift-vs-target deviation for the whole area
03
Plant Director View
In the office. Needs to strategize.
Plant Rollup · MTD
78.4%
+3.1 vs. last month
Top LossChangeovers
Best ShiftNight · 82%
Plant-level rollup with period comparisons
Trend analytics and loss Pareto charts
Cross-site and cross-shift benchmarking
What a Proper OEE Dashboard Must Display
Dashboards fail not for lack of data but from excess of useless information. A screen with 50 KPIs tells the operator nothing. A screen with the right seven tells them everything. These are the non-negotiables — every iFactory dashboard ships with them out of the box.
01
Live OEE vs. Target
Current percentage updating every second, compared against where the line should be at this exact point in the shift.
02
A / P / Q Breakdown
Availability, Performance, and Quality split separately — because the single percentage tells you how much, not where.
03
Active Downtime Clock
The moment a machine stops, the elapsed stop time is displayed — visible to every role who needs to respond.
04
Downtime Pareto
Ranked list of stop reasons by frequency and duration — the prioritization tool for every improvement meeting.
05
Shift Trend Line
Minute-by-minute OEE evolution during the current shift — so the team can see exactly when performance degraded.
06
Line vs. Line Compare
Which line is winning right now? Which shift is consistently best? Lateral comparison drives peer learning.
07
One-Tap Reason Codes
The operator interface for logging stop causes must be usable without training — zero-training is the standard.
From Signal to Action — In Under a Minute
A dashboard that shows a problem without routing it to the right person is just wall art. iFactory closes the loop between detection and response automatically — every alert reaches the correct role with the correct context, and every response is logged back for future pattern analysis.
00:00
Signal Captured
Sensor, PLC, or SCADA event streams to iFactory edge gateway — cycle deviation, stop, or threshold breach.
00:02
Dashboard Updates
Plant overview reflects new state. OEE, line status, and stop clock refresh on every connected screen.
00:08
AI Classifies & Prioritizes
Anomaly scored against baseline. Severity and estimated OEE impact calculated automatically.
00:15
Right Person Alerted
Operator, supervisor, or technician receives push, SMS, or email — with context and recommended action.
00:45
Response Captured
Corrective action logged, downtime reason coded, outcome fed back into the AI model for future detection.
Real-Time vs. Traditional Monitoring — Side by Side
Same plant, same equipment, two approaches. The only variable is the speed at which signal reaches action.
Capability
Traditional Monitoring
iFactory Real-Time
Data Refresh
End of shift or daily
Every second
Downtime Detection
Noticed by supervisor rounds
Auto-flagged within seconds
Alert Delivery
Radio call or walk-over
SMS, push, email, TV alert
Stop Reason Capture
Clipboard, end-of-shift memory
One-tap touchscreen at the line
Multi-Line Visibility
Separate reports per line
Single unified dashboard
Role-Based Views
Everyone sees the same report
Operator / Supervisor / Director
Benchmarking
Manual spreadsheet compare
Live cross-line, cross-shift, cross-site
Ready to see both side by side in your own plant? Book a 30-minute demo.
What Teams Gain After Go-Live
+27%
Average OEE improvement reported within first year of live monitoring
60%
Faster response to production anomalies with automated alerting
1 hr
Typical sensor installation time per production line — zero disruption
Zero
Clipboards, paper logs, or end-of-shift spreadsheets required
Frequently Asked Questions
What is a real-time OEE dashboard and how often does it actually update?
A real-time OEE dashboard displays live Availability, Performance, and Quality metrics with continuous second-by-second refresh from production machines. iFactory updates machine state every 2 seconds and full OEE calculations every 30 seconds, so operators see issues develop as they happen — not hours later in a report.
Book a demo to see the refresh rate live.
Can the dashboard connect to older machines without modern PLCs?
Yes. iFactory uses a combination of OPC-UA, MQTT, Modbus TCP, and non-intrusive wireless sensors (current, vibration, photoelectric counters) to connect machines of any age — including 1980s CNCs with only relay contacts or RS-232 output. Legacy equipment typically comes online within one hour per line with zero controller modifications.
Who should see the dashboard — just managers, or the entire team?
Everyone, with role-appropriate views. Operators need their own line's live OEE against shift target. Supervisors need all lines in their area plus active alerts. Plant directors need trend analytics and cross-site comparison. The most impactful deployments put a large screen on the shop floor so every operator sees their line's live score — accountability and motivation follow automatically.
What happens if our network drops? Do we lose monitoring?
No. iFactory edge gateways buffer all production data locally and sync to the cloud once connectivity restores. Shop floor displays can run on local servers so they remain visible even during network outages. You never lose a data point or a dashboard view.
Ask support for network architecture details.
How quickly can we go from contract to live dashboard?
A single production line is typically live within 3 to 5 days — wireless sensors install in under an hour and basic dashboard configuration takes one business day. Full multi-line facilities with SCADA integration complete in 2 to 4 weeks. No servers, no long IT projects.
How is this different from a Grafana or Power BI dashboard?
Grafana and Power BI are visualization tools — they display whatever data you manage to pipe into them. iFactory is a complete production intelligence platform: machine connectors, edge gateways, OEE calculation engine, downtime taxonomy, AI anomaly detection, alert routing, and dashboards as one integrated system. With Grafana you are building infrastructure; with iFactory you are running a plant.
Stop Flying Blind. Start Flying Live.
Your Plant Is Already Producing the Data. iFactory Just Makes You See It.
Deploy a real-time OEE dashboard on your first line in 3 to 5 days — no new equipment, no IT project, no long learning curve. Just live truth on a screen where it matters.
1 Second
Dashboard refresh from floor to screen
3 Views
Operator, supervisor, director — tailored
7 Metrics
Non-negotiable KPIs on every screen
3–5 Days
From contract to live dashboard