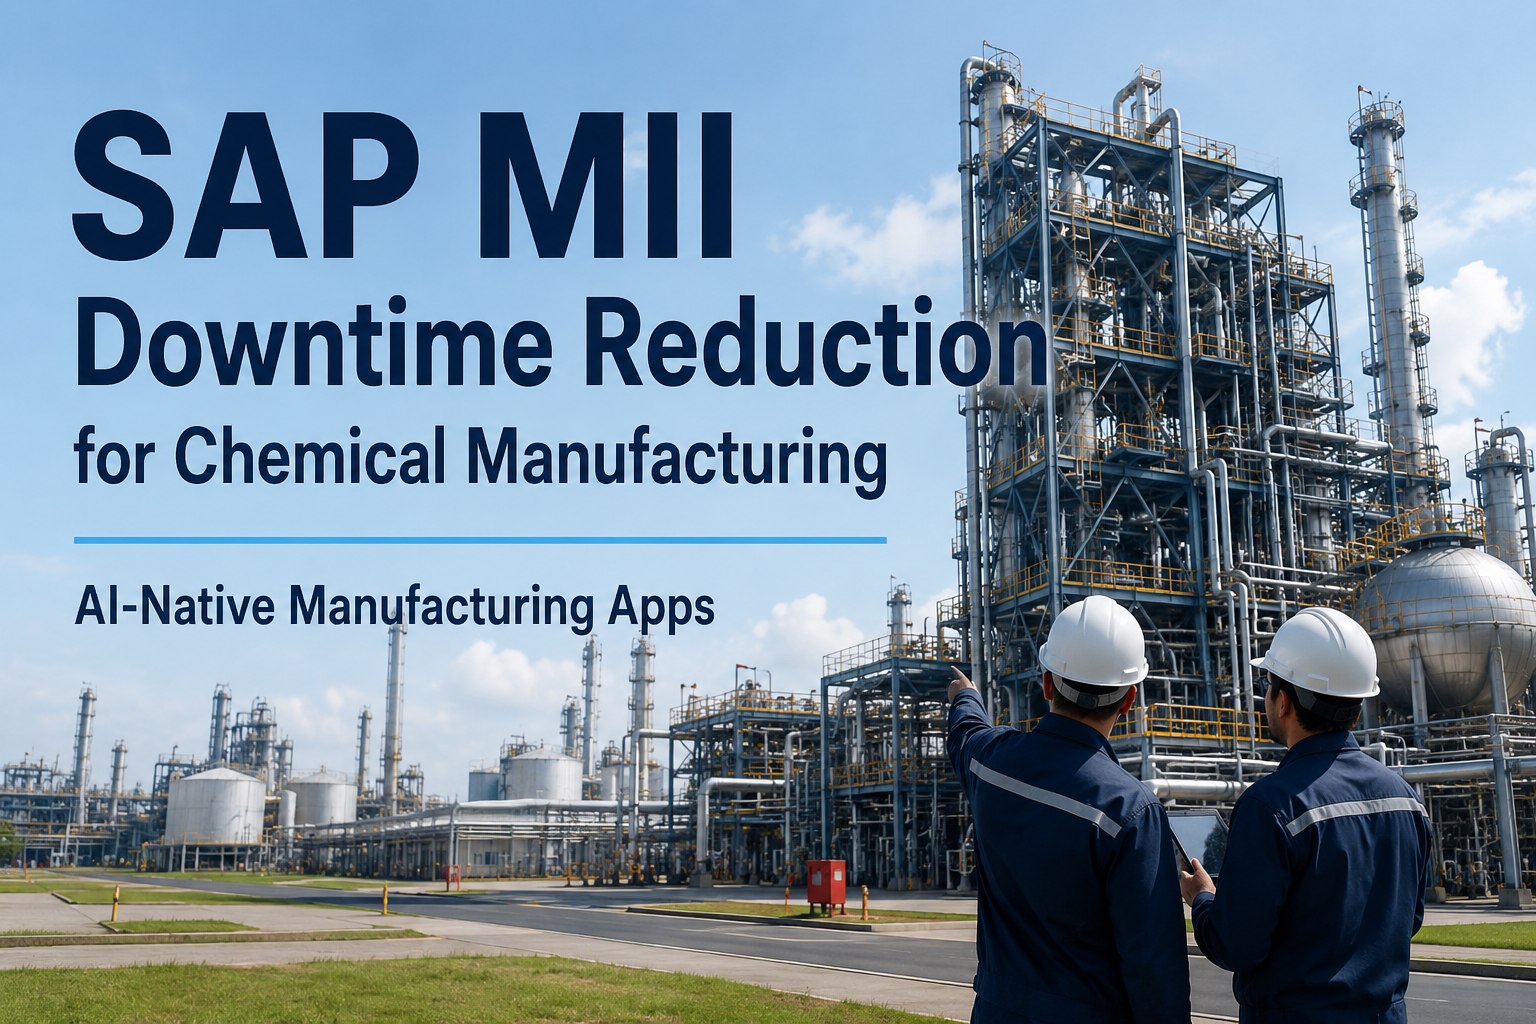
Unplanned downtime in chemical manufacturing has a particular character that does not exist in most other industries. A pump failure on a feed line does not just take that pump offline — it can starve a downstream reactor, which feeds a distillation column, which feeds a heat exchanger, which serves three product lines. One small failure ripples through interconnected units in minutes. Across the global chemical industry, this cascade dynamic drains roughly $20 billion annually in unplanned downtime costs, with 82% of plants experiencing at least one unplanned shutdown in the past three years. The painful part is that most of these failures announce themselves weeks in advance — through vibration shifts, temperature creep, acoustic anomalies, and current-draw drift — but legacy SAP MII analytics cannot hear them. This page is a clear, technical walk-through of how AI-native manufacturing apps actually predict chemical plant failures, where the value comes from, and what the migration from SAP MII looks like in practice. Book a 30-minute working session to discuss your specific reactor, pump, compressor, and heat-exchanger fleet.
$20B
Annual unplanned downtime cost across the global chemical manufacturing industry
82%
Of chemical plants have experienced at least one unplanned shutdown in the past 3 years
7–21
Days of failure forewarning AI achieves with 89% average prediction accuracy
25–40%
Lower maintenance costs reported across AI-native deployments in chemical plants
The Downtime Cascade: Why Chemical Plants Fail Differently
In a discrete manufacturing plant, a machine fails and that machine stops. The next machine waits. The line stops. Inventory absorbs the gap until the line restarts. In a chemical plant, the same starting event has a fundamentally different propagation pattern — because chemical processes are interconnected continuous flows of material, heat, and pressure across dozens of unit operations.
Below is what a single pump failure looks like as it cascades through a typical specialty-chemical plant. Each step takes seconds to minutes. The full cascade can put an entire product line offline in under an hour.
T+0
Feed pump bearing fails on a centrifugal pump serving the primary reactor
Flow rate drops abruptly; pressure transmitter on the downstream side flags the change in seconds
T+2 min
Reactor temperature drifts as feed composition changes
Reaction kinetics shift; conversion drops; off-spec product begins forming inside the reactor mass
T+8 min
Distillation column overhead composition shifts toward heavier fractions
Reflux ratio adjusts automatically; bottoms quality deteriorates; analyzers begin flagging product spec deviations
T+15 min
Heat exchanger duty rises as cooling demand changes
Cooling water flow increases; utility system strains; downstream condenser performance degrades
T+25 min
Operator escalates; safety interlocks begin to activate
Process stabilization attempts fail; emergency shutdown sequence initiated to protect equipment and personnel
T+45 min
Full unit shutdown; downstream packaging and shipping affected
Off-spec material requires reprocessing or disposal; restart will take 12–48 hours minimum depending on chemistry
The total financial impact of this one cascade often runs into hundreds of thousands of dollars: lost production, off-spec material, restart energy costs, expedited parts shipping, overtime labor, and customer commitment risk. The same bearing wear that triggered the cascade was probably detectable 7–21 days earlier with the right sensors and the right analytics.
The Cascade Is Not Inevitable. It Is the Predictable Result of Late Detection.
When predictive analytics catch bearing wear two weeks ahead of failure, the cascade never happens. The pump is replaced during planned downtime. The reactor never destabilizes. The product never goes off-spec. The shutdown never propagates. This is what AI-native predictive maintenance actually delivers in chemical plants.
The Six Equipment Categories That Drive Chemical Plant Downtime
Not every asset in a chemical plant deserves equal predictive attention. The cascade-driver equipment — the ones whose failure propagates fastest and farthest — fall into six categories. Each category has its own failure signatures, sensor mix, and AI model approach. Understanding the per-category pattern is how plants build a focused predictive maintenance program instead of an indiscriminate "monitor everything" approach.
CATEGORY 01
Reactors (CSTR, PFR, Batch)
Asset criticality: Highest
The heart of the chemical process. Failure causes immediate off-spec production, possible runaway risk, and extended restart. Failures often originate in agitator seals, jacket cooling, instrumentation drift, or fouling.
Sensors: Temperature multi-point, pressure, agitator current, vibration on shaft, jacket flow, conversion analyzers
Model approach: Multivariate anomaly detection, conversion deviation models, fouling progression LSTM
Typical forewarning: 14–21 days for seal degradation, 3–7 days for fouling acceleration
CATEGORY 02
Centrifugal Pumps & Positive Displacement Pumps
Asset criticality: High
The most common source of cascade-initiating failures. Bearing wear, seal failures, cavitation, and impeller damage account for the majority of chemical plant pump outages. Predictive maintenance on pumps is the highest-ROI single use case in most chemical plants.
Sensors: Vibration (radial and axial), motor current, suction/discharge pressure, bearing temperature, acoustic
Model approach: Vibration signature classification, remaining-useful-life regression, cavitation detection
Typical forewarning: 7–21 days for bearing wear, 7–14 days for seal degradation; 91% accuracy in benchmark deployments
CATEGORY 03
Compressors (Centrifugal, Reciprocating, Screw)
Asset criticality: Highest
Compressor failure typically forces complete unit shutdown. Hyper compressors in polymer plants, refrigeration compressors in cold reactors, and recycle compressors in continuous processes all sit on the critical path. Long lead times for major repairs make predictive forewarning especially valuable.
Sensors: Vibration multi-axis, temperature on bearings and motor, suction/discharge pressure, valve activity, current draw
Model approach: Frequency-domain vibration analysis, thermodynamic anomaly detection, valve wear modeling
Typical forewarning: 4 weeks possible for hyper compressors (Borealis Stenungsund example with Aspen Mtell); 14–21 days typical
CATEGORY 04
Heat Exchangers
Asset criticality: Medium-High
Fouling, tube degradation, and gasket failures progress slowly but inevitably. Predictive analytics catch fouling progression early, allowing cleaning to be scheduled during planned downtime rather than after a heat-duty cliff forces a shutdown.
Sensors: Inlet/outlet temperatures both sides, pressure drop across each side, flow rates, fluid properties
Model approach: Fouling resistance modeling, U-coefficient trend analysis, tube leak detection
Typical forewarning: 7–14 days for fouling progression; 92% accuracy on benchmark deployments
CATEGORY 05
Distillation Columns & Towers
Asset criticality: High
Tray flooding, weeping, tray damage, and reflux system issues degrade separation efficiency gradually. AI monitoring catches efficiency drift before it forces capacity reduction or product spec violations.
Sensors: Tray-by-tray temperature and pressure, reflux flow, reboiler duty, overhead/bottoms composition
Model approach: Efficiency deviation models, flooding precursor detection, composition drift analysis
Typical forewarning: 7–14 days for tray flooding; 14–28 days for gradual efficiency loss
CATEGORY 06
Control Valves & Instrumentation
Asset criticality: Medium
Control valves stick, leak, or oscillate. Instruments drift. Both produce control loop degradation that operators compensate for manually until the loop becomes unmanageable. AI catches the early drift and stuck-valve signatures.
Sensors: Valve position feedback, controller output, process variable, valve stem friction, positioner diagnostics
Model approach: Valve diagnostics modeling, control loop performance index, stiction detection
Typical forewarning: 7–14 days for stiction onset; 85% accuracy on control valve diagnostics
How AI Actually Predicts Chemical Plant Failures
The mechanics of AI predictive maintenance are not magic. They are a specific stack of sensors, signal processing, machine learning models, and decision logic that together produce reliable failure forecasts. Below is what each layer does and why it matters.
01
Multi-Modal Sensor Capture
Vibration sensors (accelerometers and velocity sensors), temperature probes (RTDs, thermocouples), pressure transmitters, current transformers on motors, acoustic emission sensors, and process variables from the existing DCS or PLC system. The richness of the sensor mix determines the upper bound on prediction accuracy.
02
Edge Signal Processing
Raw sensor streams are processed at the edge to extract meaningful features — FFT spectra from vibration, statistical features from temperature trends, harmonic content from current waveforms. Feature extraction at the edge keeps the central analytics layer focused on patterns, not raw bytes.
03
Machine Learning Models by Failure Mode
LSTM networks for time-series degradation patterns. Anomaly detection algorithms (Isolation Forest, autoencoders) for deviation from normal. Vibration signature classifiers trained on labeled failure libraries. Each failure mode gets the model architecture best suited to its signature — not a single model trying to handle every problem.
04
Failure Probability & RUL Estimation
Models output two things: probability of failure within a forecast window (next 7, 14, 30 days) and remaining useful life estimate with confidence intervals. Both are surfaced with the contributing factors so reliability engineers can validate or override the prediction.
05
Auto-Generated Work Orders & CMMS Integration
Predictions flow bi-directionally into SAP PM, IBM Maximo, Infor EAM, or Oracle EAM via API. Predictive alerts auto-generate work orders with failure mode diagnosis, recommended parts, and urgency level. Maintenance completion data flows back to validate predictions and improve models.
Real-Time Sensors. Edge Processing. Failure-Mode-Specific Models. Bi-Directional CMMS Integration.
That is the complete predictive maintenance stack — not just "AI." Chemical plants achieving the best results across pumps, compressors, heat exchangers, and reactors are running this full architecture, not a single bolt-on tool. iFactory delivers all five layers as a single integrated platform.
Why SAP MII Cannot Deliver This — and What Has to Change
SAP MII can ingest sensor data. It can display KPIs. It can fire threshold-based alerts. What it cannot do is run the multi-modal, model-based, failure-specific predictive analytics that chemical plants need to break the downtime cascade. Below are the four specific gaps and what AI-native architecture changes about each.
01
Univariate thresholds vs. multivariate signatures
MII alert rules typically watch one tag at a time. Real chemical equipment failures show multivariate signatures — vibration plus temperature plus current draw plus pressure all drifting together. AI models look at the full pattern; thresholds miss it until threshold breach, by which point the cascade is already starting.
02
No native machine learning runtime
MII has no built-in LSTM, anomaly detection, or signature classification capability. Bolt-on integrations exist but add complexity, validation burden, and operational fragility. AI-native platforms run these models natively with full audit trail and model lifecycle management.
03
Static rule sets vs. continuous learning
MII rules are written once and stay static. AI models learn from every failure that occurs, every maintenance intervention, every false positive. Models that started at 80% accuracy reach 90%+ as they absorb plant-specific patterns. Static rules never improve.
04
Limited bi-directional CMMS integration
MII can write to CMMS but typically through custom BLS transactions. AI-native platforms ship with native bi-directional integration to SAP PM, IBM Maximo, Infor EAM, and Oracle EAM, complete with feedback loops that improve future predictions.
The Value Anatomy: Where the ROI Actually Comes From
Chemical plants implementing AI-native predictive maintenance typically report 200–400% ROI within 12–18 months, with payback periods of 8–14 months for mid-size plants of 500–1,500 assets. The value comes from three sources in specific proportions — knowing the breakdown helps make a defensible business case.
60–70%
Unplanned Downtime Reduction
The largest component of ROI by a wide margin. Avoiding cascading shutdowns through early prediction is where the real money sits. A single avoided cascade can deliver six- or seven-figure savings depending on plant size and chemistry.
25–30%
Maintenance Cost Savings
Eliminating the roughly 50% of preventive maintenance that is unnecessary, reducing emergency repair premiums, optimizing parts inventory, and shifting from emergency to planned crew schedules.
5–10%
Equipment Life Extension
Operating equipment in optimal conditions, replacing components at the right time (not too early, not too late), and avoiding the damage that runs-to-failure inflict on adjacent assets. Smaller share, but compounding over years.
What Each Role in the Chemical Plant Actually Experiences
The change predictive maintenance brings is felt differently across roles. Below is the practical view from each person on a typical chemical plant team when SAP MII analytics are replaced with AI-native predictive maintenance.
CONTROL ROOM OPERATOR
Asset health is visible in the same dashboard as process state.
Operators see equipment health scores alongside process KPIs. Anomalies appear before they trigger DCS alarms. Context comes with the alert — similar past events, recommended actions, projected progression.
RELIABILITY ENGINEER
Sees the population, not just individual assets.
Population health dashboards show fleet-wide patterns — which pump model is degrading faster, which heat exchanger family fouls earlier. Reliability strategy moves from anecdotes to data.
MAINTENANCE LEAD
Work order queue prioritized by failure probability, not gut feel.
The morning meeting starts with the AI-ranked work order list. Emergency calls drop. Overtime drops. Parts inventory turns better because demand is predictable seven to twenty-one days ahead.
PROCESS ENGINEER
Sees process drift correlated with equipment health.
Yield, energy, and product quality KPIs are correlated with underlying equipment health. "Why is conversion down 1.5%?" gets a model-backed answer instead of a six-week investigation.
PLANT MANAGER
Cascade risk shows up as a leading indicator, not a postmortem.
Plant-level dashboards roll up asset health into cascade risk scores by product line. Decisions about turnaround timing, parts purchasing, and crew levels are informed by 30-day forward forecasts.
SITE / OPERATIONS DIRECTOR
Compare sites on apples-to-apples reliability metrics.
Cross-site reliability dashboards reveal which plants run best practices and which carry hidden risk. Capital allocation decisions become defensible on data, not advocacy.
SAP MII vs. AI-Native Predictive Maintenance: Chemical Plant View
The honest side-by-side for chemical manufacturing. SAP MII still has legitimate strengths in integration and dashboarding. The gap on the actual predictive workload is wide and growing.
How a Migration Actually Runs
Chemical plants cannot accept big-bang cutovers any more than refineries or pharma plants can. The migration pattern that works is phased, validated, and aligned to natural plant operating cycles. Below is what the typical sequence looks like.
WEEKS 1–4
Asset Inventory & Sensor Gap Analysis
Walk every critical asset. Identify existing sensor coverage and gaps. Tag every MII analytics artifact for preserve, transform, or retire. Map asset criticality against cascade-risk contribution. Output: focused predictive maintenance scope with realistic effort estimate.
WEEKS 4–8
Sensor Installation & Edge Deployment
Add the sensors needed to close the gap analysis — primarily vibration and acoustic sensors on critical rotating equipment. Deploy edge processing nodes near the sensors. Connect to plant historian (PI, OSIsoft, IP21) and DCS. Validate data integrity end-to-end.
WEEKS 8–14
Model Training on Plant-Specific Data
Train machine learning models on historical data for the assets being onboarded. Calibrate against known historical failures. Tune thresholds. Validate predictions against operator and reliability engineer expert judgement. Document model lifecycle controls.
WEEKS 14–20
Pilot Operation & Parallel Run
Run AI predictive maintenance alongside existing SAP MII analytics for one full operating cycle. Compare predictions against actual events. Refine models. Build operator confidence. Document the first measurable ROI in avoided downtime or unnecessary maintenance.
MONTHS 6–18
Expand Across Asset Categories & Sites
Roll out to additional asset categories. Onboard additional plants. Each site phases in with parallel run and stable-quarter validation. MII analytics retire site-by-site as new platform delivers consistent results. Audit and cyber insurance posture updated.
Frequently Asked Questions
Do we need to replace all existing sensors to run AI predictive maintenance?
No. Most chemical plants already have substantial sensor coverage on critical assets through their DCS and historian. The gap analysis typically identifies a focused set of additions — usually vibration and acoustic sensors on rotating equipment that today only has process measurements. Adding sensors only where the model needs them keeps capital cost contained.
Book a Demo for a sensor-gap walkthrough.
How does the AI handle different chemistries and process conditions?
Models are trained or fine-tuned on plant-specific data. A bearing-wear pattern in a high-temperature service looks different from the same wear in ambient conditions. The platform supports per-asset, per-service model variants. The pattern library includes pre-trained baselines for common chemistries; plant-specific calibration tunes for the rest.
Talk to Support about your specific process families.
What is the false-positive rate? Will we get alert fatigue?
False-positive rates below 7% are typical in benchmark deployments after model calibration. Alert fatigue is mitigated by ranking predictions by failure probability and remaining useful life — operators see the highest-priority assets first, not a flat list of all flagged equipment. Continuous model refinement drives false-positive rates lower over time.
Book a Demo to see alert prioritization in practice.
Will this integrate with our existing CMMS — SAP PM, Maximo, Infor EAM, or Oracle EAM?
Yes. Bi-directional API integration is standard for all major CMMS platforms. Predictive alerts auto-generate work orders with failure mode diagnosis, recommended parts, and urgency level. Maintenance completion data flows back to validate and improve future predictions. The CMMS remains the system of record for work order execution.
Talk to Support for CMMS integration patterns.
Can the AI run on-prem? Our process IP and recipes cannot leave the facility.
Yes. The platform runs on-prem, hybrid, or cloud — your choice. For chemical plants with IP-critical recipes, control parameters, or proprietary catalyst formulations, on-prem deployment keeps everything inside the facility perimeter. Edge inference handles real-time decisions; aggregated metrics can optionally synchronize to a private management console.
Book a Demo for on-prem architecture details.
What is a realistic first step we can take this quarter?
A 4–6 week pre-migration assessment focused on one high-value asset category — typically centrifugal pumps and compressors in a critical unit. Output: complete sensor gap analysis, ROI estimate based on documented industry benchmarks, identified quick-win predictive maintenance use case, and a phased migration plan with effort estimates. Many plants then run an 8-week pilot to confirm the value before broader rollout.
Talk to Support to scope it.
Stop the Cascade Before It Starts. Predict Failures Weeks Ahead. Reduce Downtime, Maintenance Cost, and Risk in Parallel.
Across reactors, pumps, compressors, heat exchangers, distillation columns, and control valves, AI-native predictive maintenance delivers the multi-modal, model-based, failure-specific analytics that SAP MII was never designed to provide. iFactory ships the platform, sensors, edge nodes, and migration playbook as a single integrated capability for chemical manufacturing.
$20B annual industry waste addressable through prediction
7–21 days of failure forewarning with 89% average accuracy
25–40% lower maintenance cost; 40% less unplanned downtime
200–400% ROI within 12–18 months; payback in 8–14 months
Bi-directional CMMS integration with SAP PM, Maximo, Infor, Oracle